

2024 Airdrop Exposed: Uncovering Fortune Opportunities and Avoiding Risk Traps
TechFlow Selected TechFlow Selected
2024 Airdrop Exposed: Uncovering Fortune Opportunities and Avoiding Risk Traps
Projects with high distribution ratios and minimal lock-up mechanisms perform better.
Author: 0x Laodong
🔹 2024 Airdrop Leaderboard
• Highest FDV on launch day: StarkNet, $19.2 billion.
• Highest airdrop value: Hyperliquid, $2.613 billion, averaging $28,000 per address.
• Top zero-cost farming opportunity: Movement, $734.8 million in airdrops.
• Most airdrop recipients: HMSTR, 129 million Telegram accounts, average $3 per account.
• Biggest gainer: UXLINK, up 15x from launch-day closing price to all-time high (ATH).
• Biggest loser: HLG, down 90.66% over 30 days.
💡 Key Insights
-
Emerging narrative sectors are rising while traditional favorites cool off. Mature sectors such as infrastructure, Layer2, and GameFi saw an average 30-day return of -1.34%, whereas new narratives like DePIN, RWA, and AI achieved an average 30-day gain of 41.98%. Investors should pay closer attention to emerging trends.
-
Elevated valuations in 2024 projects reflect optimistic market expectations. Among 79 projects, the average FDV-to-funding ratio at launch was 103.9x, indicating high overall valuations and bullish sentiment, though potential bubbles may exist.
-
Speculative trading dominates early stages, leading to extreme volatility. 40% of projects reached their ATH on Day 1, while only 1% hit their ATL on launch day. This suggests strong initial sell pressure and widespread short-term speculation, often followed by rapid price corrections.
-
Short-term price declines are common among most projects. 62% showed declining prices within 7 days, increasing to 65% within 30 days. The majority face downward pressure post-TGE, with both the proportion and magnitude of losses growing over time.
-
Projects with larger distribution ratios and fewer vesting restrictions perform better. Tokens with higher airdrop allocations tend to be more stable and deliver stronger performance, averaging a 16.66% gain over 30 days. In contrast, tokens with lock-up mechanisms underperformed significantly, posting an average 30-day loss of -43.73%.
-
Greater exchange presence correlates with higher market recognition. As the number of listed exchanges increases, so do average funding amounts and FDV, reflecting improved market acceptance, enhanced liquidity, and greater investor risk tolerance.
🧑💻 Introduction
2024 marked a transitional year between bull and bear markets, characterized by exceptional volatility in the crypto space. Bitcoin surged from its年初 low of $38,500 to surpass its previous all-time high, eventually exceeding $100,000. Meanwhile, as market enthusiasm rebounded, project launches became increasingly frequent.
Compared to just 270 token generation events (TGEs) in 2023, the number jumped to 731 in 2024—an increase of 170%. Among these, only a small fraction offered substantial rewards ("big hairs" or "medium hairs"), while most remained minor airdrops ("small hairs" or "dick hairs"). How have these projects performed after launch?
To answer this question, Laodong selected 100 representative and high-profile projects from 2024 and conducted a systematic analysis based on key metrics including funding size, price performance, and distribution rules. This report reveals current trends and patterns in airdropped projects through data-driven insights, helping readers understand the landscape of 2024's TGEs.
🔗 Data Table
This article does not constitute any investment advice; it is purely for objective data collection and analysis.
📊 Data Analysis
1. 2024 TGE Sector Breakdown
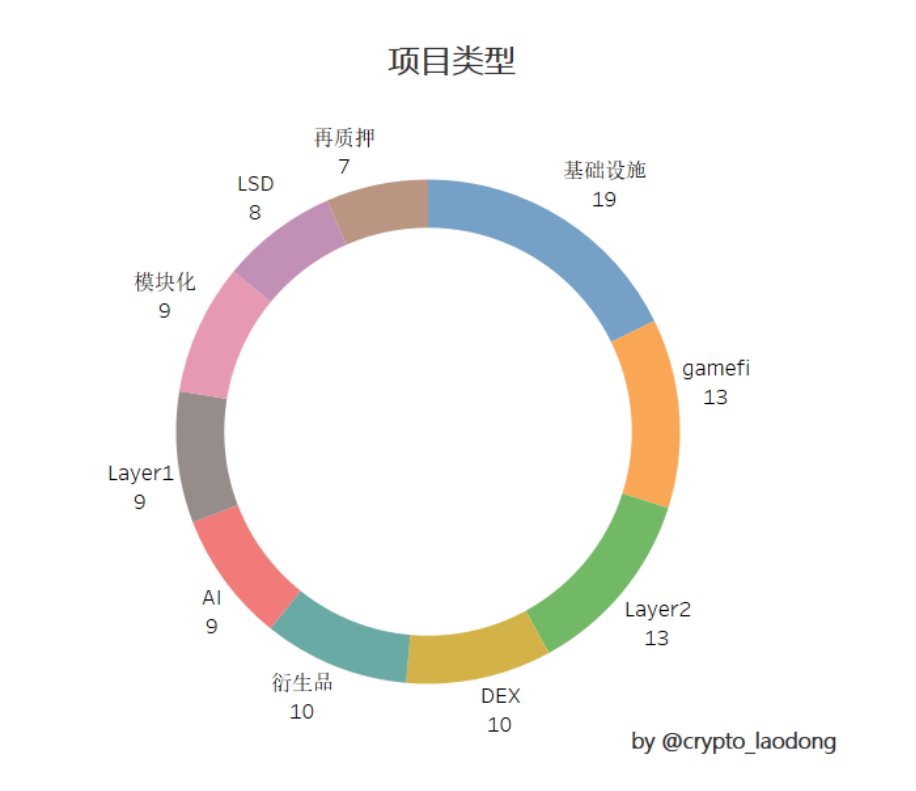
The chart illustrates the distribution of project types in 2024. VC-backed TGEs were primarily concentrated in traditional hot sectors—infrastructure, GameFi, and Layer2. These projects typically require long development cycles, many having been built over the past few years before launching in 2024.
-
Infrastructure projects: 19, with a 30-day average return of +12.18%
-
Layer2 projects: 12, with a 30-day average return of -0.2%
-
GameFi projects: 12, with a 30-day average return of +2.3%
This year’s dominant emerging narratives revolved around DePIN, RWA, and AI. Though relatively few in number, these projects delivered outstanding performance and could continue to surge in the future.
-
AI projects: 3, with a 30-day average return of +24.56%
-
DePIN projects: 3, with a 30-day average return of +53.56%
-
RWA projects: 3, with a 30-day average return of +42.17%
Traditional popular sectors are gradually cooling down, while new narratives are rapidly gaining momentum. Focusing on emerging narratives may offer superior investment opportunities.
2. Funding and FDV Analysis
Among the 100 projects analyzed, 79 disclosed funding information, with an average raise of $38.91 million.
-
Eight projects raised over $100 million.
-
Forty-four projects fell into the $10 million–$100 million range—the largest group.
-
Twenty-six projects raised between $2 million and $10 million.
Venture capital firms typically conduct rigorous due diligence, reflecting market confidence in the projects. Larger funding amounts generally indicate stronger investor conviction in future prospects. Funding frequency can also signal sector热度 and capital focus. However, funding alone cannot determine project quality—we must analyze from multiple dimensions.
FDV (Fully Diluted Valuation) assesses a project's potential future value. Before launch, FDV is influenced by various factors, including funding amount, initial circulating supply, market sentiment, narrative appeal, sector热度, liquidity, and trading depth.
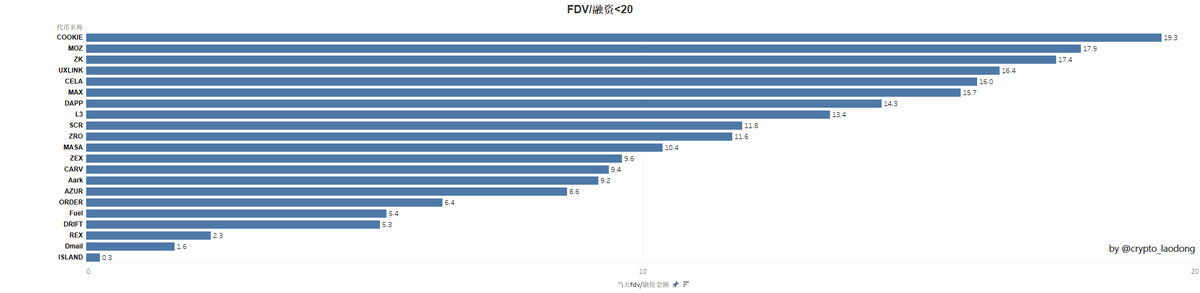
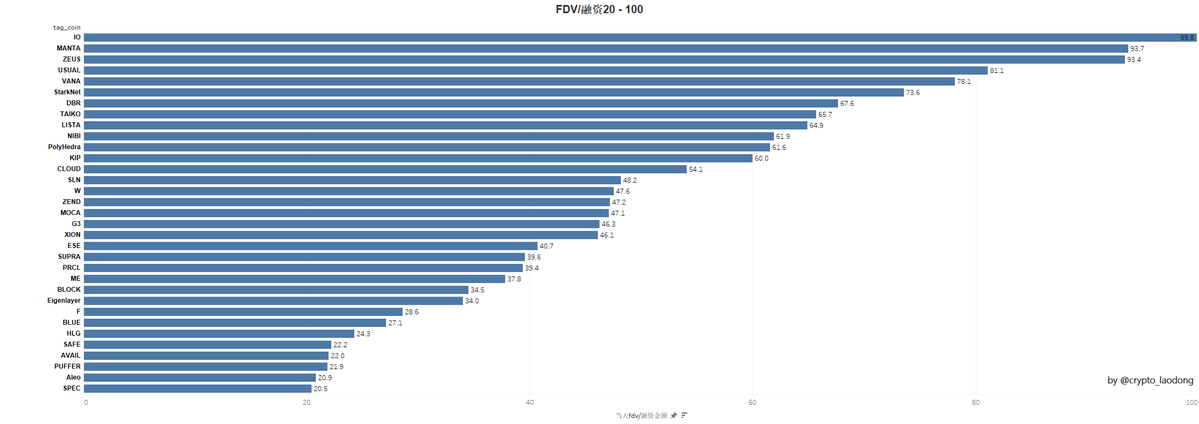
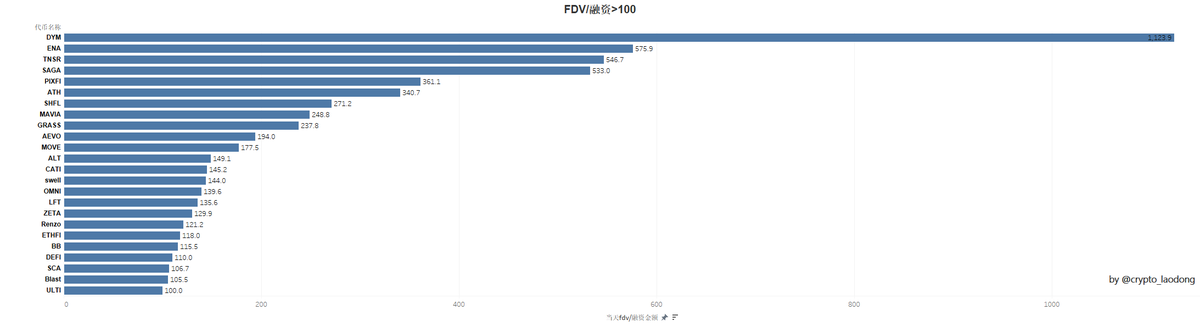
To objectively evaluate the relationship between initial valuation and actual funding, we categorized projects using the FDV/funding ratio based on closing price on launch day, then analyzed their market performance across different ranges:
-
FDV/Funding 0–20: Reasonable or conservative. 21 projects fall into this range, with an average funding of $48.83 million. 57% failed to exceed their launch-day closing price within 7 or 30 days, suggesting moderate market expectations, reasonable valuations, and lower investment risk.
-
FDV/Funding 20–100: Elevated expectations. 33 projects in this range had an average funding of $51.64 million. 63.6% declined within 7 days, rising to 75.8% within 30 days—indicating high initial optimism but significant near-term pullbacks and elevated volatility.
-
FDV/Funding >100: High-risk speculative zone. 24 projects here had an average funding of $12.72 million—all relatively small-scale with none exceeding $100 million in funding. 70.8% weakened within 7 days, dropping to 54.2% by day 30. These projects were mostly clustered in hot sectors like infrastructure, GameFi, and LSD.
Across the 79 funded projects, the average FDV/funding ratio was 103.9x, confirming that 2024 projects were broadly overvalued with optimistic market sentiment.
3. ATH vs. ATL Analysis
Analyzing ATH (All-Time High) and ATL (All-Time Low) helps assess overall market performance and investor reception. By examining ATH/launch price and launch price/ATL, we can gauge profit potential and selling pressure, offering data support for evaluating stability, fair valuation, and optimal entry timing.
Among the 100 projects, 40% reached their ATH on Day 1, while only 1% hit their ATL on launch day.
-
Price trend statistics: 40% of projects peaked on Day 1. Only 1% bottomed out on launch day.
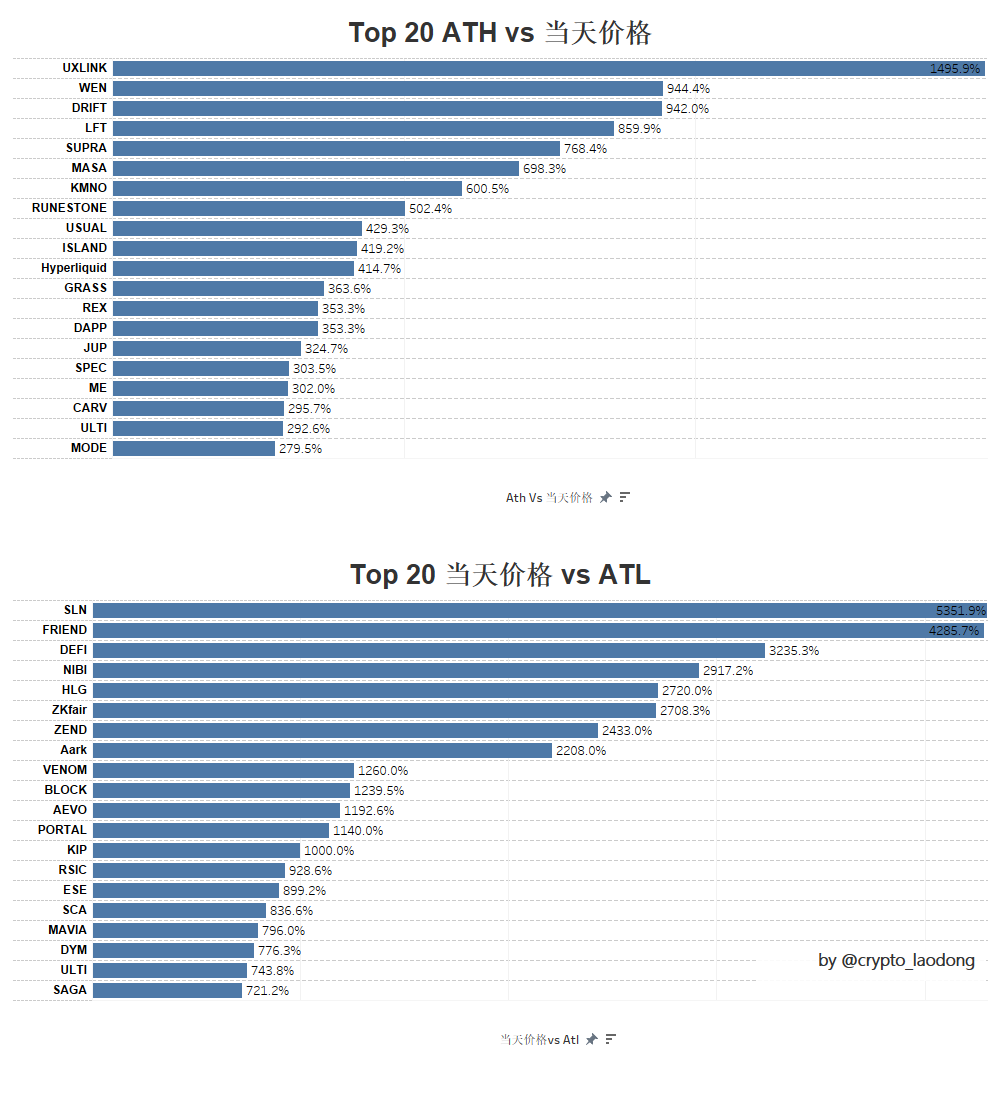
-
ATH vs. launch price averaged +245.22%, meaning prices could rise 2.45x from launch to peak. Top performers include UXLINK, WEN, and DRIFT.
-
Launch price vs. ATL averaged +633.52%, indicating a 6.34x recovery needed from the lowest point. Worst performers: SLN, FRIEND, DEFI.
Strong speculative sentiment is evident—40% of projects hit their ATH immediately, showing widespread front-running behavior, which often leads to sharp corrections afterward.
The disparity between +245.22% upside and +633.52% downside highlights that selling pressure far outweighs profit potential. Initial price surges are often driven by hype, but quickly reverse due to profit-taking, unlocks, or weak fundamentals.
4. Short-Term Price Trend Comparison
This section analyzes short-term price movements. Comparing launch-day closing prices with 7-day and 30-day prices clarifies immediate post-launch trends.
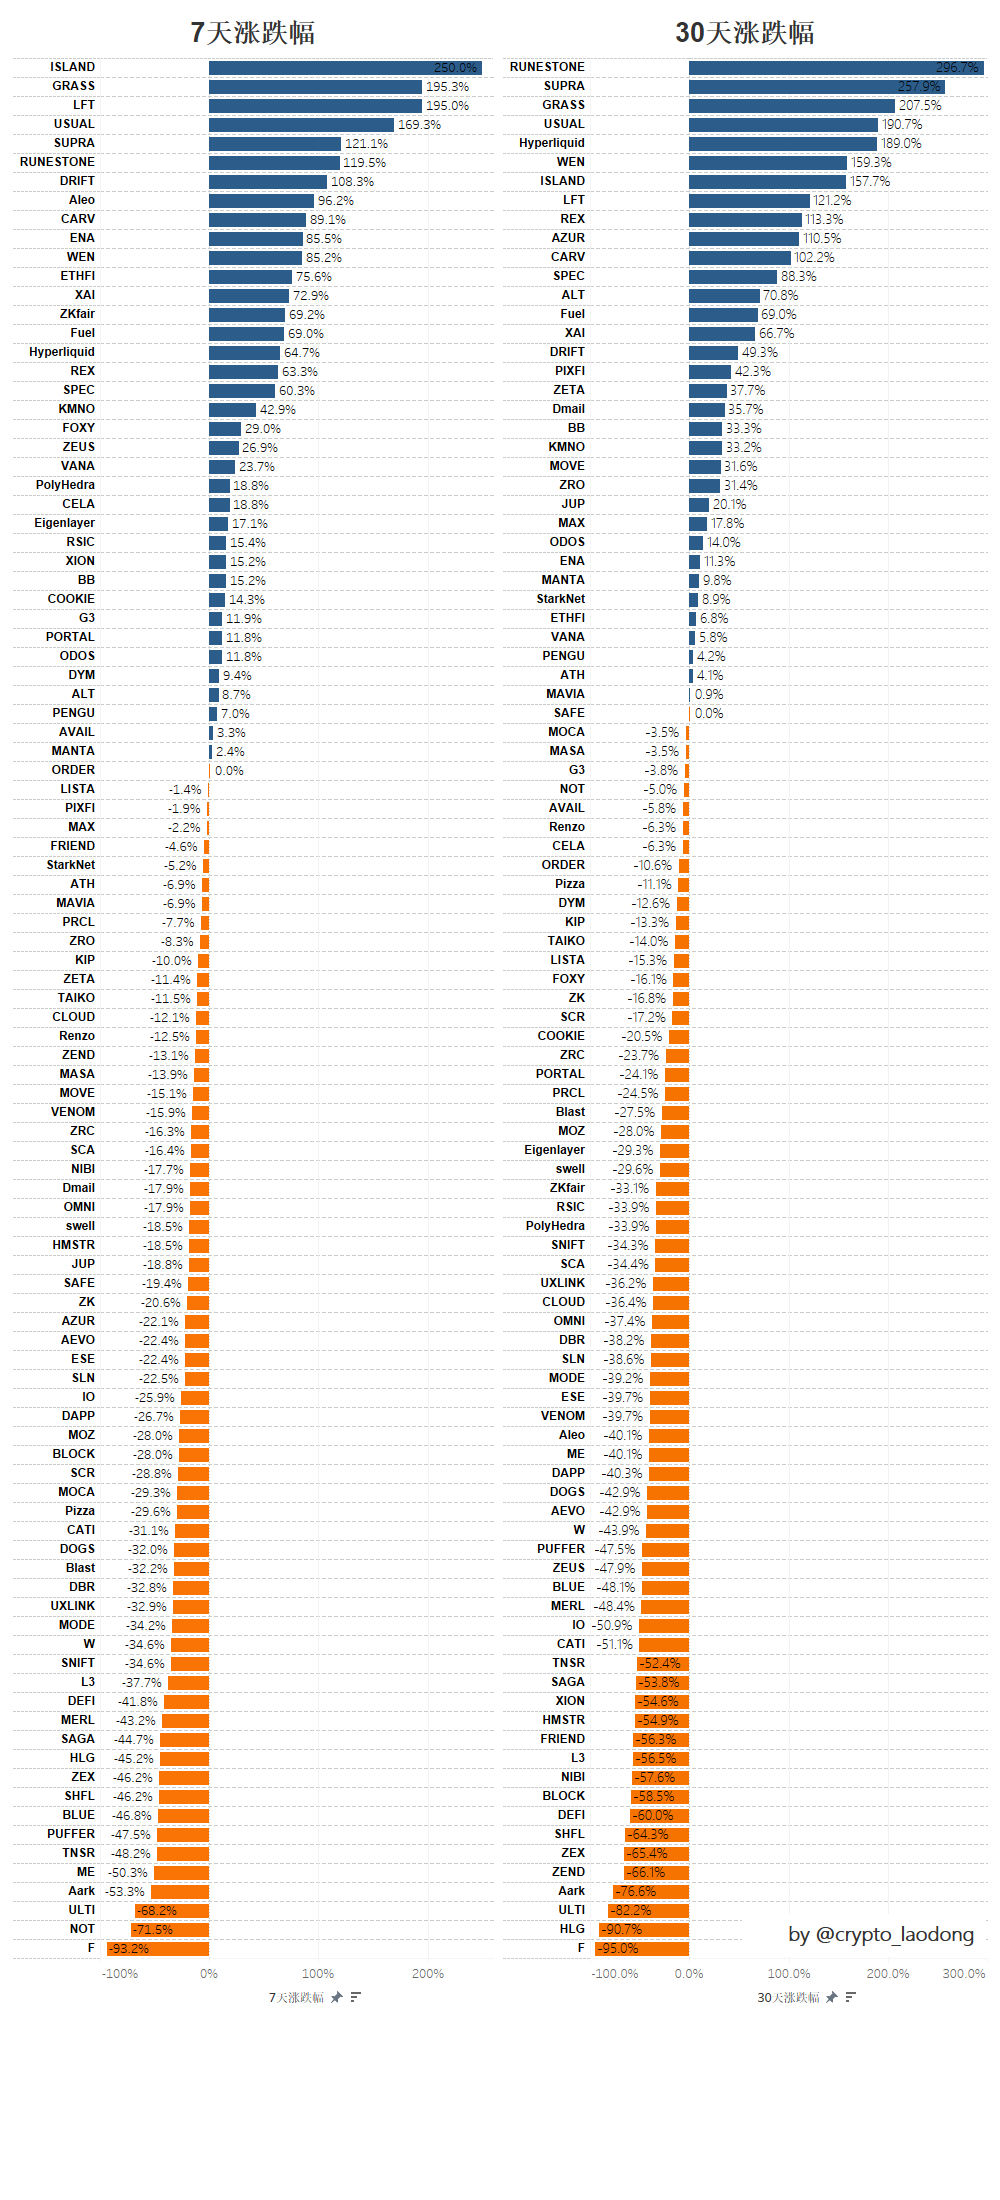
From the chart:
-
Day 7:
62% of projects traded below their TGE closing price, averaging a 27.03% decline. 38% remained above, averaging a 60.34% gain.
-
Day 30:
65% traded below their TGE closing price, averaging a 37.42% drop. 35% stayed above, averaging a 74.26% gain.
The vast majority face downward pressure shortly after TGE, with both the proportion and severity of declines increasing over time.
Despite the broad downtrend, a minority of projects perform exceptionally well, achieving significant gains. High-quality projects can gain strong market recognition and deliver outsized returns in the short term.
Top performers: ISLAND, GRASS, RUNESTONE. Worst performers: F, AARK, HLG.
Potential reasons for short-term gains:
-
Strong fundamentals: Projects with solid technology, clear use cases, or innovative business models attract long-term investors, driving prices up.
-
Narrative-driven momentum: Projects aligned with current market themes (e.g., GameFi, memes, DePIN, RWA) easily draw capital inflows and price appreciation.
-
Strong community consensus: Broad community support boosts visibility and demand, pushing prices higher. Ongoing engagement also mitigates sell-offs and enhances long-term resilience.
-
Healthy liquidity: Good liquidity stabilizes prices and builds investor confidence.
Potential reasons for short-term declines:
-
Cooling market sentiment: Launch-day prices are often inflated by FOMO (fear of missing out), exceeding fair value. As hype fades, prices correct downward.
-
Increased selling pressure: Post-TGE, investors—especially airdrop recipients and short-term traders—may cash out profits, increasing supply and driving prices down.
-
Token unlocking schedules: Many VC-backed tokens follow long-term vesting plans. As tokens unlock, early investors (private sale participants, team members) may sell, adding further downward pressure.
-
Poor liquidity: Some projects suffer from shallow order books post-launch. Large sell orders can trigger sharp price drops and increased volatility.
5. Impact of Distribution Ratio on Price
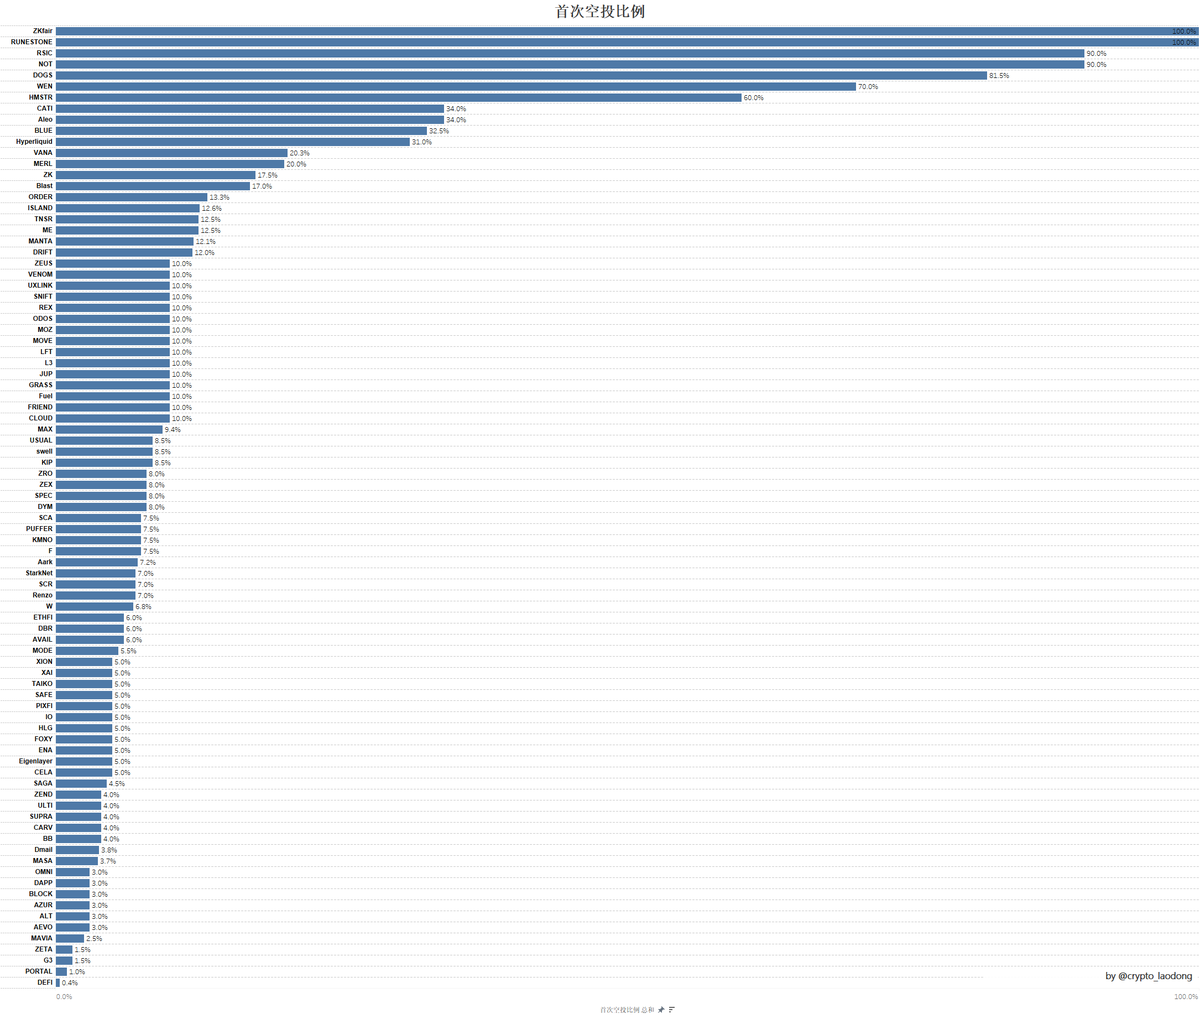
-
**Airdrop share >15%**: 15 projects, averaging +11.87% gain at 7 days and +16.66% at 30 days.
-
**Airdrop share <15%**: 76 projects, averaging +8.31% gain at 7 days and +3.36% at 30 days.
-
**With vesting/lock-up mechanisms**: 10 projects, averaging -16.68% at 7 days and -43.73% at 30 days.
Data shows that projects with larger airdrop distributions perform more stably in the short term, while those with strict lock-up terms underperform and experience greater volatility.
6. Exchange Listings and Project Performance
Different exchange listings—and listing on multiple platforms—can significantly impact market perception. To better understand how major exchanges affect project outcomes, Laodong compiled data on listing counts, price changes, and FDV implications, enabling more informed investment decisions.
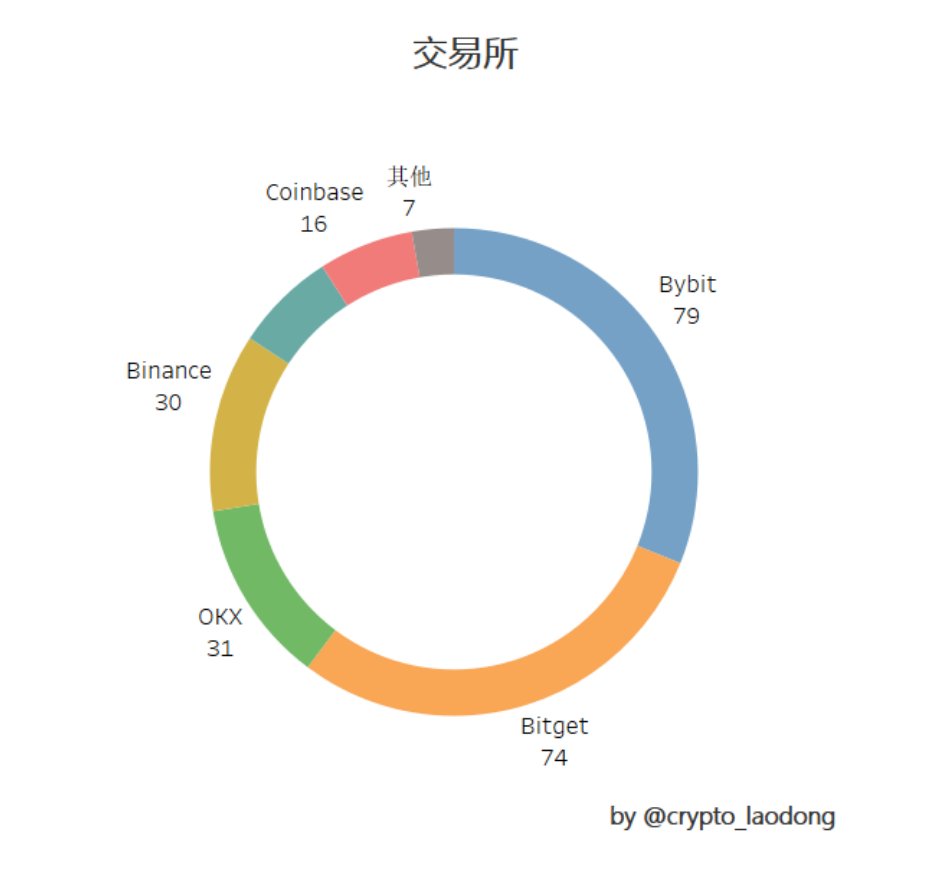
-
Binance: 30 listings, 7-day change: -0.02% (12 up, 40%), 30-day change: -4.57% (12 up, 40%)
-
OKX: 31 listings, 7-day change: -13.06% (7 up, 22.58%), 30-day change: -18.75% (10 up, 32.26%)
-
Bybit: 79 listings, 7-day change: +2.27% (29 up, 36.7%), 30-day change: -4.65% (28 up, 35.44%)
-
Bitget: 74 listings, 7-day change: +6.57% (26 up, 35.14%), 30-day change: +3.3% (28 up, 37.84%)
-
Coinbase: 16 listings, 7-day change: -3.68% (3 up, 18.75%), 30-day change: +26.64% (6 up, 37.5%)
-
Upbit: 17 listings, 7-day change: -5.05% (3 up, 17.65%), 30-day change: +2.94% (9 up, 52.94%)
In terms of listing volume, Coinbase and Upbit list fewer projects, reflecting a cautious approach focused on long-term stability and regulatory compliance, avoiding experimental or high-risk launches. In contrast, Bybit and Bitget adopt aggressive listing strategies, frequently introducing new tokens to attract users and capture market share—helping boost trading volume and liquidity.
Regarding short-term price performance:
-
Bitget and Bybit show relatively strong results, with Bitget delivering positive returns at both 7-day and 30-day marks and a high percentage of winners.
-
Coinbase stands out, especially over 30 days (+26.64%) with 37.5% of projects in the green.
-
OKX and Binance both show negative 30-day trends, particularly OKX (-18.75%), underperforming notably.
-
Upbit recovers over 30 days (+2.94%) with 52.94% of projects rising—solid performance.
-
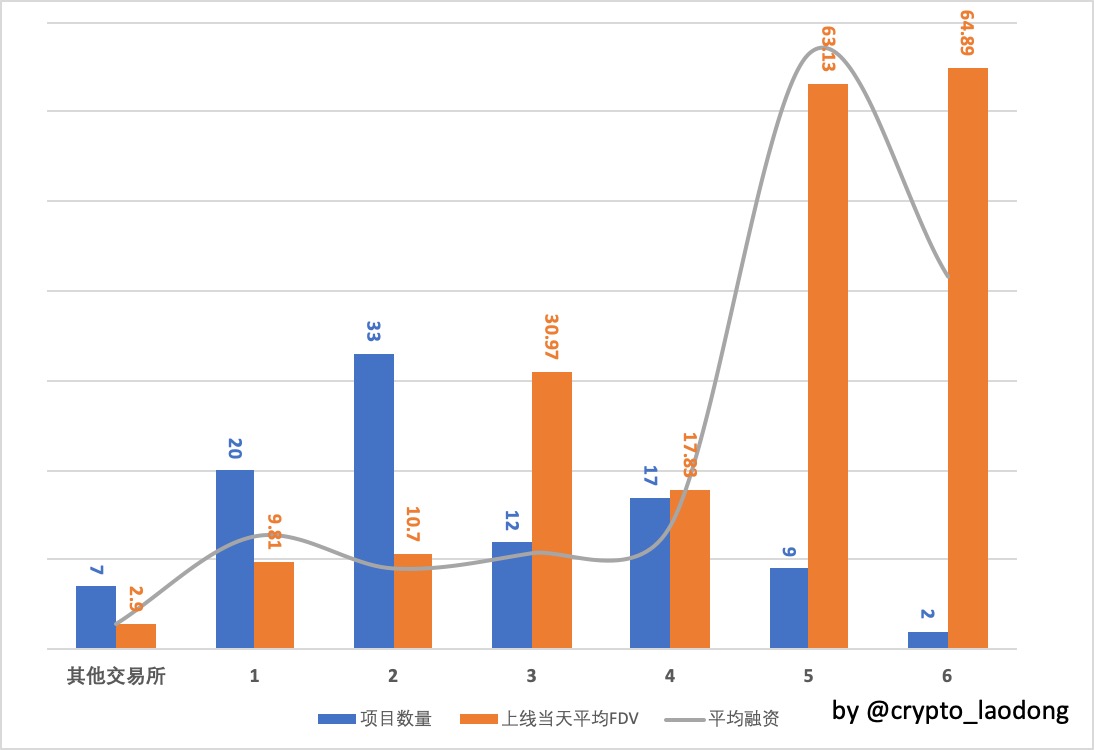
Other exchanges: 7 projects, average funding $6.5M, average launch-day FDV $290M
-
Listed on 1 exchange: 20 projects, average funding $28.86M, average FDV $981M
-
Listed on 2 exchanges: 33 projects, average funding $20.68M, average FDV $1.07B
-
Listed on 3 exchanges: 12 projects, average funding $24.57M, average FDV $3.097B
-
Listed on 4 exchanges: 17 projects, average funding $31.67M, average FDV $1.783B
-
Listed on 5 exchanges: 9 projects, average funding $152.15M, average FDV $6.313B
-
Listed on 6 exchanges: 2 projects, average funding $95.2M, average FDV $6.489B
As the number of exchange listings increases, both average funding and launch-day FDV rise significantly—indicating higher market credibility, improved liquidity, stronger risk resilience, and broader investor appeal.
Join TechFlow official community to stay tuned
Telegram:https://t.me/TechFlowDaily
X (Twitter):https://x.com/TechFlowPost
X (Twitter) EN:https://x.com/BlockFlow_News


