
Short sellers fight back, key support for BTC near $88,000
TechFlow Selected TechFlow Selected
Short sellers fight back, key support for BTC near $88,000
The decline may be due to an overheated leveraged market.
 Navigating Web3 tides with focused insights
Author: BitpushNews
On Tuesday, the cryptocurrency market continued its correction trend.
Data from Bitpush showed that after hitting a morning high of $95,000, Bitcoin remained under pressure. Bulls attempted a rebound in the afternoon but faced bearish resistance at $94,800, causing price to briefly drop below $91,000. At the time of writing, Bitcoin was trading at $91,646, down 2% over the past 24 hours. The altcoin market performed even weaker, with over 90% of the top 200 tokens by market capitalization posting losses.
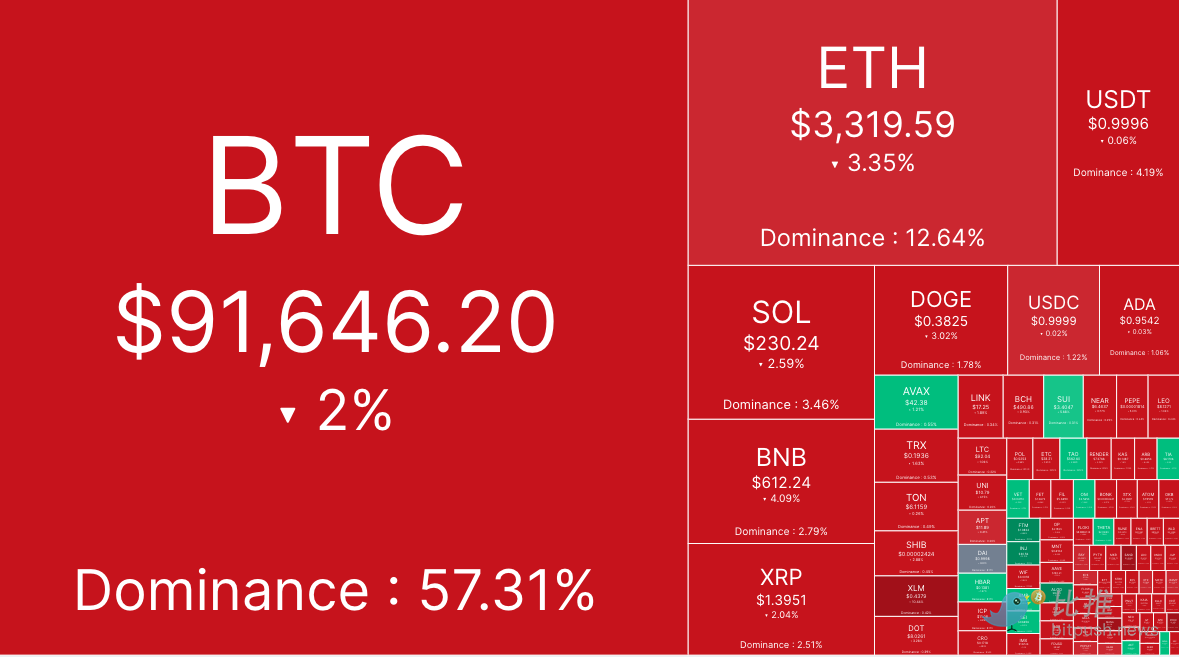
The total market capitalization of cryptocurrencies currently stands at $3.14 trillion, with Bitcoin's dominance at 57.3%.
In U.S. equities, the S&P 500, Dow Jones Industrial Average, and Nasdaq Composite all closed higher, rising 0.57%, 0.28%, and 0.63% respectively.
Falling Prices May Be Due to Overheated Leveraged Markets
One contributing factor to Bitcoin’s decline may be excessive leverage in the market. When volatility occurs, leveraged positions are often liquidated, exacerbating downward price movements.
Data analytics platform IntoTheBlock expressed a similar view, suggesting that Bitcoin’s pullback could “be attributed to” rising funding rates, which ultimately tilted the market toward bearishness. However, as funding rates return to normal levels, further leveraged liquidations should be limited.
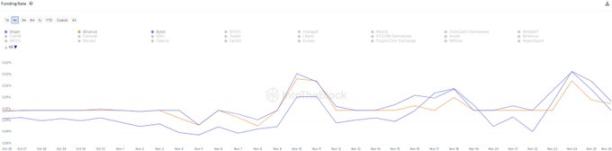
Byzantine General, a cryptocurrency futures market analyst, noted that based on trading volume, Bitcoin’s current price action resembles previous local tops. He said, “Bitcoin is likely to enter a period of sideways consolidation for now. During this time, however, some other cryptocurrencies might perform well.”
From a technical perspective, Bitcoin may retest liquidity zones near the psychological $90,000 level, or potentially decline further toward $85,000.
This is because Bitcoin’s rally between November 6 and November 22 was extremely rapid, without clear imbalances between buying and selling. Such swift advances are typically followed by corrections to rebalance supply and demand. As such, Bitcoin may retrace to prior support levels—or lower—to absorb earlier gains.
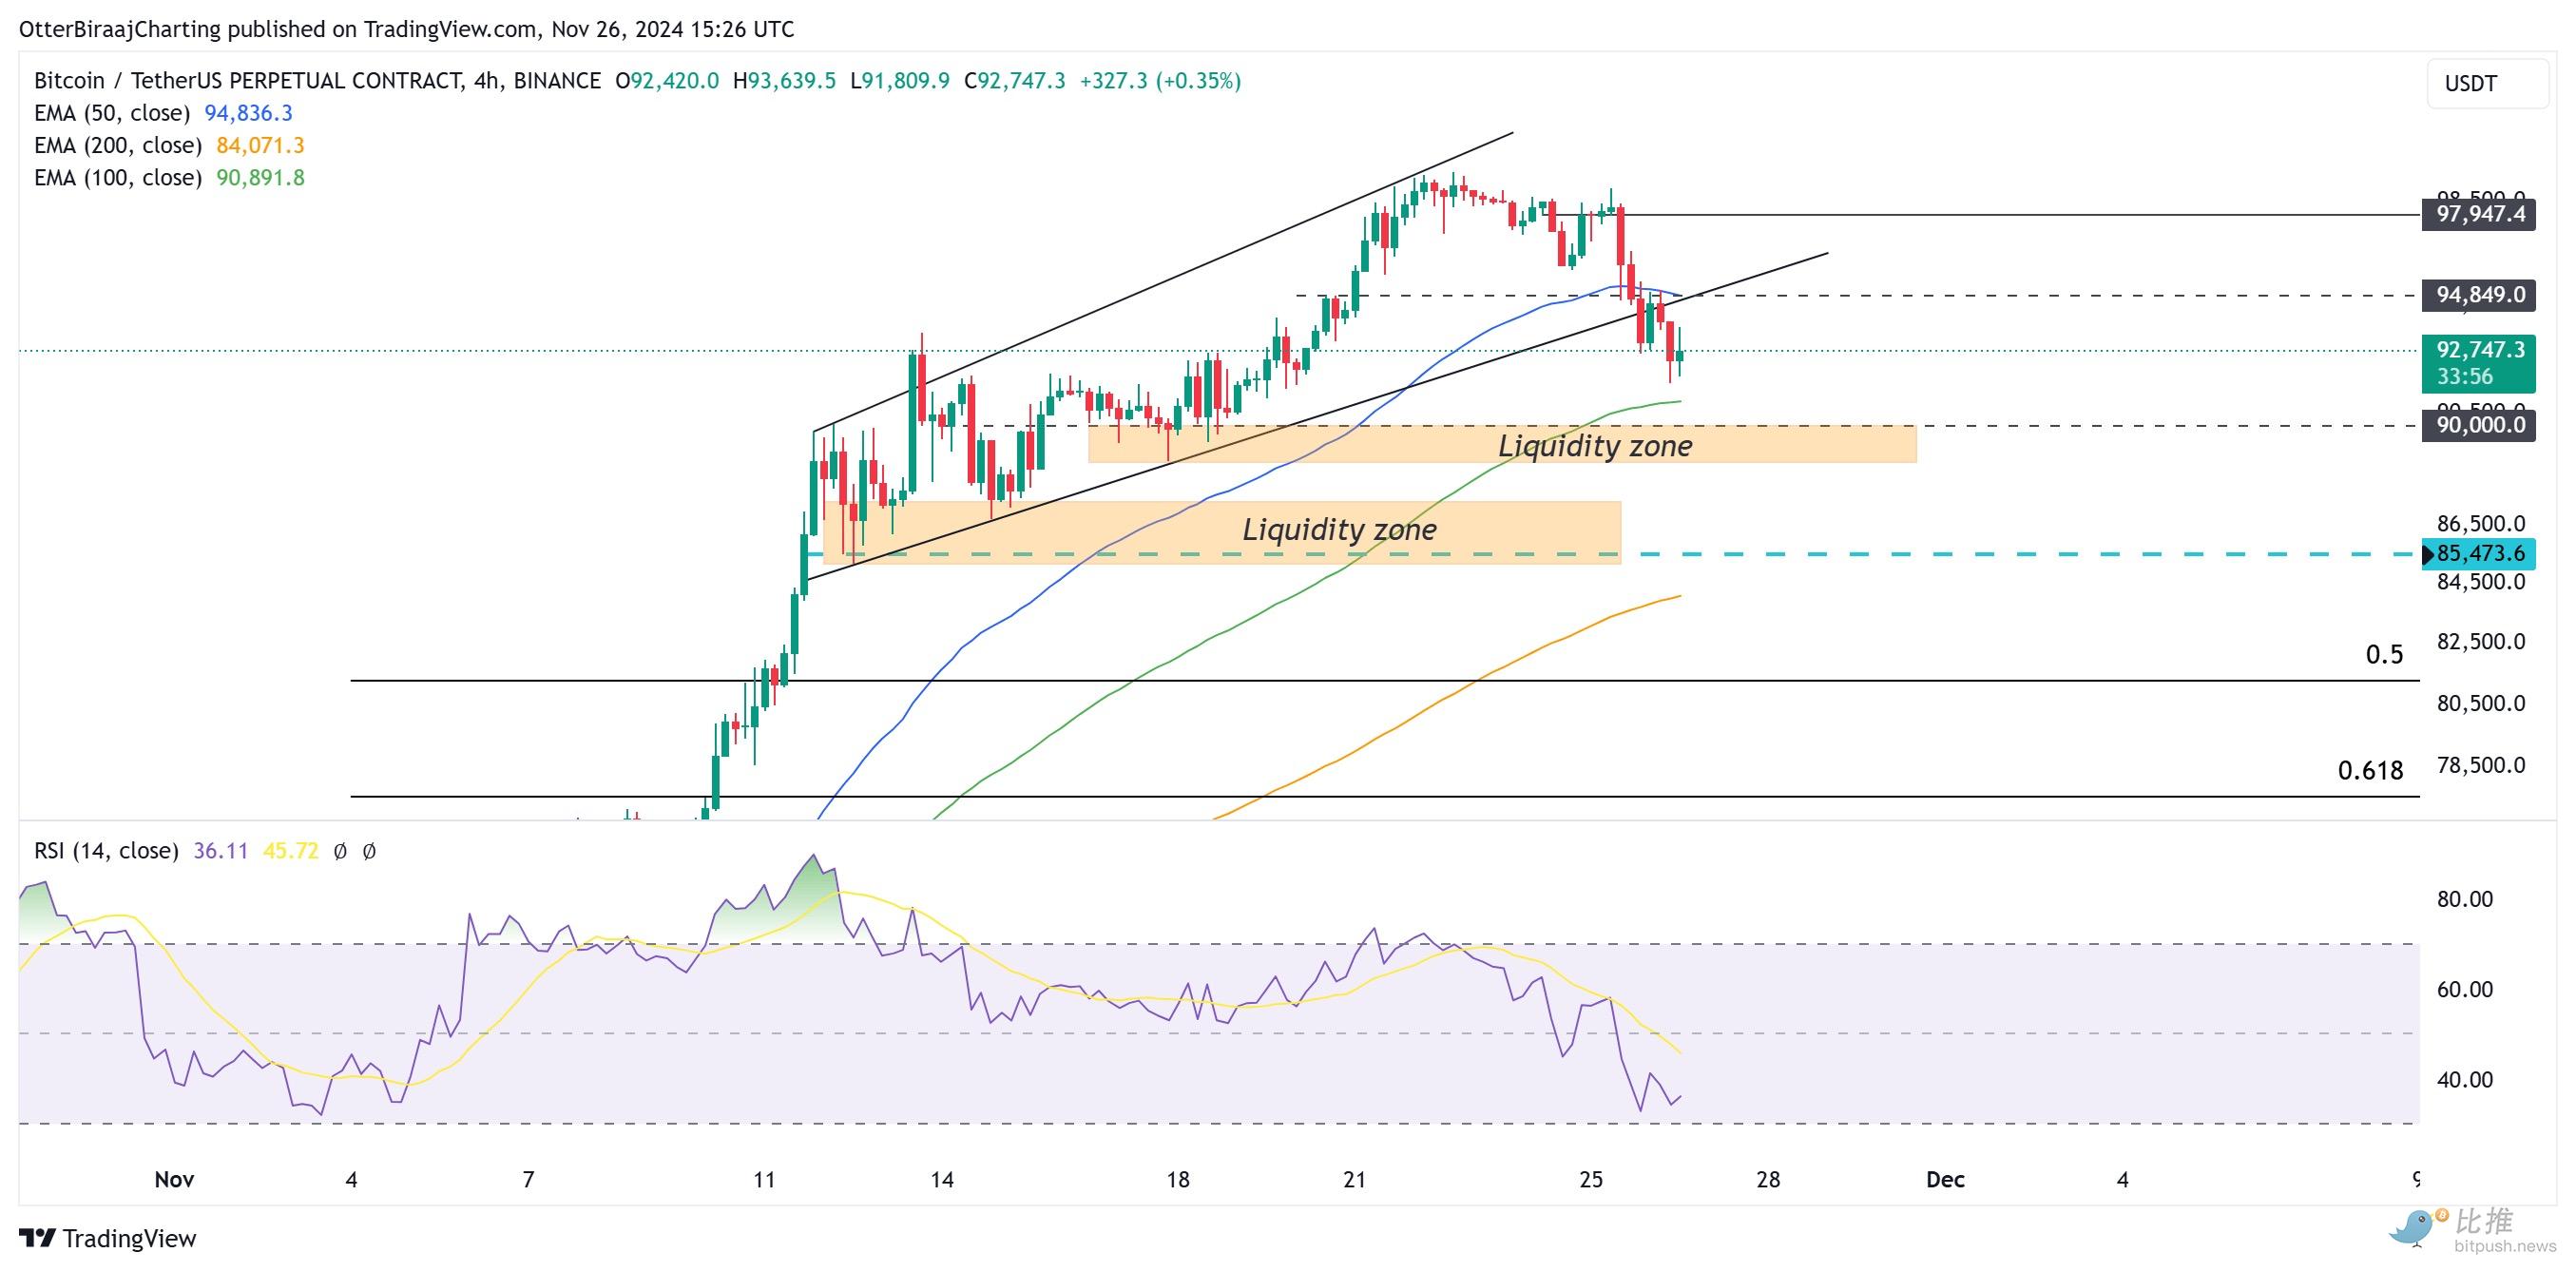
Additionally, with the Relative Strength Index (RSI) falling below 50 for the first time since November 6, sellers are expected to dominate price action over the coming week, potentially leading to a period of consolidation below $95,000.
Crypto research analyst CoinSeer believes key support for Bitcoin lies in the $85,000–$88,000 range, and a break below could trigger widespread cascading liquidations.
TradingView analyst TradingShot wrote: “Yesterday’s sharp Bitcoin correction caught the market off guard. Several fundamental reasons underlie this move: first, post-election euphoria is fading; second, there’s psychological pressure around the $100,000 mark. However, an even more important technical factor has been overlooked.”
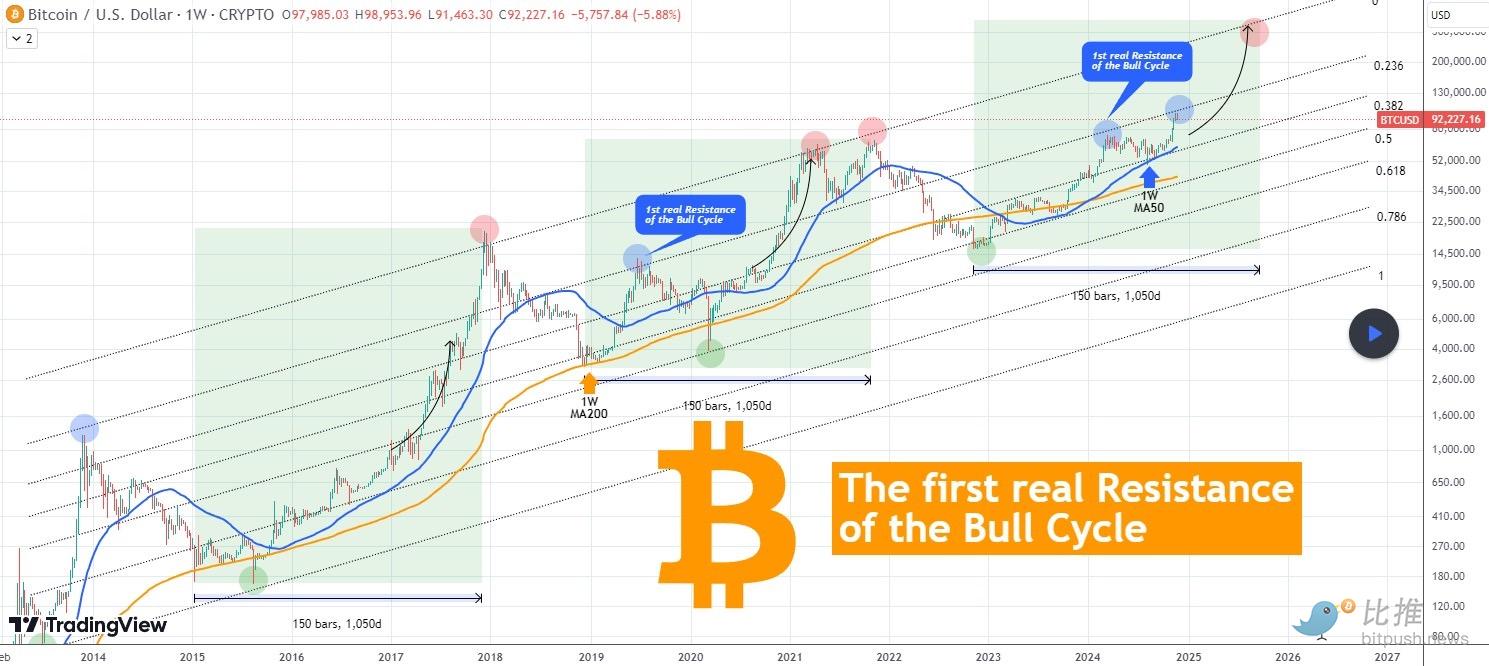
The analyst pointed out: “As shown in the chart, there exists a Fibonacci channel across the past three cycles—including the current one. This channel originates from the strong bounce that followed the peak formed in December 2013. In that cycle, the top occurred precisely at the 0.236 Fibonacci level, which also acted as resistance during the bull markets of June 24, 2019, and May 11, 2024.”
TradingShot stated that the recent pullback occurred because Bitcoin touched what he calls the “first real resistance of the bull cycle.”
He explained: “This is the recent Fibonacci trendline that blocked the rally on November 22. We can call it the ‘first real resistance of the bull cycle’ because it’s the first major resistance level encountered before the ultimate peak. In the past two cycles, the highs appeared at the 0.0 Fibonacci level—i.e., the top of the channel (red circles in the chart). The red dot at the end of 2025 is not a prediction, but merely for comparative illustration.”
TradingShot also observed: “Each previous bull cycle lasted approximately 150 weeks (1,050 days). If this pattern repeats, the peak could occur around late September or early October.”
He added: “Trying to time the top and exit is far more effective than chasing a precise price target. Interestingly, although BTC faces technical resistance, the current uptrend began exactly on August 5, 2024, at the 1-week MA50 (blue trendline). Technically speaking, as long as this trendline holds, the cyclical bull wave should remain intact.”
Join TechFlow official community to stay tuned
Telegram:https://t.me/TechFlowDaily
X (Twitter):https://x.com/TechFlowPost
X (Twitter) EN:https://x.com/BlockFlow_News
 比推 BitpushNews