WOO X Research: The raging bull has begun—how high can BTC go this cycle?
TechFlow Selected TechFlow Selected
WOO X Research: The raging bull has begun—how high can BTC go this cycle?
$73,000 BTC could be the bottom support level for this cycle.
 Navigating Web3 tides with focused insights
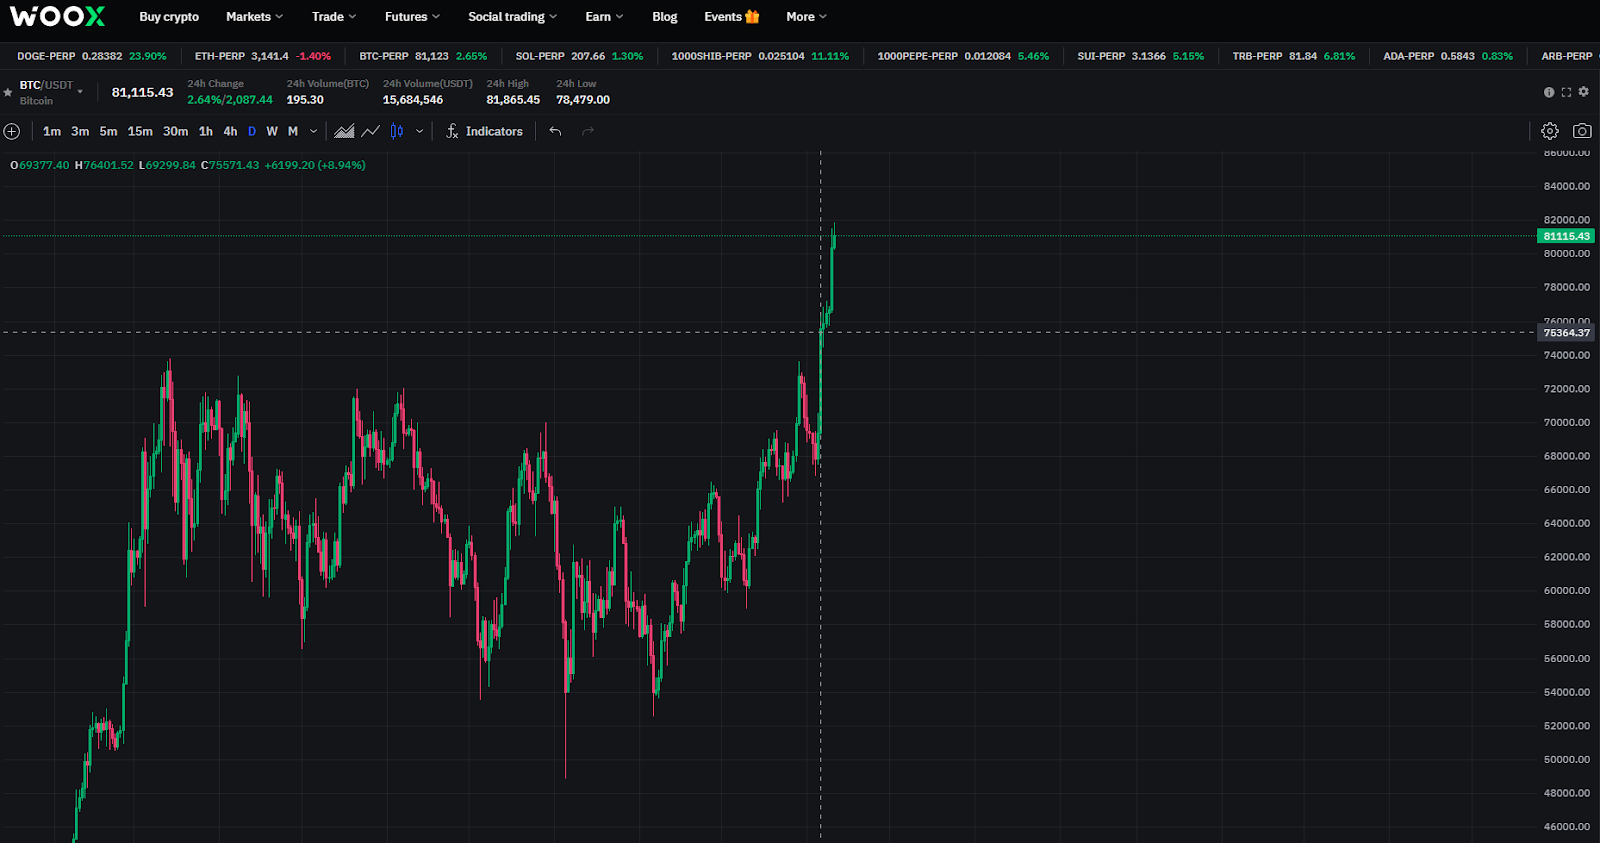
Bitcoin broke out of a six-month consolidation range on November 6, surging past $73,000. This move was closely tied to Trump's election victory and the start of the rate-cutting cycle.
-
Trump’s Election Win: Prior to the election, Trump pledged several crypto-friendly policies, including transforming the U.S. into a global cryptocurrency hub and removing the current SEC chair. While it remains uncertain how many promises he will fulfill once in office, it is clear that regulatory pressure—which has historically weighed heavily on the crypto market—will likely ease under his administration. This shift represents a key driver behind the bullish momentum.
-
Rate-Cutting Cycle Begins: Rate cuts signal increased liquidity flowing into risk markets. In theory, this benefits equities, foreign fiat currencies, and other risk assets. As the asset with the highest risk profile and relatively small market cap, Bitcoin stands to gain significantly. The November rate cut was positively received by traditional financial markets, with the S&P 500 closing at a new high and bond prices rising. Liquidity transmission takes time, and Q4 2024 offers ample opportunity for the crypto market to absorb this spillover liquidity.
With supportive policies and abundant liquidity, we are currently in the early stages of a bull market ("bull初"). Given Bitcoin’s tendency for its previous cycle peak to become the next cycle’s floor, we can reasonably assume that $73,000 marks the support level for this bull run.
With support confirmed, how high could Bitcoin go this cycle? WOO X Research dives into the analysis.
Bitcoin vs. Other Major Assets by Market Cap: $110K–$220K Target Range
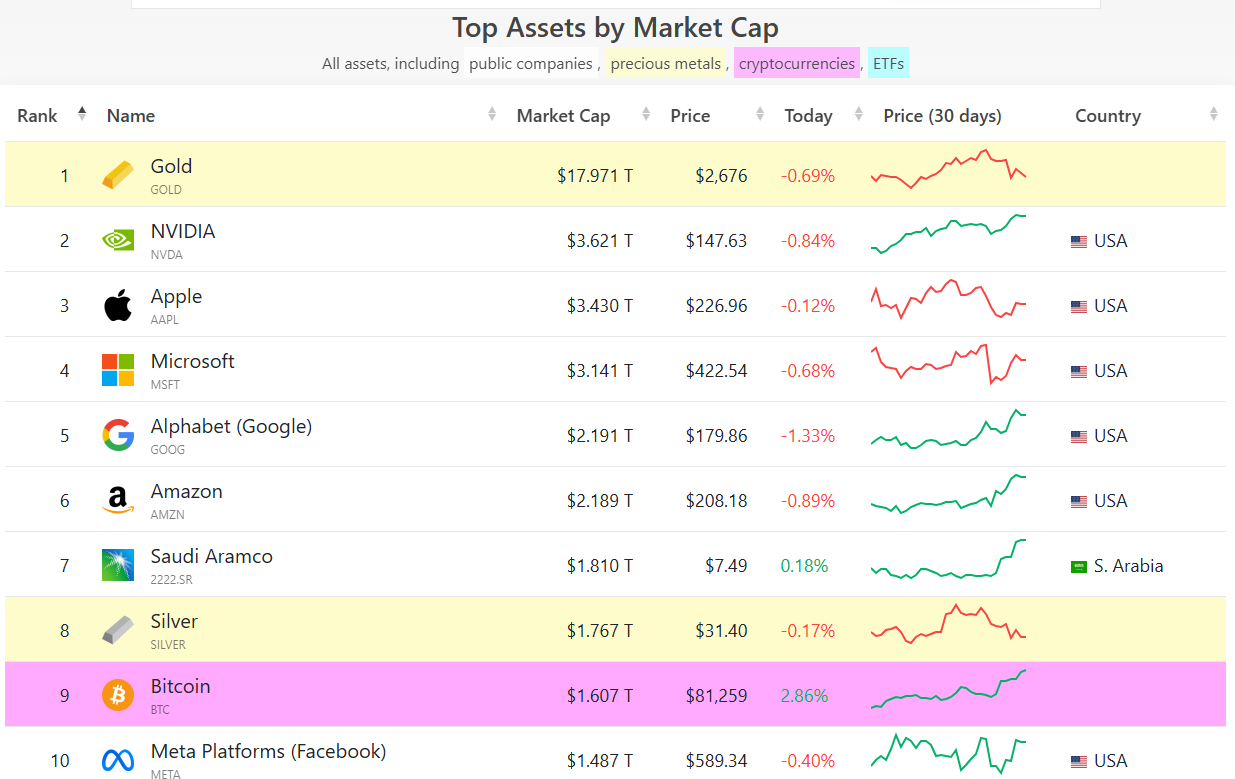
Bitcoin’s current market cap stands at $1.6 trillion, surpassing Meta last month and ranking ninth globally—just behind silver. Since the approval of spot Bitcoin ETFs in January, Bitcoin has transitioned from a niche asset to a mainstream one. Trump’s election victory has further amplified public attention, allowing Bitcoin’s growth potential to be benchmarked against other major assets.
As “digital gold,” Bitcoin’s market cap is currently about 9% of gold’s. Below are several scenarios projecting Bitcoin’s future price:
-
If Bitcoin reaches 25% of gold’s market cap ($4.5 trillion), its price would hit $227,162
-
If Bitcoin matches NVIDIA’s market cap, its price would reach $183,645
-
If Bitcoin overtakes Google to rank fifth globally, its price would reach $111,730
Based on market cap comparisons, Bitcoin could enter the top five global assets this bull cycle, with a projected peak range between $110,000 and $220,000.
Bitcoin Top-Picking Indicator: Peak Above $200K
This indicator uses two data points:
-
2-Year Moving Average (730-day, green line)
-
Five times the 2-Year Moving Average (red line)
How to use it:
-
When Bitcoin’s price falls below the 2-year MA (green line), it signals a strong buying opportunity
-
When the price exceeds five times the 2-year MA (red line), it signals time to sell
Interpretation: The green line reflects the average cost basis of long-term holders over the past two years. Falling below it indicates excessive fear and presents an excellent long-term entry point. The red line, representing five times that average, signals extreme FOMO when breached—often a sign of overheating, making it ideal for taking profits.
Historically, Bitcoin’s price movements have largely aligned with this indicator. As of November 6, Bitcoin traded around $75,000, while the red line stood at $207,977. With Bitcoin continuing to make new highs, the red line will keep rising. According to this model, the cycle top should reach at least $200,000.

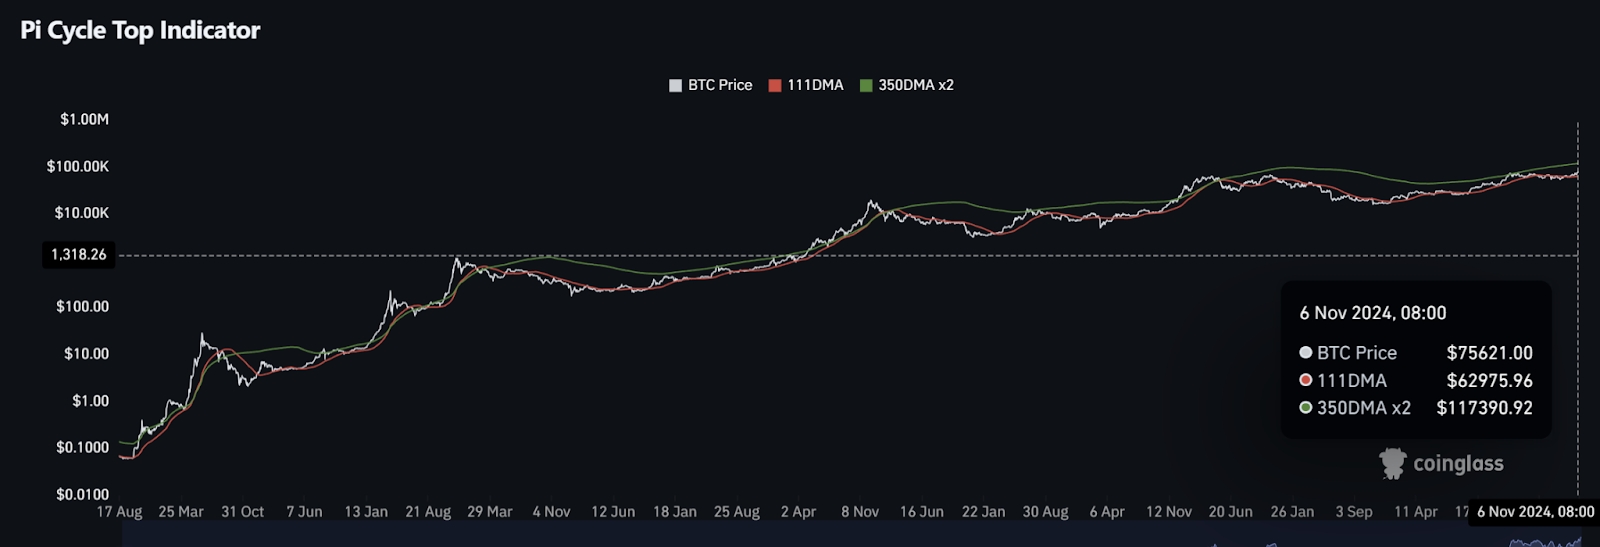
Pi Cycle Top Indicator: Peak Above $110K
This indicator uses two metrics to assess whether Bitcoin is overheating:
-
111-Day Moving Average (111DMA, red line)
-
Double the 350-Day Moving Average (350DMA x 2, green line)
Usage:
When the 111DMA crosses above 350DMA x 2, it typically signals a market top and a sell signal.
Interpretation:
The Pi Cycle Top Indicator evaluates whether short-term prices have broken above the long-term holders’ average cost, helping gauge market overheating. A crossover suggests excessive optimism and FOMO sentiment—often a warning sign of a top.
As of November 6, 2024, Bitcoin was trading at approximately $75,621, while the 350DMA x 2 level stood at around $117,390. This means that when Bitcoin approaches or exceeds this level, it may signal the peak of this cycle.
Join TechFlow official community to stay tuned
Telegram:https://t.me/TechFlowDaily
X (Twitter):https://x.com/TechFlowPost
X (Twitter) EN:https://x.com/BlockFlow_News
 @WOOXResearch