DEX Market Overview by the Numbers: Trading Volume Up 100% Year-on-Year, Weekly Volume Reaches $17 Billion—Is Everything Recovering?
TechFlow Selected TechFlow Selected
DEX Market Overview by the Numbers: Trading Volume Up 100% Year-on-Year, Weekly Volume Reaches $17 Billion—Is Everything Recovering?
Although DEX trading volume has declined from its peak in 2024, it remains steady at approximately $20–25 billion per week, representing a 100% increase compared to last year.
Author: OurNetwork
Translation: TechFlow
DEXs
Uniswap | PancakeSwap | Raydium | Let's F***ing Joe (Trader Joe)
DEX Trading Volume Up 100% Year-on-Year; Weekly Volume Reaches $17 Billion
-
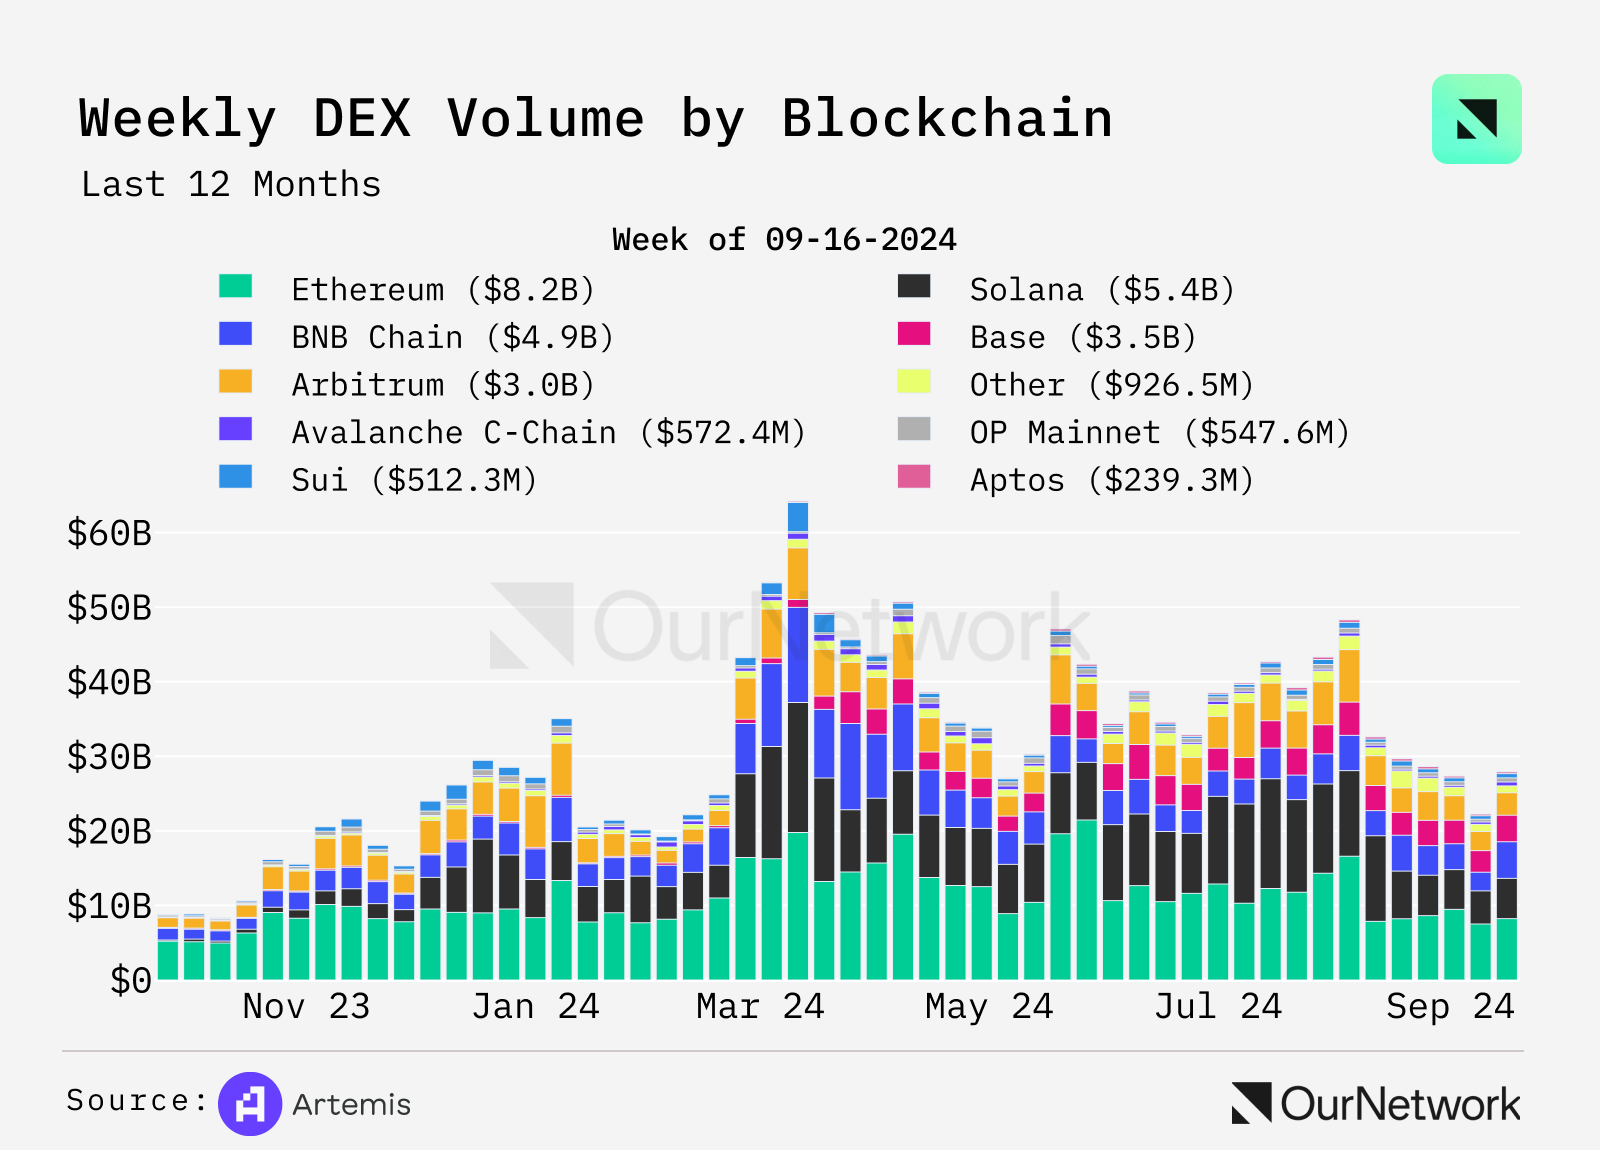
Although DEX trading volume has declined from its 2024 peak, it remains steady at approximately $20–25 billion per week—up 100% compared to last year. Solana and Base have significantly contributed to this growth, with Solana’s volume increasing over 20-fold from $170 million to $4 billion. Ethereum is the only blockchain showing a decline, with weekly trading volume down about 20%.
-
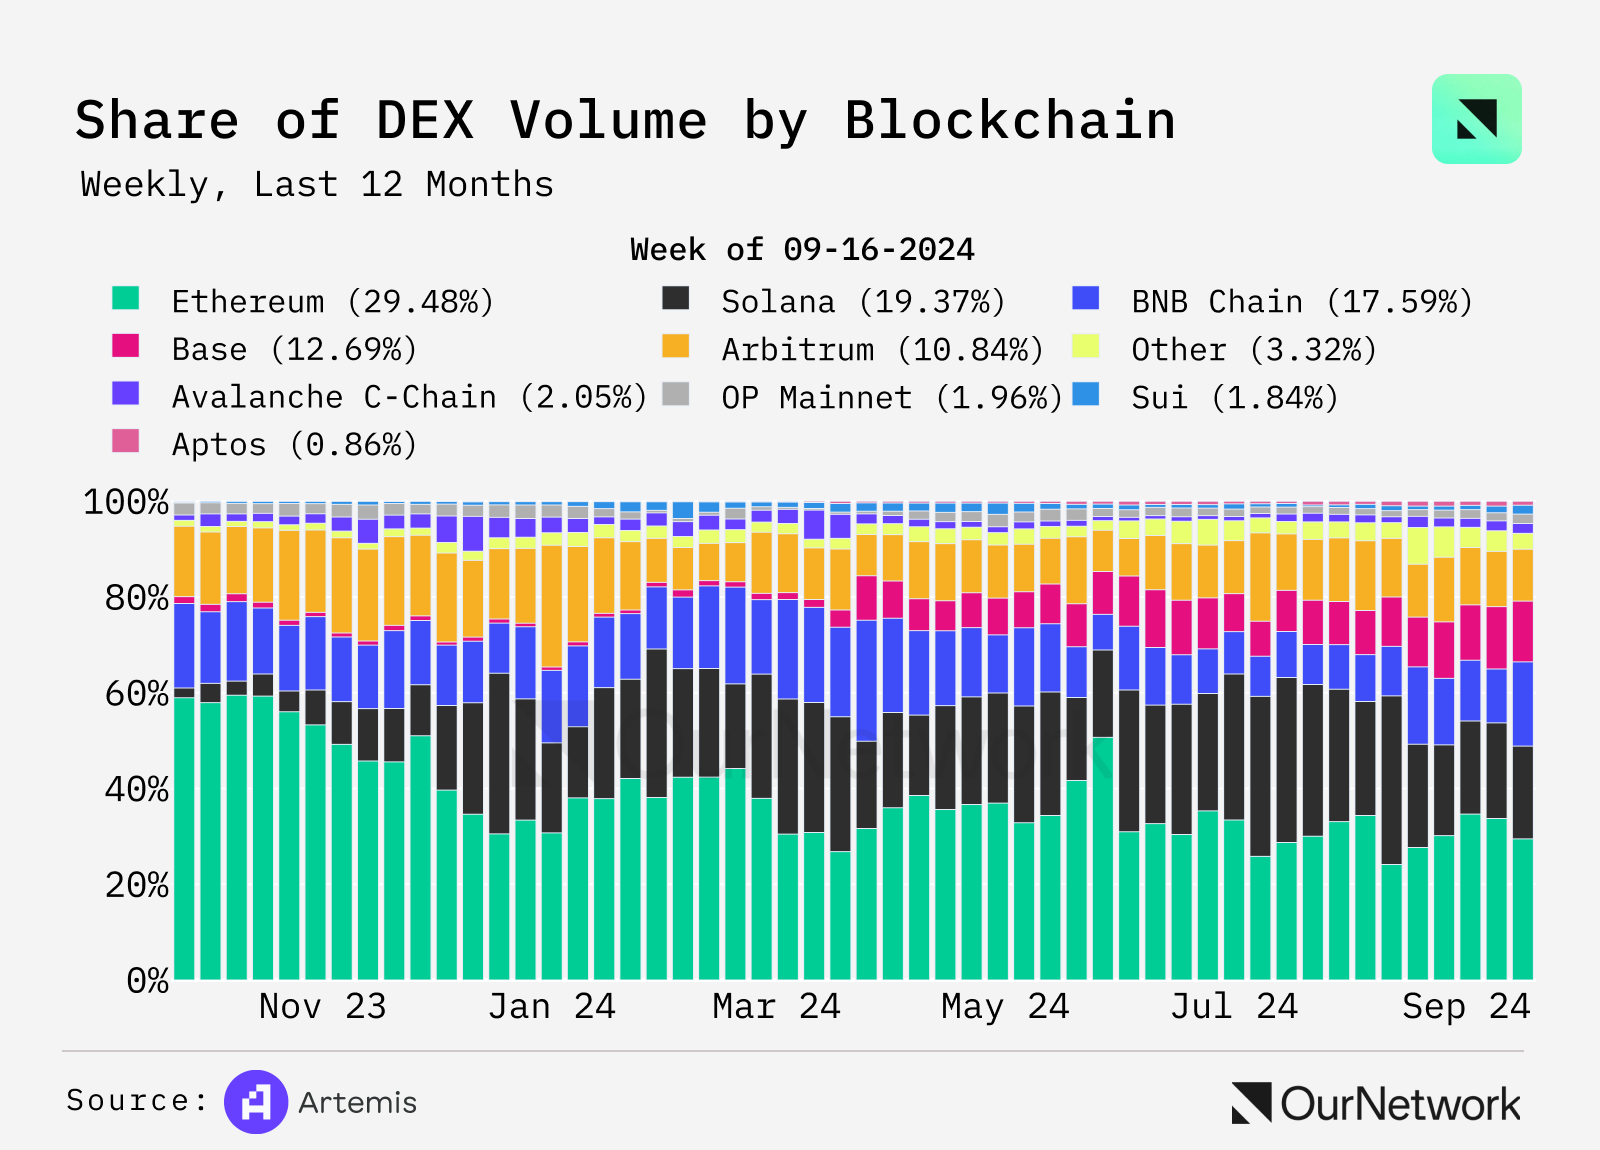
DEX trading activity is far more distributed than a year ago, when Ethereum alone accounted for nearly 60% of market volume. Today, five blockchains each hold over 10% market share. Ethereum remains the largest, representing 29%. Base has gained significant traction in 2024, now accounting for over 12% of DEX trading volume across all chains.
-
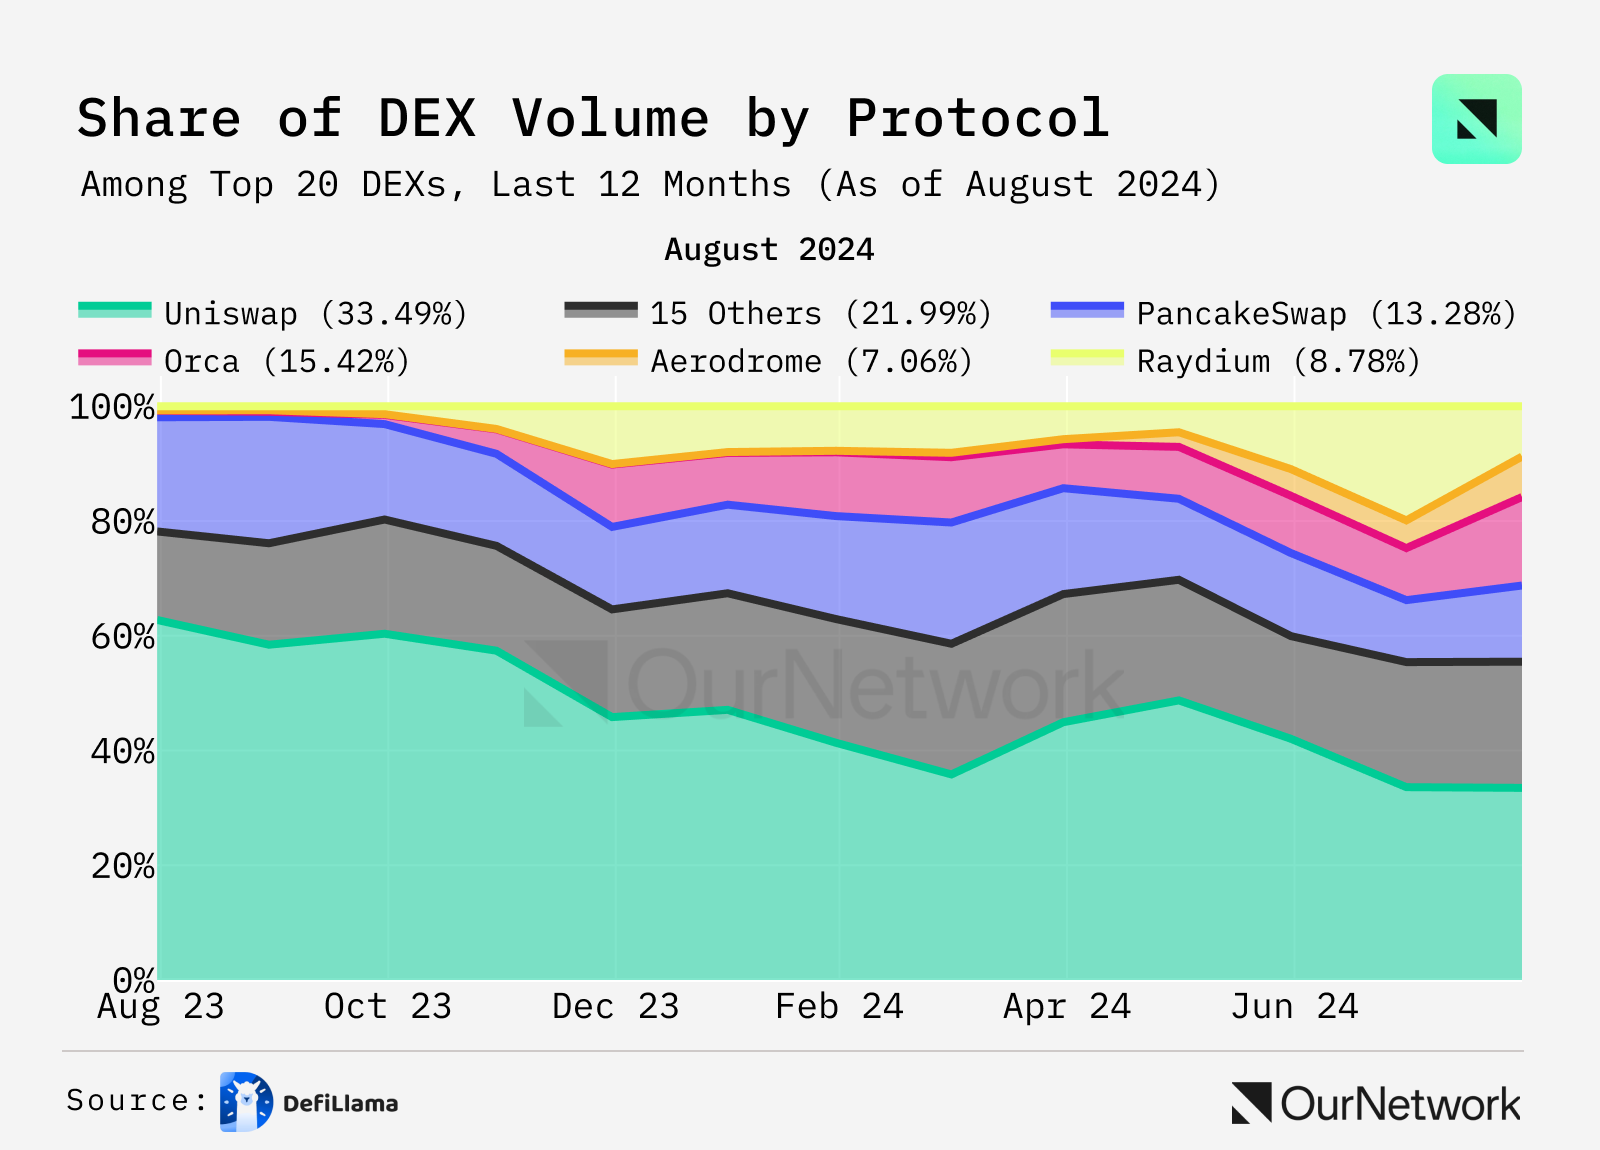
Trading venues have also shifted notably. Uniswap’s market share has dropped to 33%, down from 53%. Meanwhile, established DEXs like Orca on Solana have increased their share, and newer exchanges such as Aerodrome are gaining popularity.
Uniswap
Matías Andrade Cabieses | Website | Dashboard
Uniswap Generated $26.4 Billion in Fees Over the Past Year
-
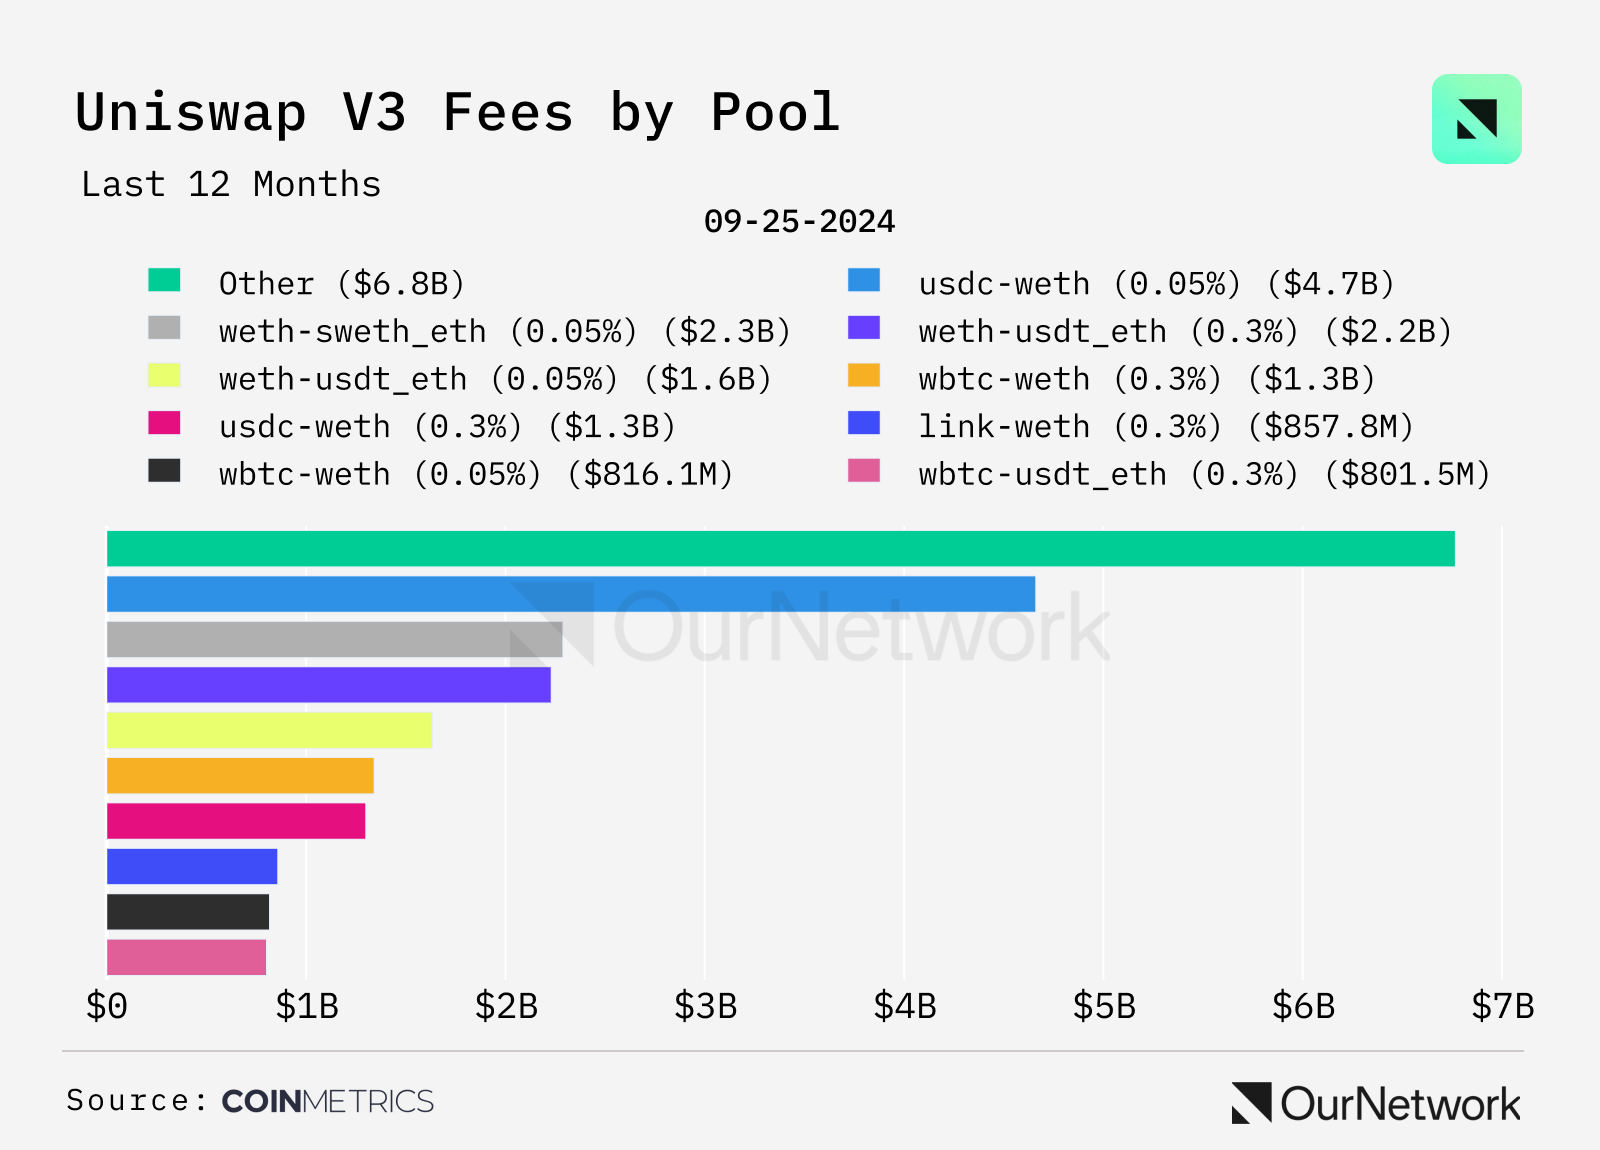
One of Uniswap’s most attractive features is enabling liquidity providers (LPs)—users who supply assets for traders—to earn revenue. The chart below shows fees generated by V3 pools over the past 12 months. USDC-WETH performed best, generating over $4 billion in income for LPs. Uniswap V3 offers multiple fee tiers—0.01%, 0.05%, 0.3%, and 1%—providing flexibility for both LPs and traders. Similar assets, such as stablecoins, typically incur lower fees. These tiered fees allow LPs to optimize returns based on asset volatility and trading activity.
-
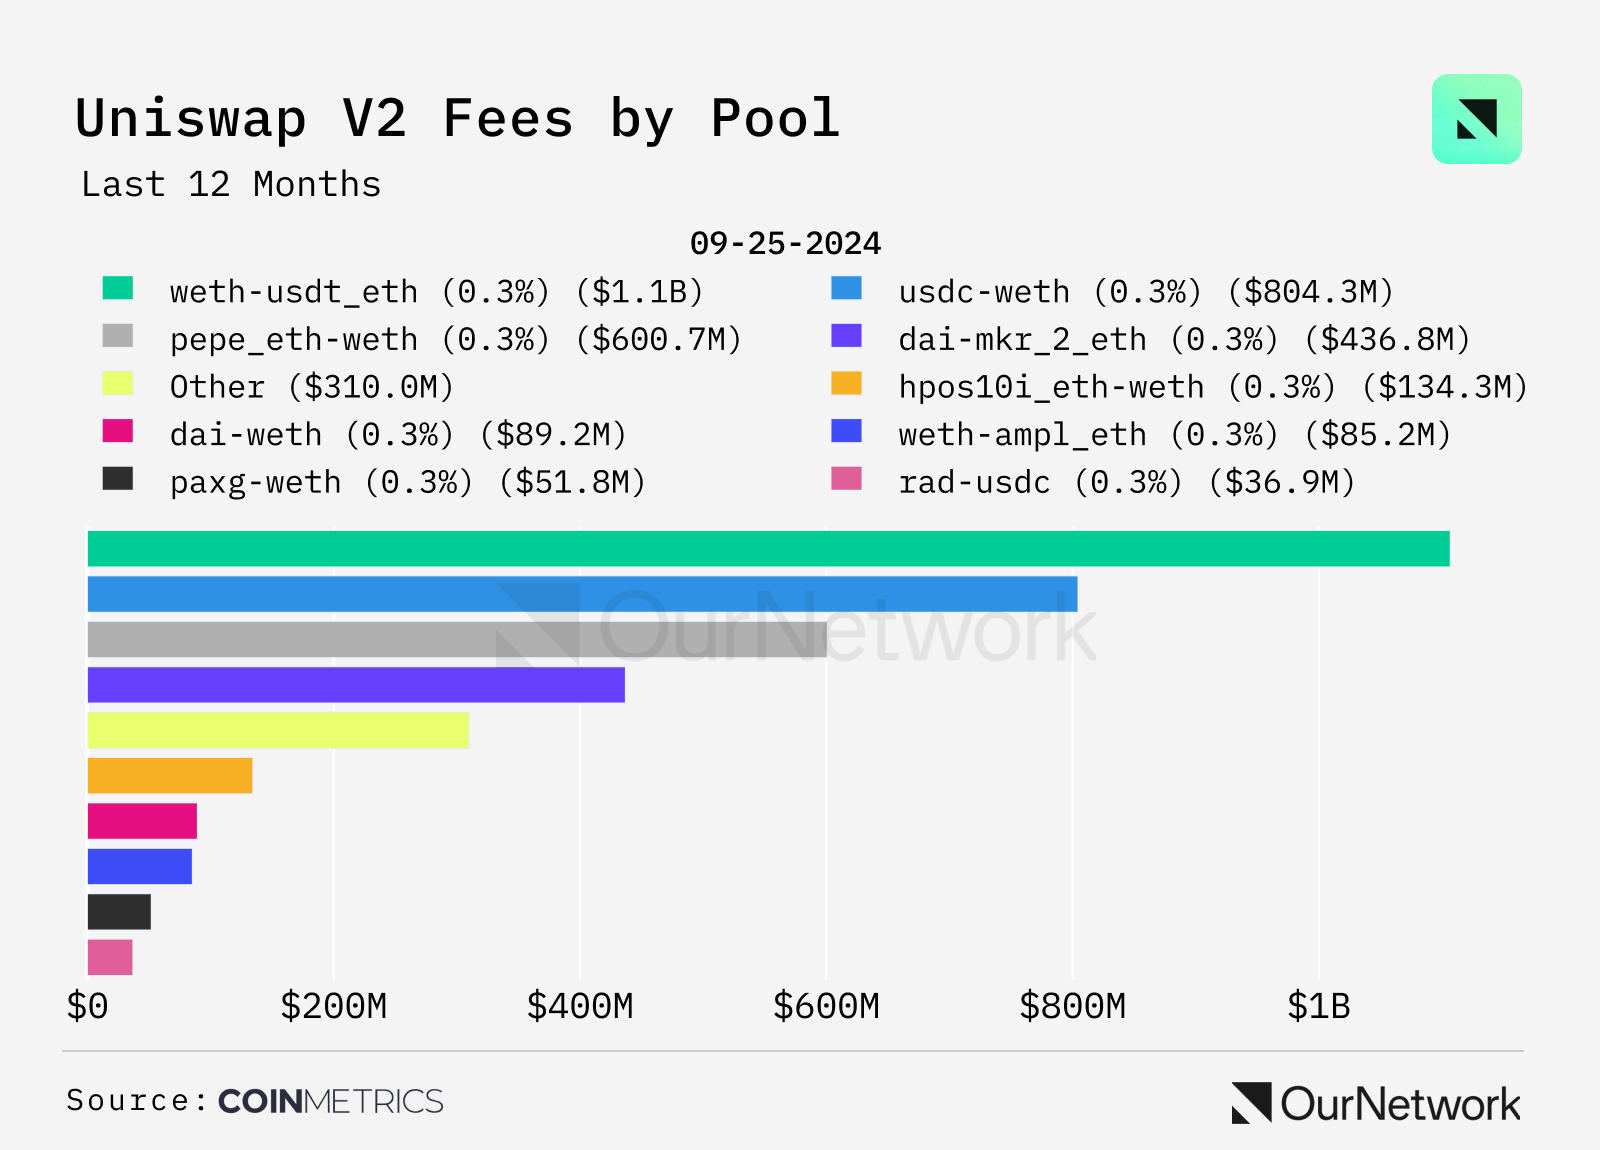
In Uniswap V2 liquidity pools, the WETH-USDT pool led in fee collection, surpassing $1 billion, followed by USDC-WETH and PEPE-WETH pairs. Despite V2’s simplicity, V3’s concentrated liquidity feature has attracted higher trading volumes due to greater capital efficiency and lower fees.
-
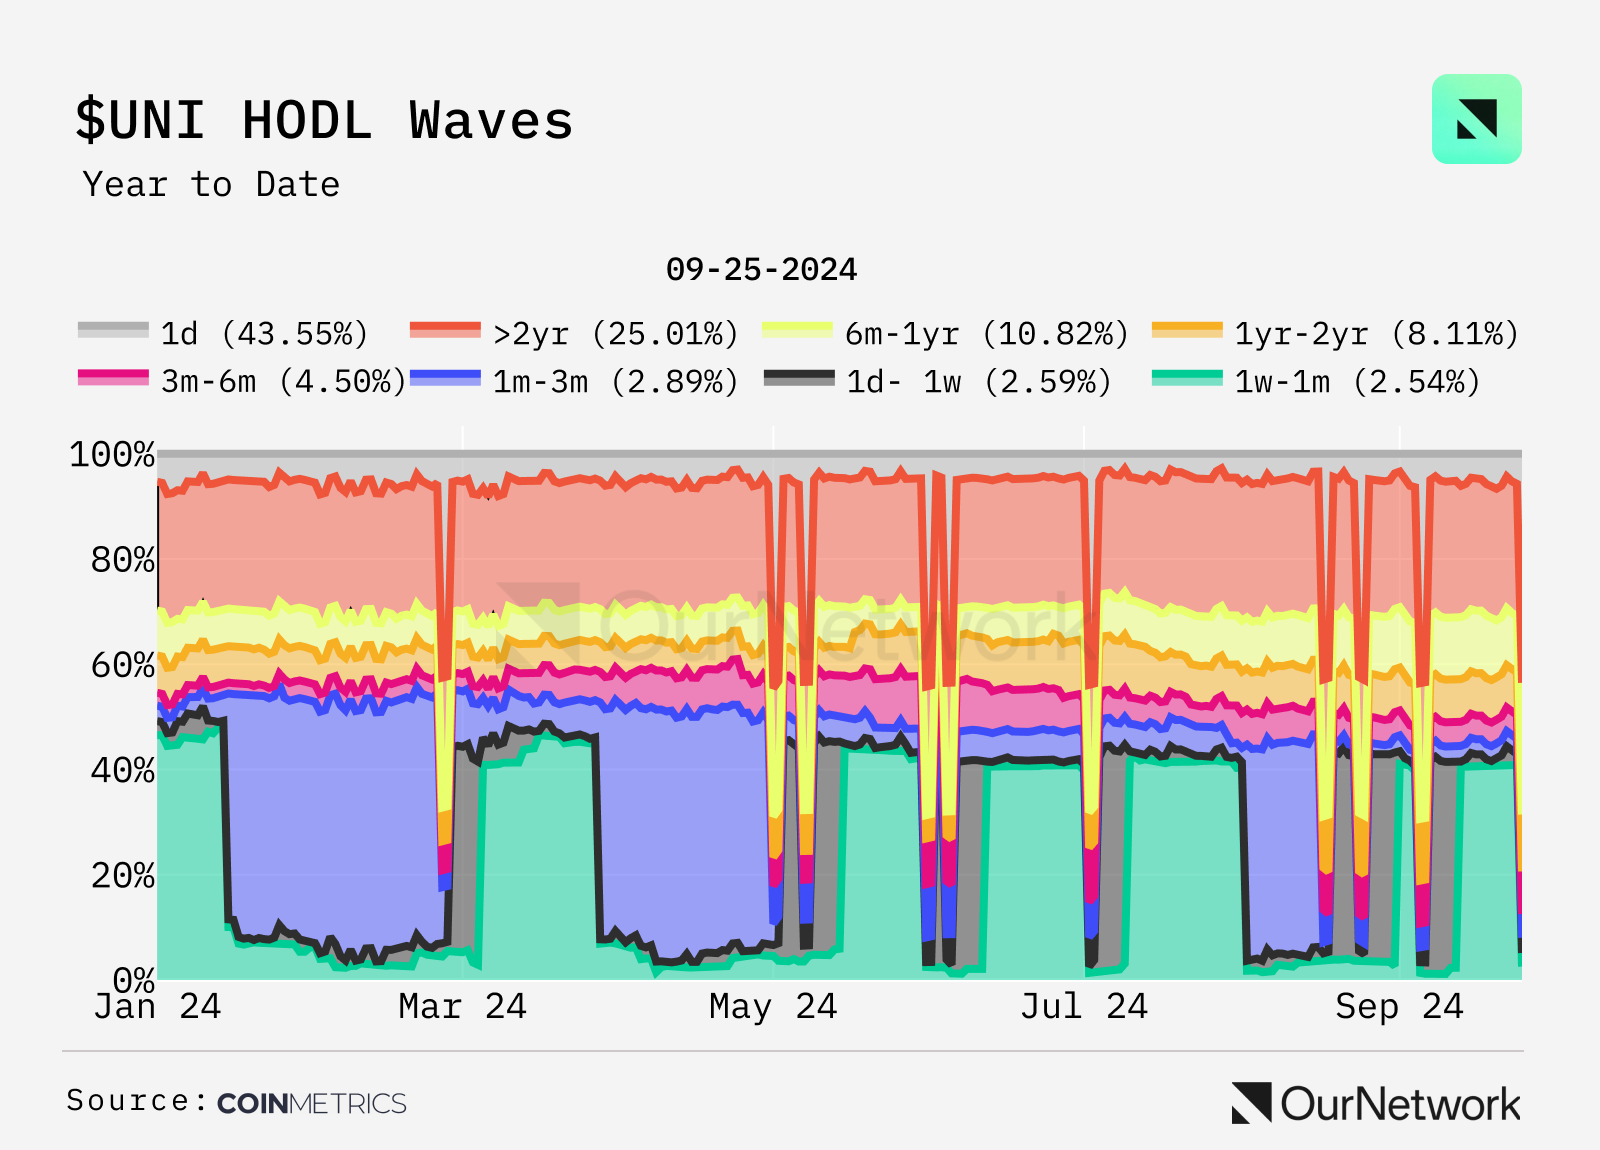
While Uniswap generates substantial revenue for liquidity providers (LPs), $UNI is solely a governance token without mechanisms like token burns that could enhance its value. 60% of UNI was allocated to the community back in 2021. The $UNI HOLD Wave chart below reveals some interesting trends.
-
Transaction Highlight: This transaction shows the transfer of 500,000 $UNI (worth ~$3.5 million) from Uniswap’s timelock contract, part of its distribution mechanism. This system ensures gradual token release, aligning incentives with long-term stakeholders and providing transparency. Analyzing these transfers can offer insights into distribution progress, potential market impact, insider behavior, possible shifts in governance power, and protocol health.
Pancakeswap
PancakeSwap’s $CAKE Supply Decreased by 7.8 Million Over One Year
-
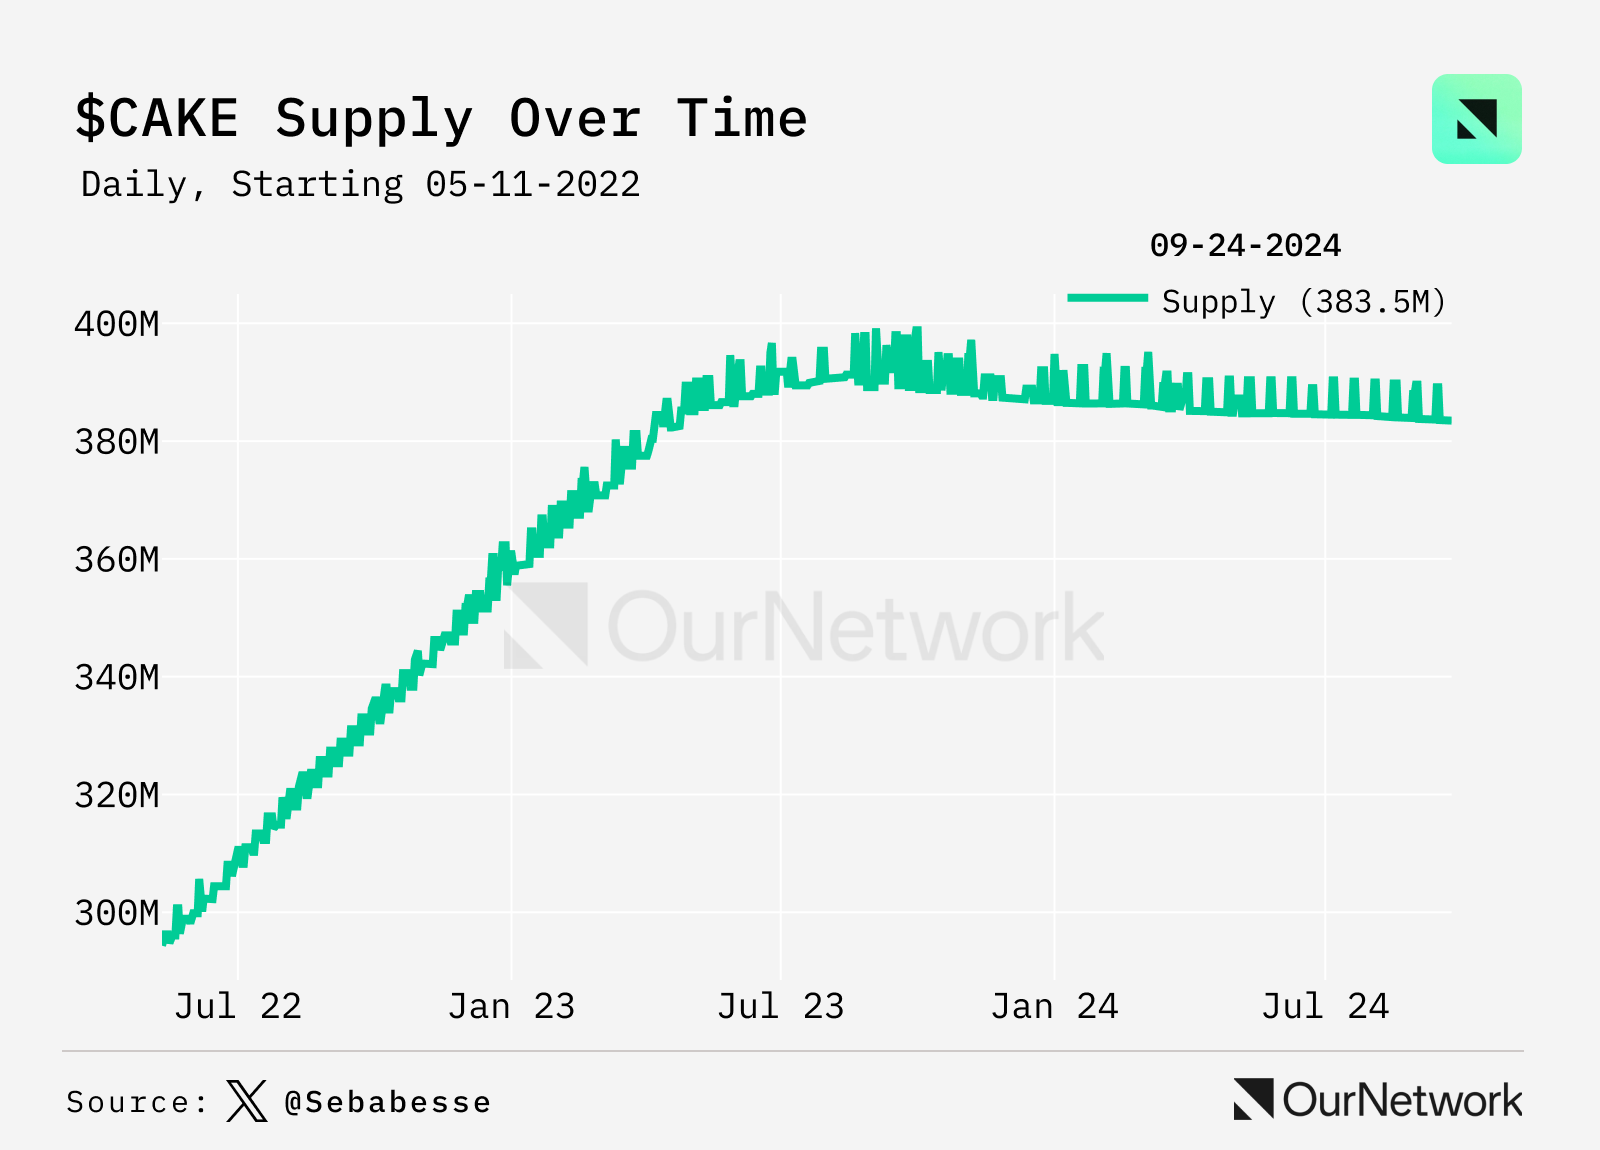
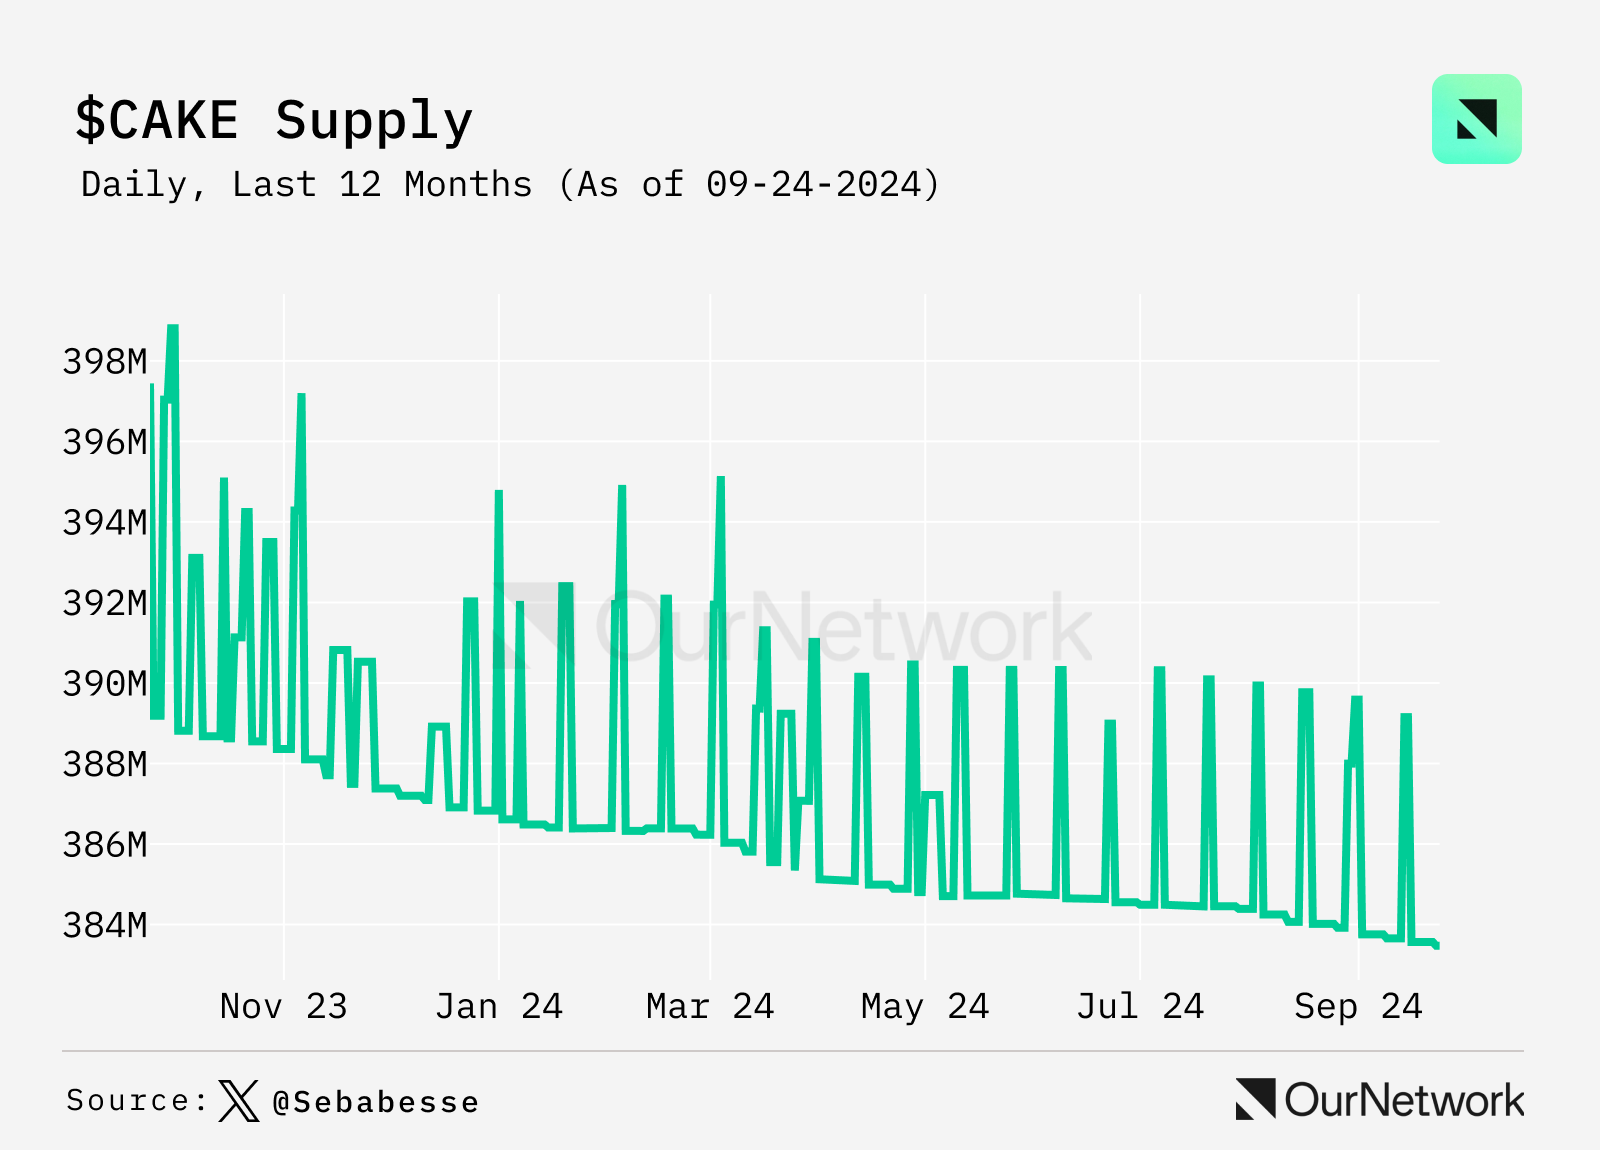
PancakeSwap, a decentralized exchange originating on BSC and now operating across multiple blockchains, issues the $CAKE token as rewards for liquidity providers (LPs). In 2023, PancakeSwap adopted a deflationary model to improve its tokenomics, achieved through reduced emissions and market-driven $CAKE buybacks. Their efforts quickly paid off, with CAKE supply peaking at 391.3 million in August 2023. Since then, supply has steadily declined, decreasing by 7.8 million tokens over the past year.
-
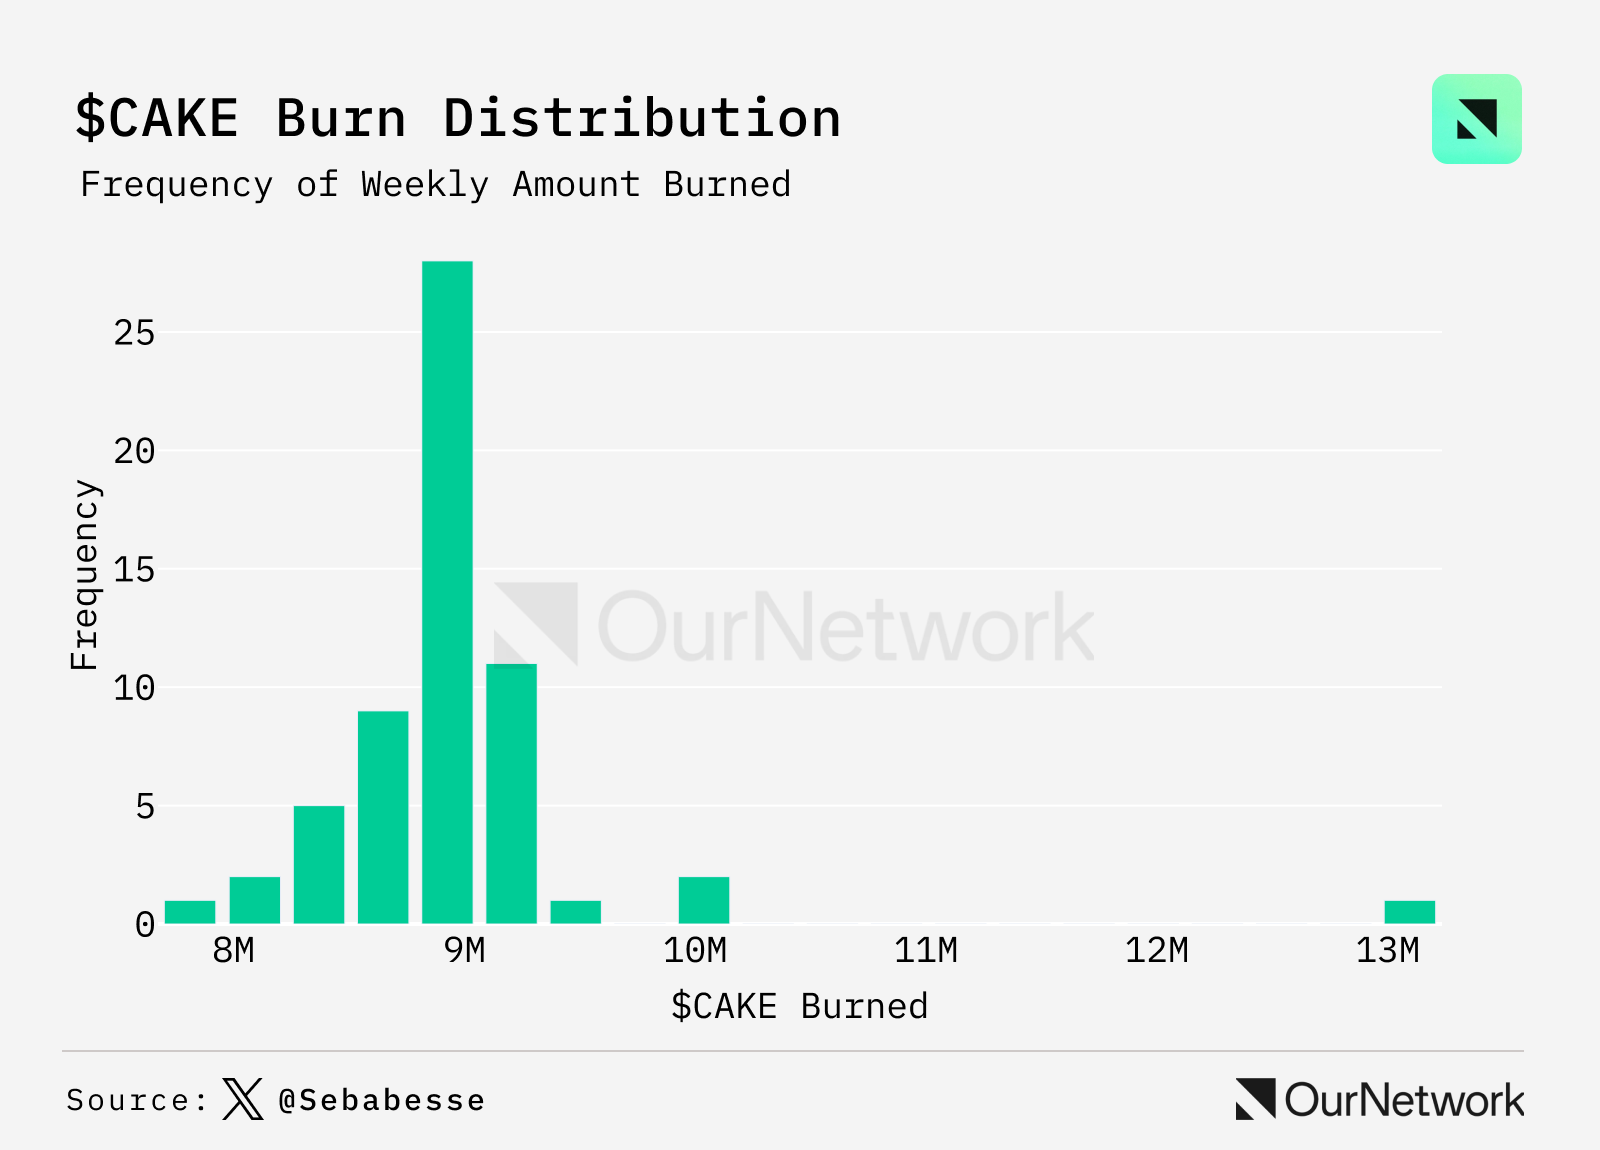
To achieve this deflation, PancakeSwap burns CAKE weekly by sending tokens to a burn wallet on the BNB chain. According to their tokenomic model, an average of 9 million CAKE is burned weekly. Reduced emissions and buybacks offset new minting.
-
Deflation is influenced by market factors such as trading volume and CAKE price. Over time, the deflation rate has fluctuated between 1.4 CAKE and 0.2 CAKE per block. Under current tokenomics, a weekly supply reduction requires buying back 275K CAKE from the market—a target consistently met almost every week.
-
Transaction Highlight: The team conducts weekly token burns every Monday. Monitoring these transactions provides all necessary information on CAKE supply changes.
Raydium
Raydium Buyback Exceeds $35 Million Since January 1
-
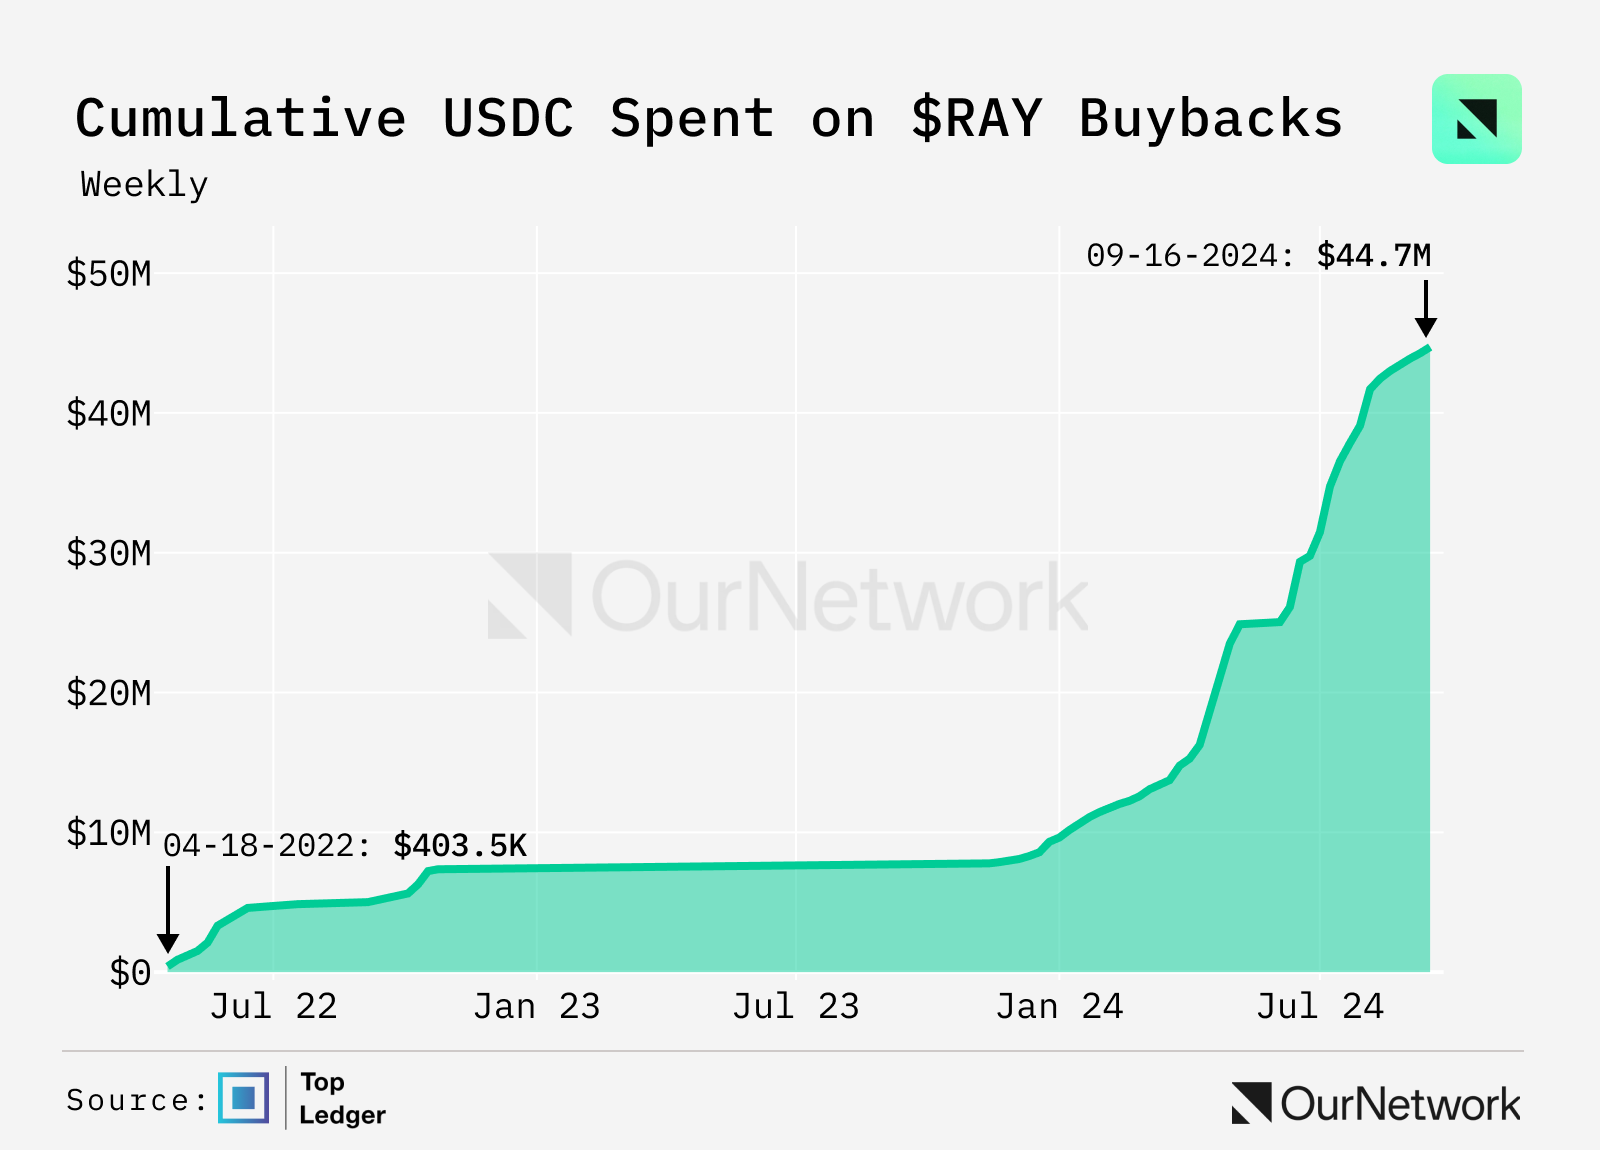
Raydium is the leading decentralized exchange (DEX) on Solana by market share and number of liquidity pools created. Since January 1, 2024, over $35 million in protocol fees have been allocated toward automated buybacks of the $RAY token. Throughout the year, Raydium has consistently captured 30% to 50% of Solana’s cumulative spot market trading volume. Since launch, Raydium has facilitated nearly $270 billion in trading volume, with liquidity providers (LPs) earning over $630 million in trading fees.
-
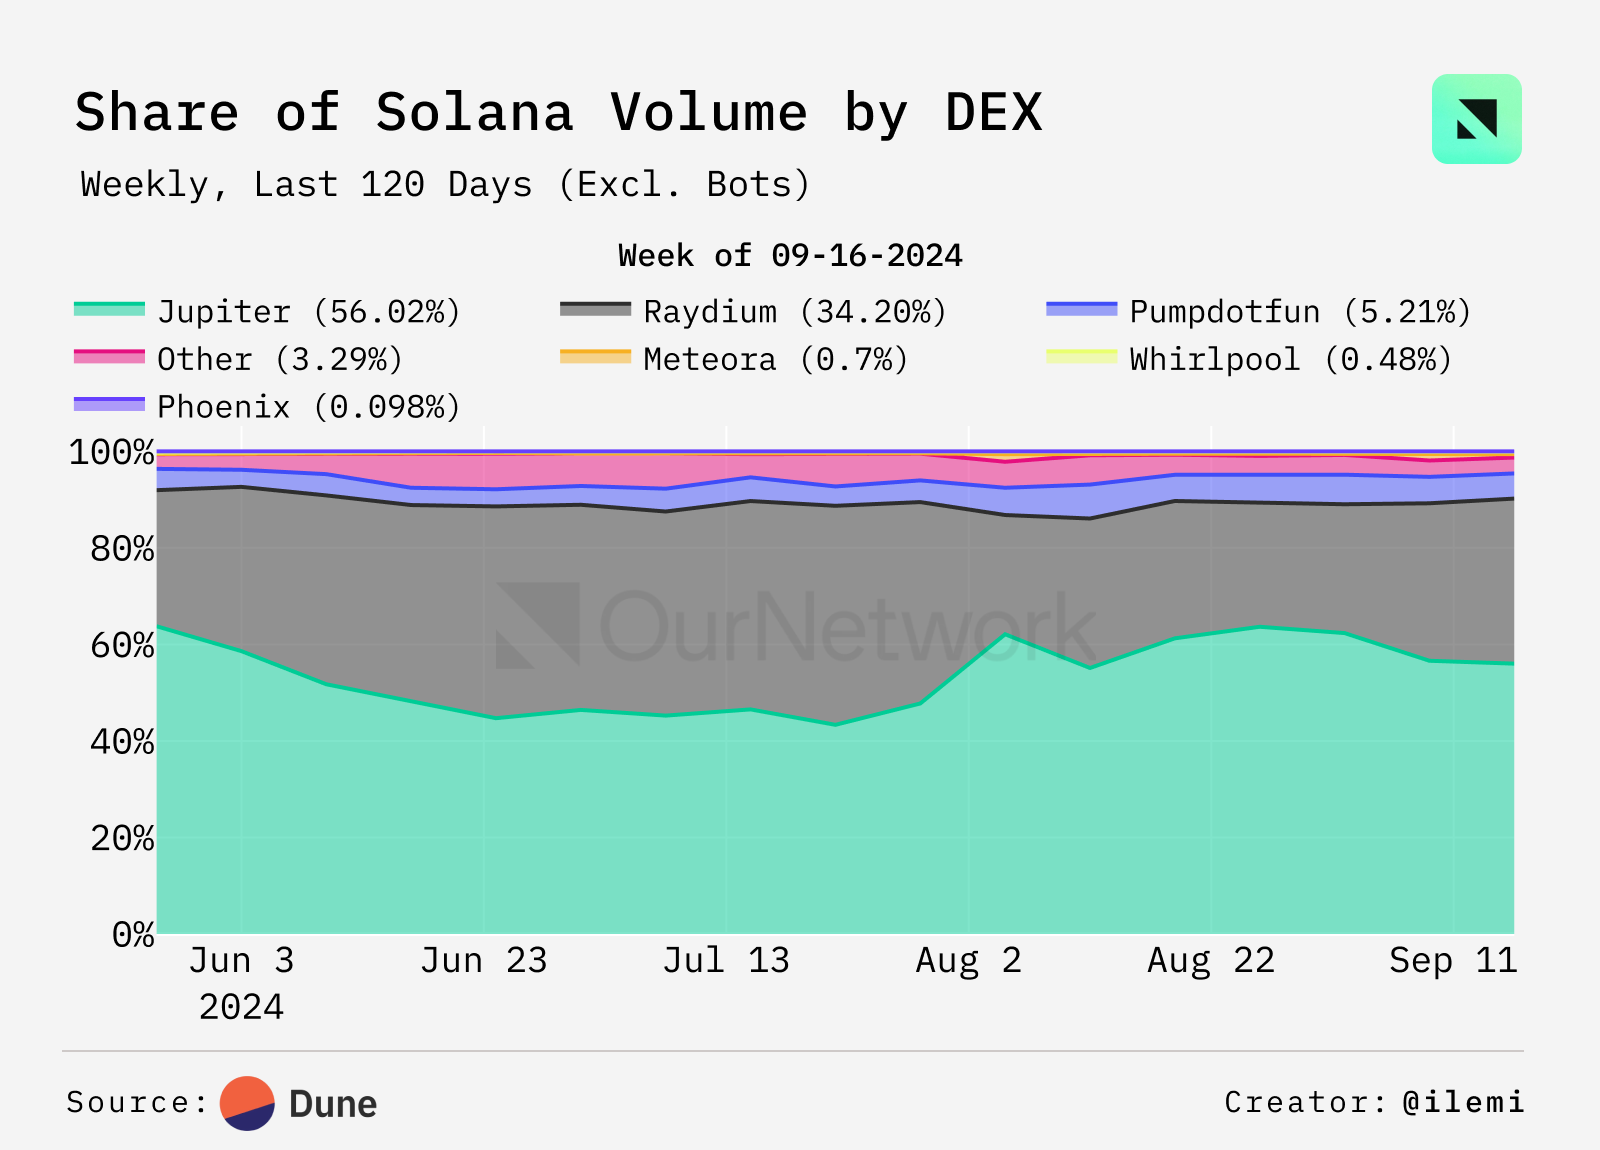
After filtering out bot traffic and considering real trading volume, Raydium’s routing program performs strongly, currently capturing over 30% of all genuine trading flows—second only to Jupiter.
-
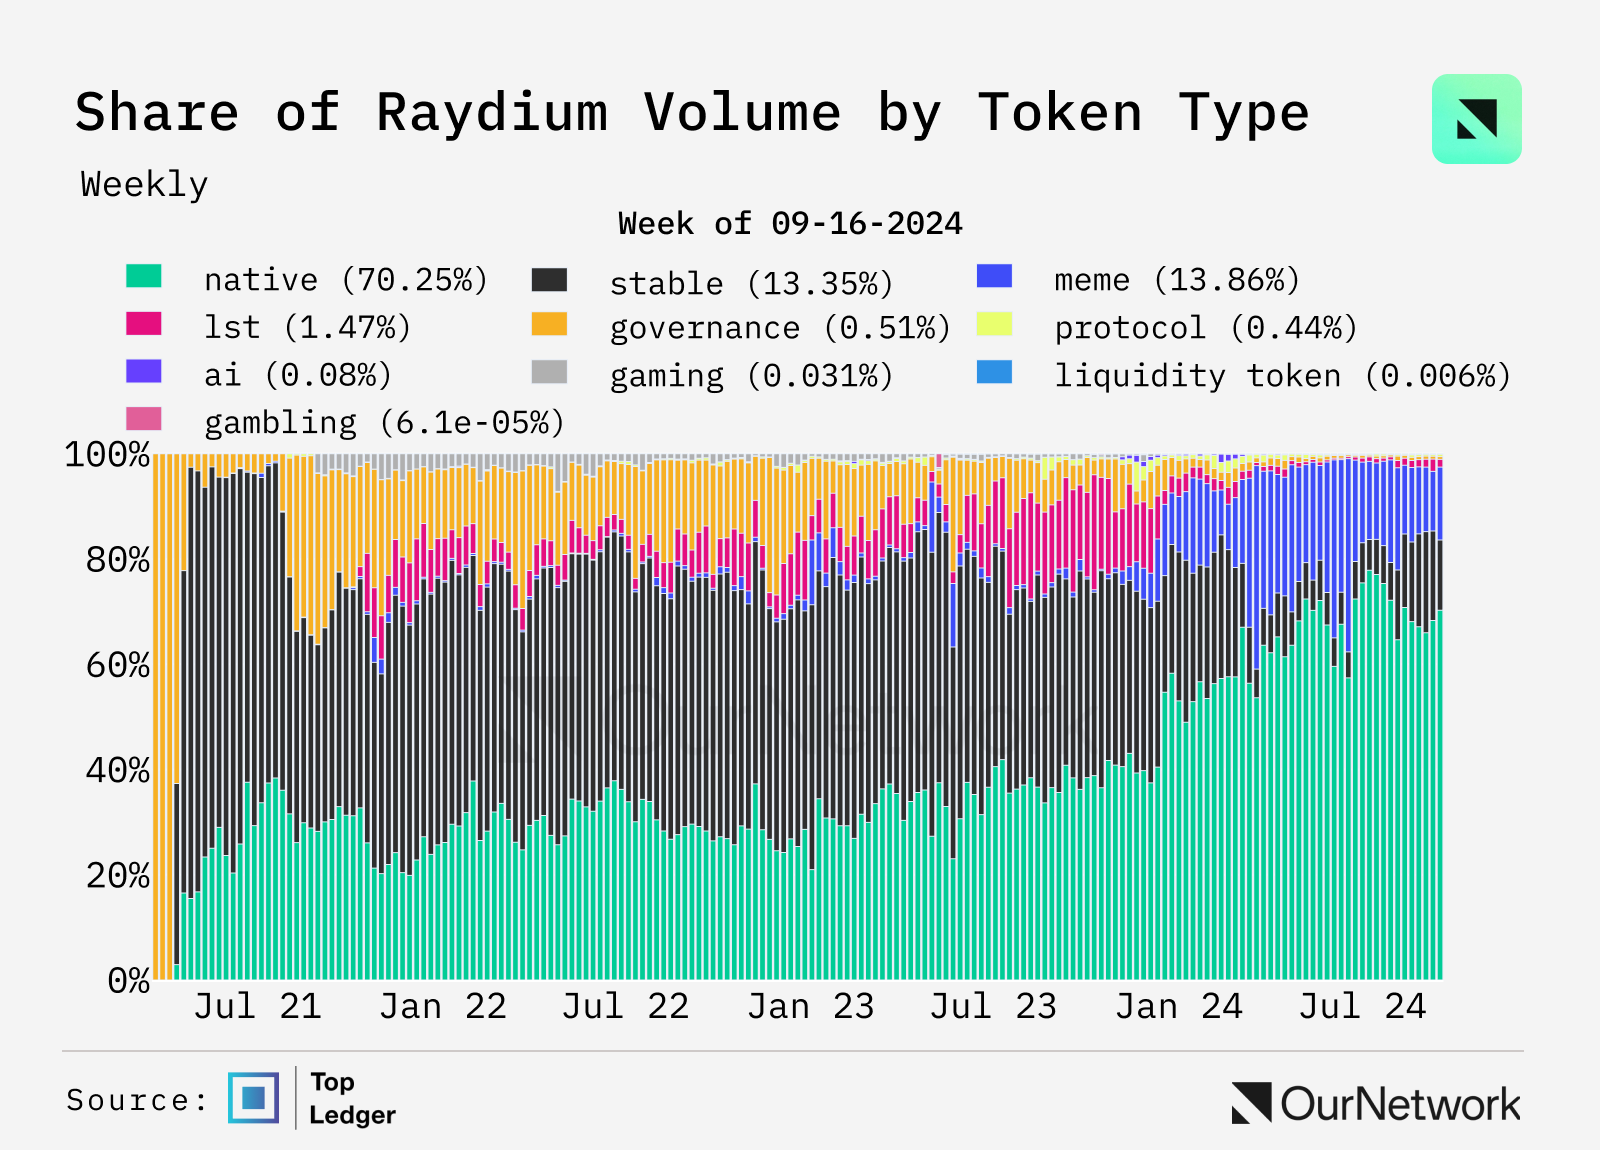
Despite being one of the main platforms benefiting from surging meme coin trading volume on Solana, meme coins currently account for only 11.4% of Raydium’s total trading volume.
-
Transaction Highlight: Raydium benefits from a rich ecosystem of third-party applications and protocols leveraging its core liquidity pools and trading infrastructure. Among the most beneficial is Pump.Fun, which migrates its liquidity pool to Raydium after completing its initial bonding curve. Other teams utilizing Raydium’s infrastructure include, but are not limited to: MoonShot by Dexscreen, Trojan, BananaGun, FluxBot, BonkBot, Photon, and BullX.
LFJ
LFJ Hits $130 Billion Cumulative Volume and Breaks $5 Million in 2024 Revenue
-
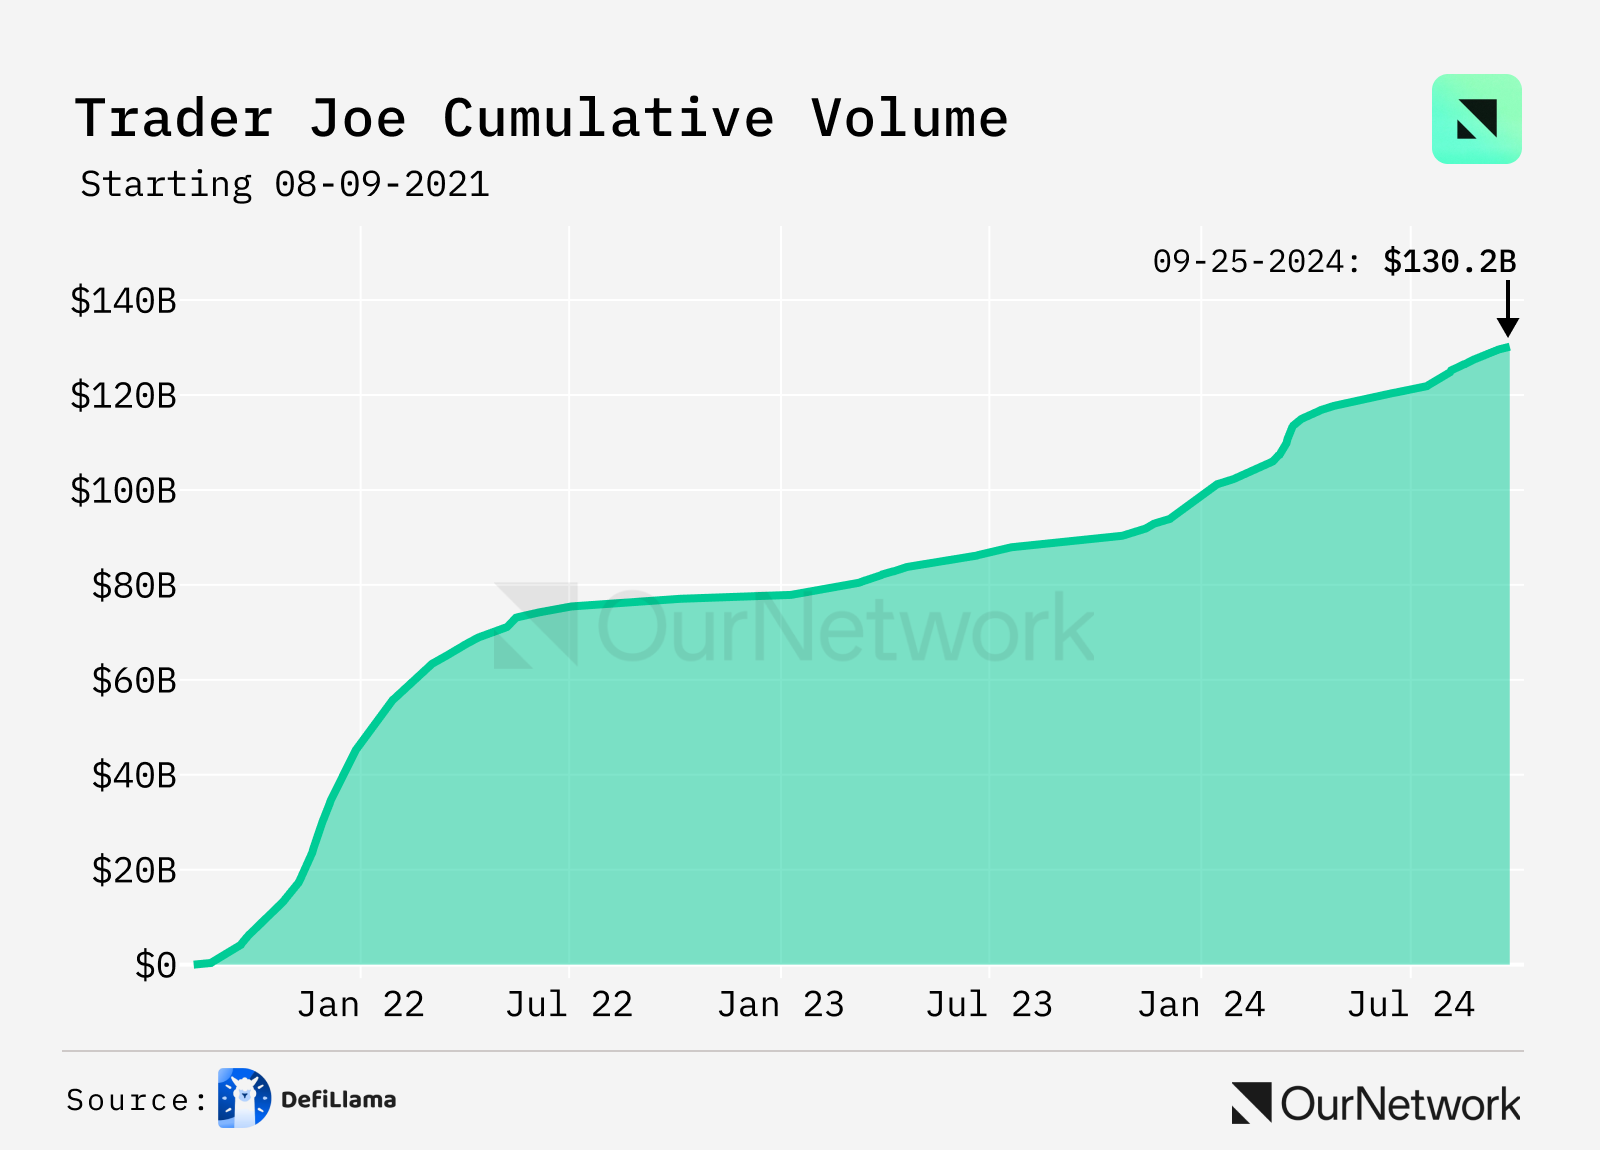
LFJ (formerly Trader Joe) is a blockchain token trading platform launched in July 2021. Since inception, it has facilitated over $130 billion in cumulative trading volume. In 2024 alone, LFJ added over $30 billion in trading volume—double that of the previous year. This growth is primarily driven by increased trading activity on the Avalanche network, where LFJ holds a dominant position.
-
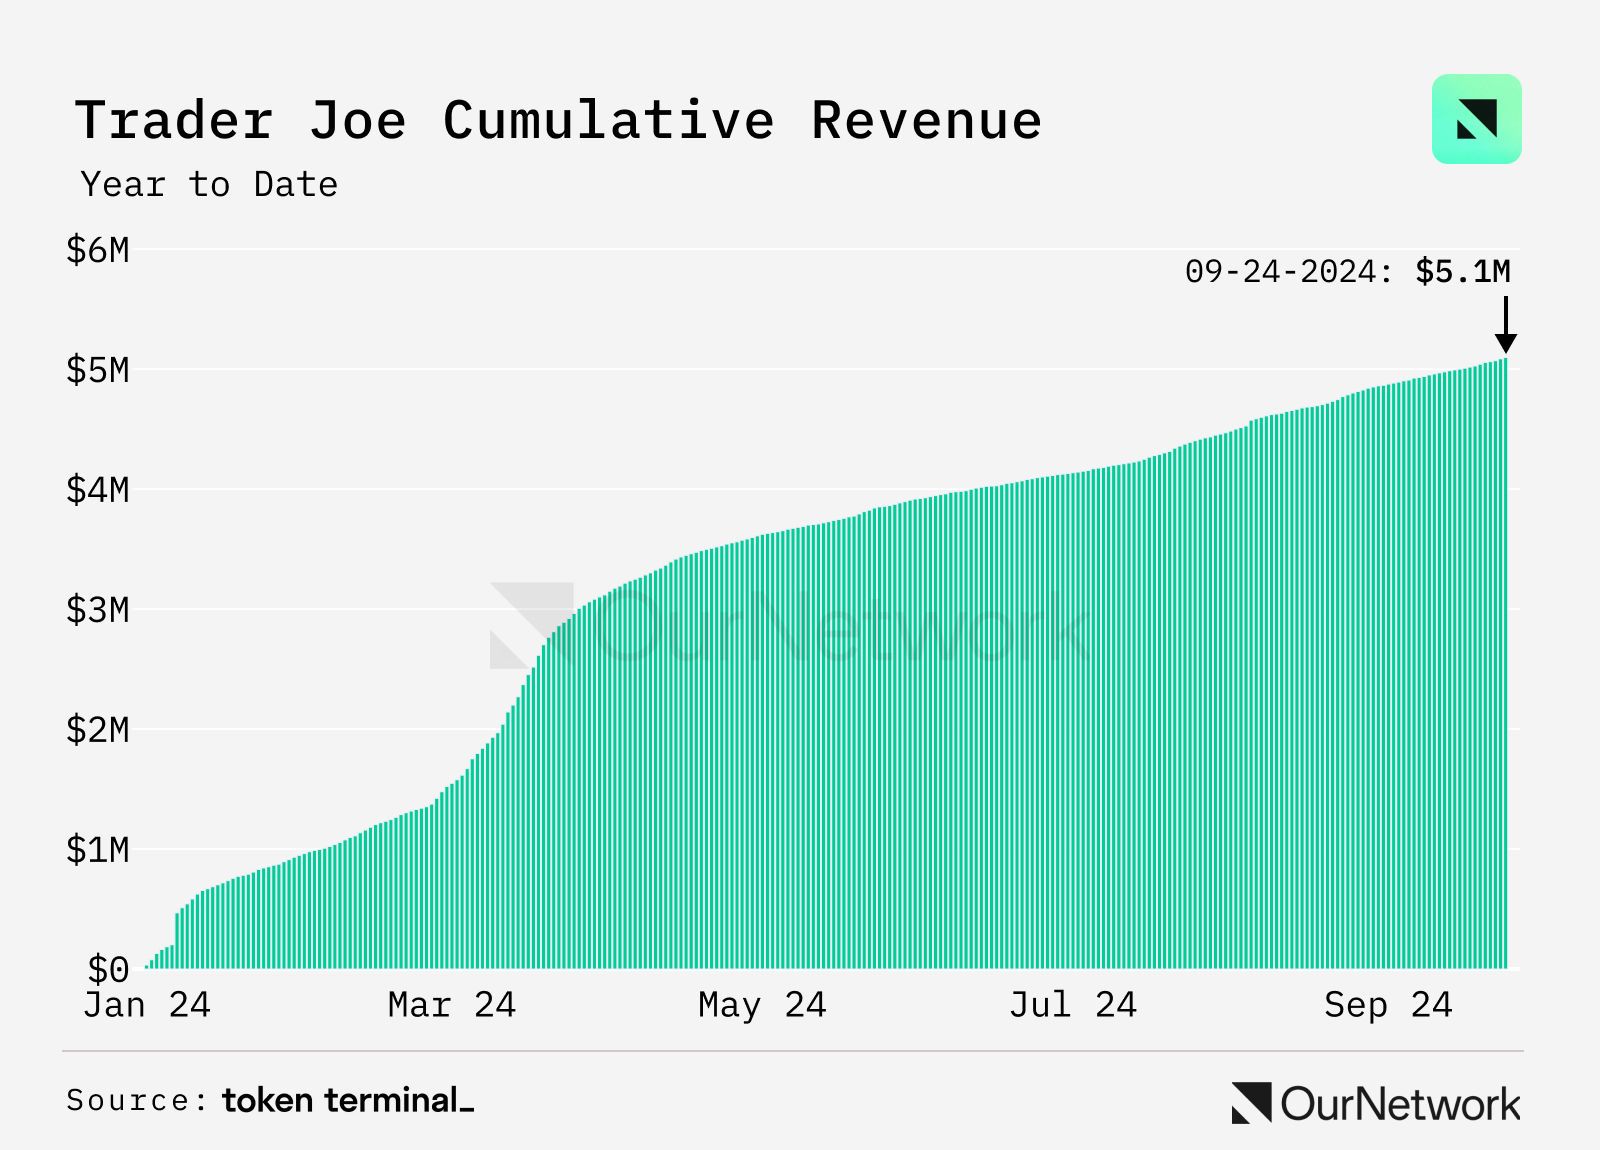
LFJ allocates 5%–25% of trading fees to $JOE stakers, averaging $550,000 in stablecoin distributions monthly in 2024—an increase of 109% compared to last year. With 80% of revenue coming from Avalanche, rising on-chain activity delivers significant value to JOE stakers.
-
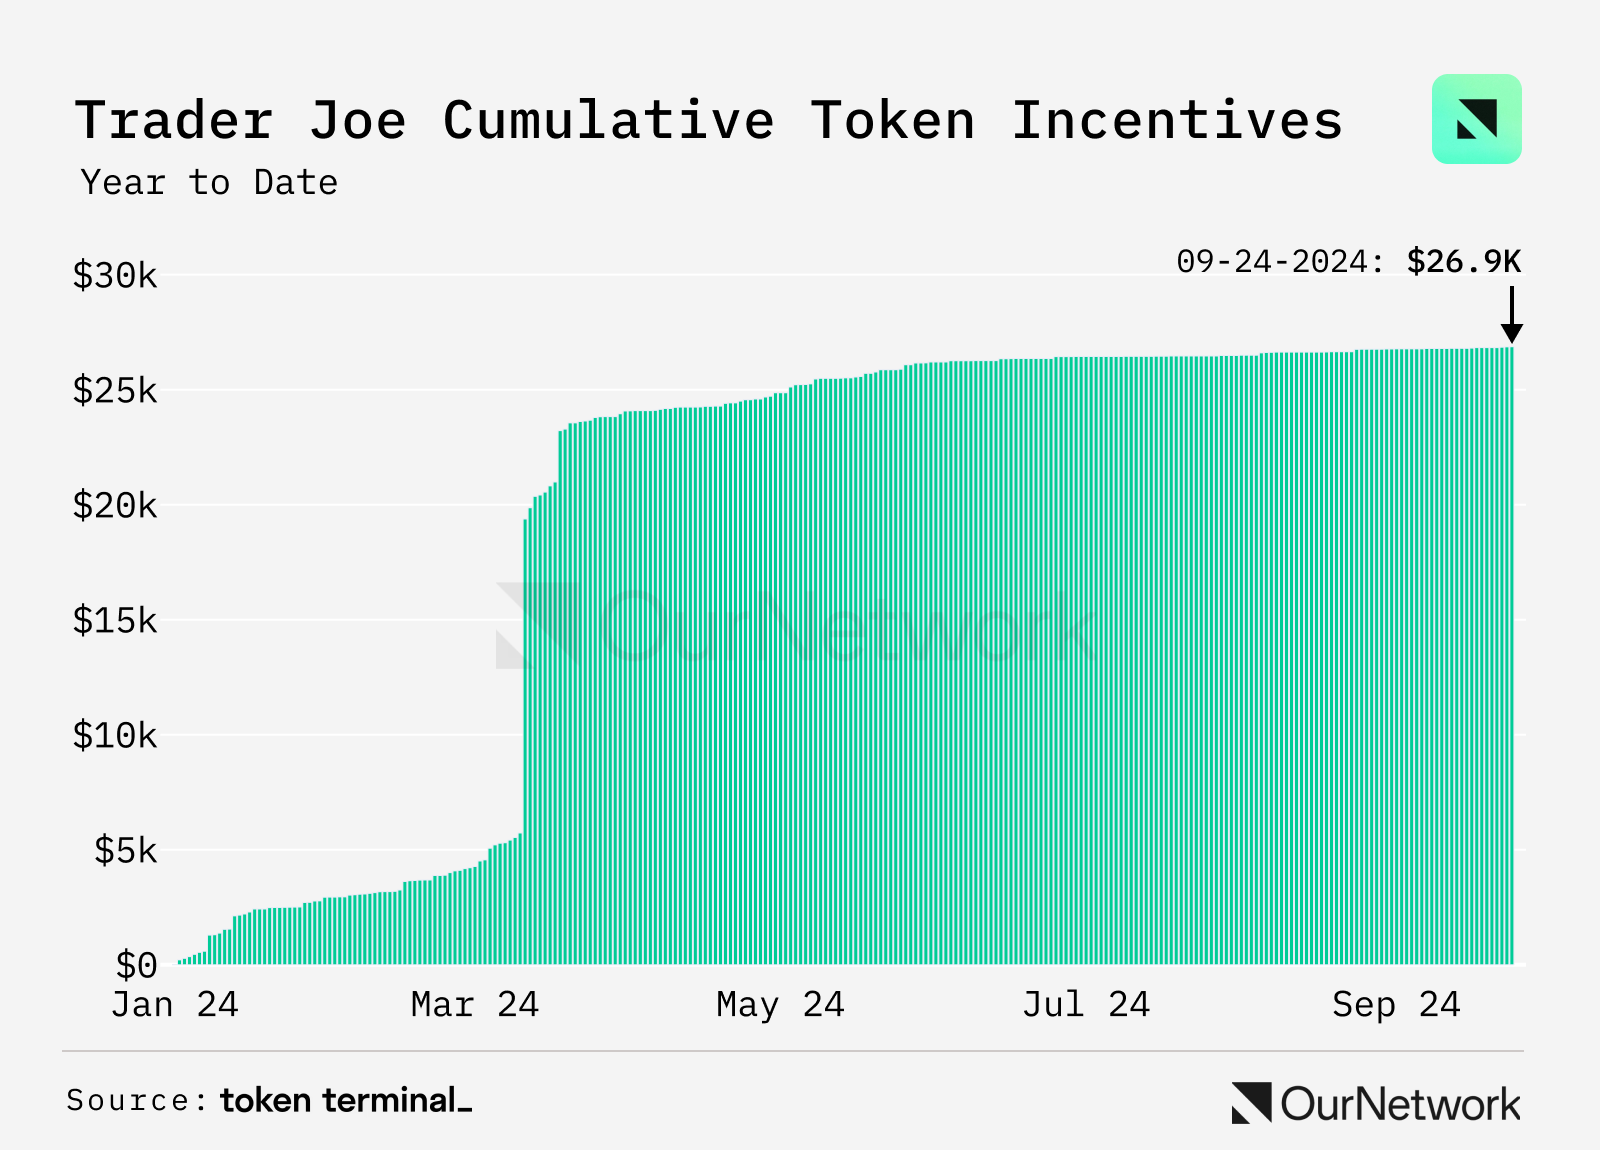
The $JOE token has reached its issuance cap of 500 million, with approximately 380 million currently in circulation. Without a fixed rewards program, JOE is rarely used as a liquidity mining incentive. To date, less than $100,000 has been distributed to yield farmers, while maintaining positive earnings exceeding $5 million.
Join TechFlow official community to stay tuned
Telegram:https://t.me/TechFlowDaily
X (Twitter):https://x.com/TechFlowPost
X (Twitter) EN:https://x.com/BlockFlow_News