Reviewing ETH Beta Returns Under the ETF Narrative: MEME Performed Best, But Collectively Lagged Behind Bitcoin
TechFlow Selected TechFlow Selected
Reviewing ETH Beta Returns Under the ETF Narrative: MEME Performed Best, But Collectively Lagged Behind Bitcoin
In this cycle, altcoins have generally performed poorly, making asset selection more important than ever.
Author: Research firm ASXN
Translation: Felix, PANews
There is significant discussion around long ETH beta (referring to altcoins within the Ethereum ecosystem) trades, with many believing that as ETH ETFs gain approval, ETH will rise again, thereby unlocking upside potential for ETH beta. While this seems logical, does the data support this view?
Research from ASXN shows that during the observation period, ETH beta underperformed ETH both in absolute terms and on a risk-adjusted basis. Moreover, apart from SOL and ENS, all observed tokens underperformed BTC on both relative and risk-adjusted measures. Performance across asset cycles varies significantly, and in this cycle, altcoins have generally performed poorly—making asset selection more critical than ever.
Prerequisites:
-
Observation period: May 1, 2024, to July 23, 2024. The probability of ETH ETF approval was revised on May 6, placing "ETH ETF" trades at the center of market discussions thereafter.
-
Past performance is not indicative of future results.
-
Asset selection: Assets have been categorized and price performance equally weighted. A representative set of altcoins has been selected here, but changing this portfolio could significantly impact overall results (e.g., adding PEPE).
YTD (Year-to-Date):
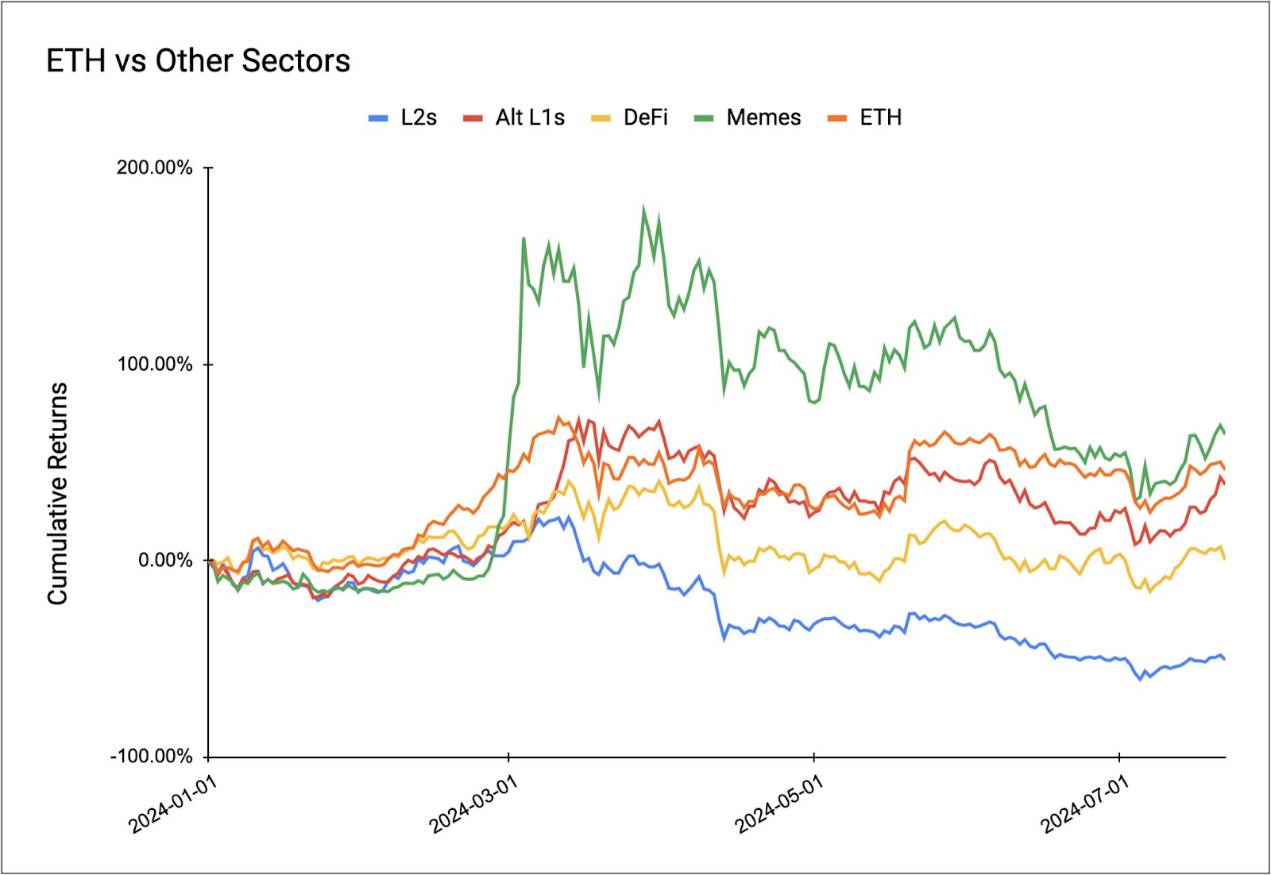
Year-to-date, memecoins are the only sector outperforming ETH, largely due to special liquidity driven by the memecoin craze—even though such liquidity has been relatively short-lived on the Ethereum mainnet. Alt L1, ETH DeFi, and L2s have all underperformed ETH, with L2s showing the weakest performance.
May 1 to July 23:
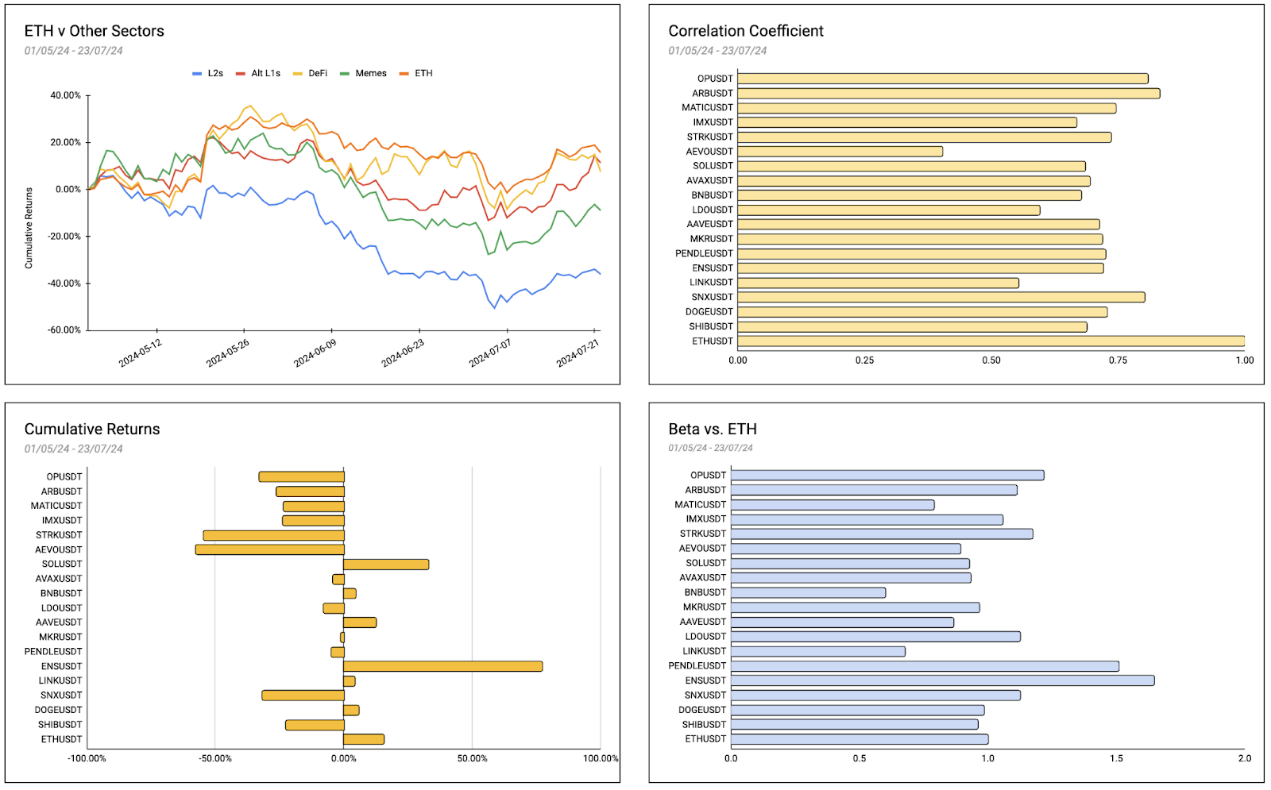
A closer look at sector and asset performance during this period reveals a consistent trend: all sectors underperformed ETH, including memecoins. Similar to the YTD picture, L2s were the worst performers. Interestingly, ENS performed strongly, delivering a 77% return. The top three assets during this period were ENS (+77%), SOL (+32%), and ETH (+15%).
Given their relationship to ETH, L2s and DeFi align more closely with ETH beta than memecoins or Alt L1s. Examining individual assets within these sectors reveals that no L2 outperformed ETH during this period. On average, L2s declined by 36%, with a notable 40% gap between the best-performing L2 (Matic) and ETH.
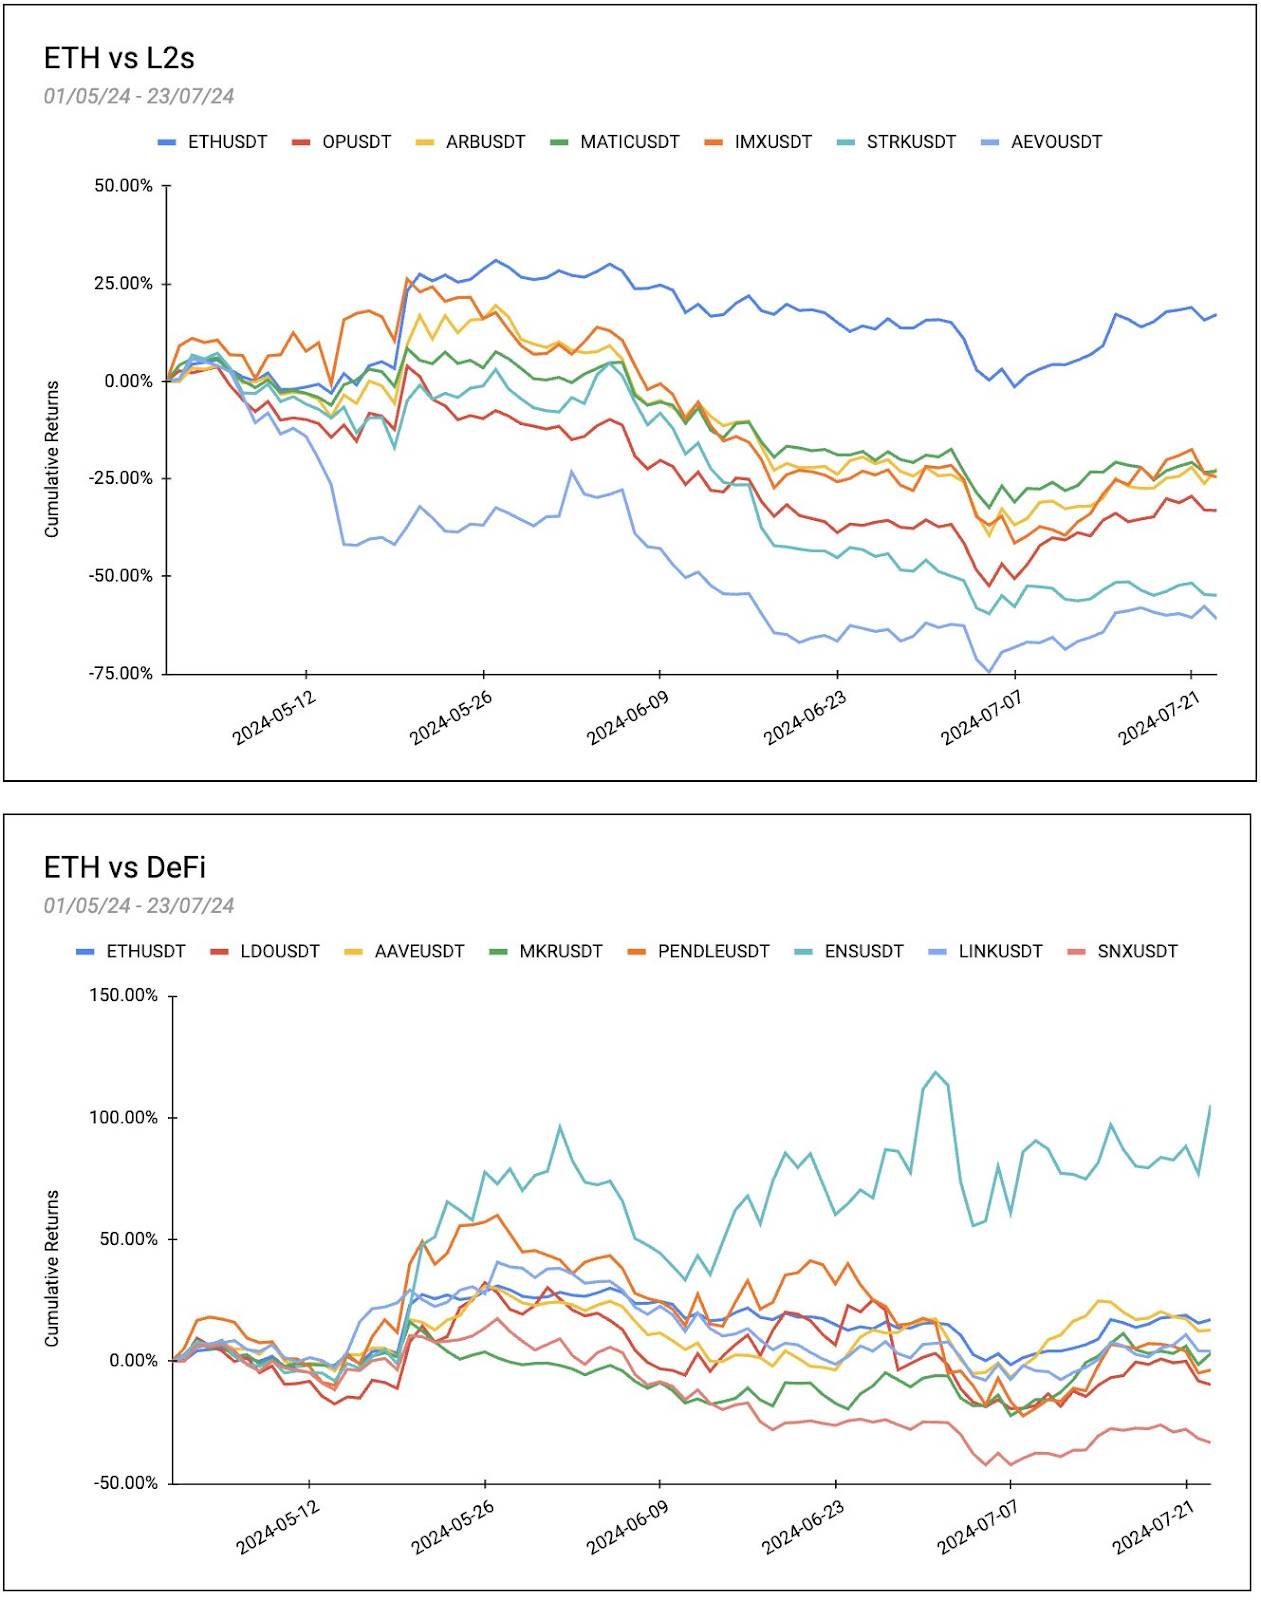
DeFi performed slightly better compared to ETH, posting an average return of +11.32% during the observation period. However, this result was largely driven by ENS; excluding ENS, the average return was -4.33%. Among all L2 and DeFi assets, ENS was the only one to outperform ETH, while AAVE delivered a respectable return, trailing ETH by only 4%.
Correlation Coefficient
The correlation coefficient indicates the degree of linear relationship between an observed asset and ETH. Values range from -1 to 1, with values closer to 1 indicating a strong positive relationship, and values closer to -1 indicating a strong negative relationship.
All tokens show a positive correlation with ETH, meaning their prices tend to move in tandem with Ethereum. The highest correlations are ARB (0.83), OP (0.8), and SNX (0.8), indicating strong positive relationships with ETH. In contrast, AEVO shows a relatively low correlation (0.4), suggesting a weaker link to ETH compared to others.
Beta vs ETH
Beta measures the volatility of an asset relative to ETH. It reflects how sensitive an asset's price movements are to changes in the benchmark—in this case, ETH. A beta of 1 means the asset moves in line with ETH. A beta greater than 1 indicates higher volatility than ETH, amplifying ETH’s movements. A beta below 1 suggests lower volatility, dampening ETH’s swings.
Most tokens have beta values around 1, indicating they generally move in sync with ETH. Notably, PENDLE has the highest beta at 1.5, signaling significantly higher volatility and a tendency to amplify ETH’s movements. Conversely, BNB has a low beta of 0.6, indicating less volatility than ETH and a dampening effect on ETH’s swings.
Sharpe Ratio
The Sharpe ratio provides insight into an asset’s risk-adjusted performance relative to ETH. A higher Sharpe ratio indicates better risk-adjusted returns. For this analysis, a 7% Dai Savings Rate (DSR) is used as the risk-free rate.
ENS has the highest Sharpe ratio at 2.45, indicating it delivered the best risk-adjusted returns among analyzed assets, followed by SOL at 1.86. STRK has the lowest Sharpe ratio at -3.22, indicating poor performance on a risk-adjusted basis. Only ENS and SOL delivered better risk-adjusted returns than ETH (1.24).
Several tokens have negative Sharpe ratios, including OP (-1.58), ARB (-1.35), and MATIC (-1.63), indicating their returns did not adequately compensate for the risks taken.
Metrics Denominated in BTC
When assessing beta against ETH, it’s also important to evaluate these assets relative to BTC—a metric often overlooked. In BTC terms, L2s declined by 67%, Alt L1s by 9.2%, DeFi by 34%, Memes by 2.4%, and ETH itself by 4.4%.
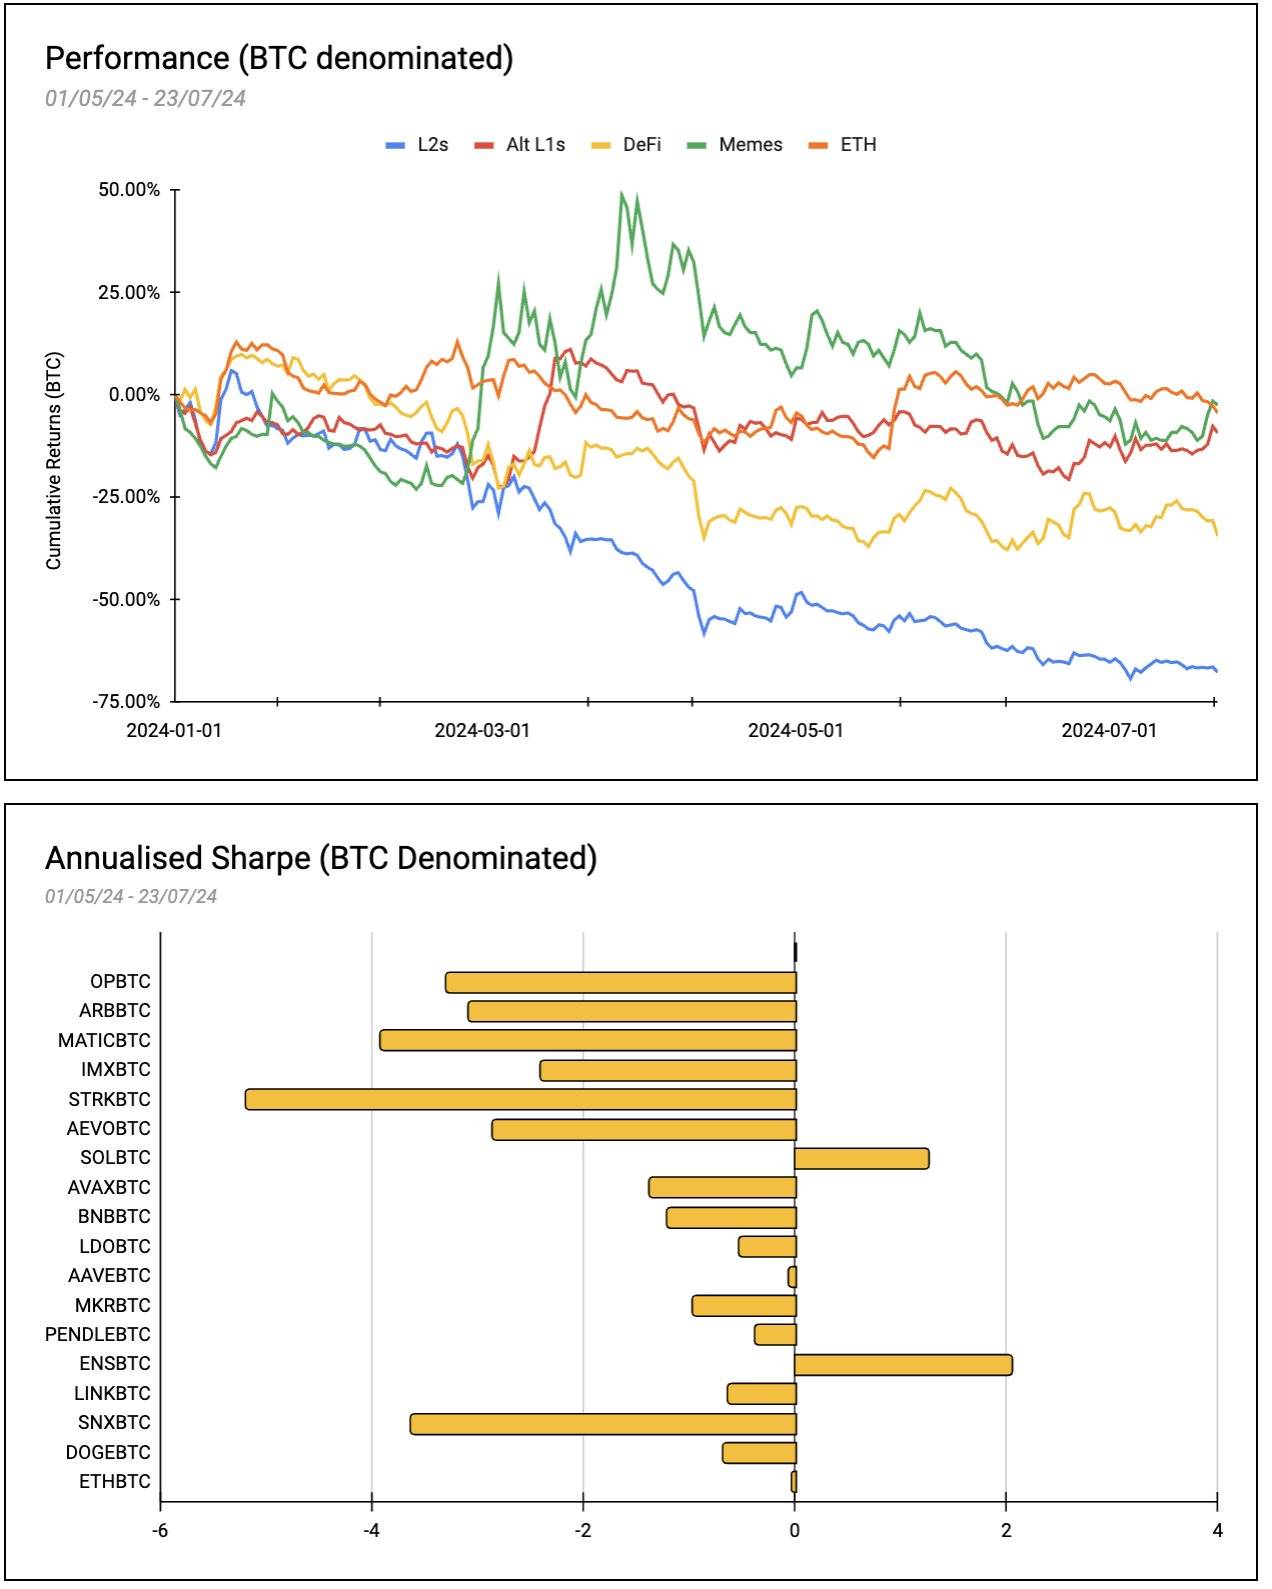
The Sharpe ratios in the chart above reveal the risk-adjusted performance of various tokens relative to BTC over the observation period. ENSBTC stands out with an annualized Sharpe ratio of 2.05, followed by SOLBTC at 1.26. ETHBTC has a Sharpe ratio of -0.02. All other tokens have negative Sharpe ratios, failing to deliver positive risk-adjusted returns compared to BTC.
Join TechFlow official community to stay tuned
Telegram:https://t.me/TechFlowDaily
X (Twitter):https://x.com/TechFlowPost
X (Twitter) EN:https://x.com/BlockFlow_News