From ETH ETFs to Market Opportunities: Leveraging ETH or Betting on Altcoins?
TechFlow Selected TechFlow Selected
From ETH ETFs to Market Opportunities: Leveraging ETH or Betting on Altcoins?
Only a few altcoins categorized as "ETH beta" on Crypto Twitter have managed to outperform ETH itself.
Author: THOR
Translation: TechFlow

Introduction
ETH ETFs are about to launch. While most people are speculating on the short- and long-term impacts of these products, another question arises: Can we capture this catalyst in ETH by gaining leveraged exposure to ETH beta?
ETH beta refers to altcoins within the Ethereum ecosystem that theoretically act as leveraged exposure to ETH. Common examples include LDO or ENS, which traders believe are more volatile than ETH itself. However, recently the term "ETH beta" has largely been considered a meme, as altcoins have generally underperformed. Picking an altcoin correlated with ETH as a leveraged play is like finding a needle in a haystack, often resulting in traders and investors underperforming ETH over longer timeframes.
So, is this time different? At the time of ETH ETF approval, is the best strategy to bet on altcoins with higher beta relative to ETH? Today's article will explore this question from a quantitative perspective.
Price Performance
The TOTAL3 (altcoin market cap) to ETH market cap ratio is approximately 1.48. Since 2020, this ratio has only been this low a few times, indicating that ETH has outperformed most altcoins.
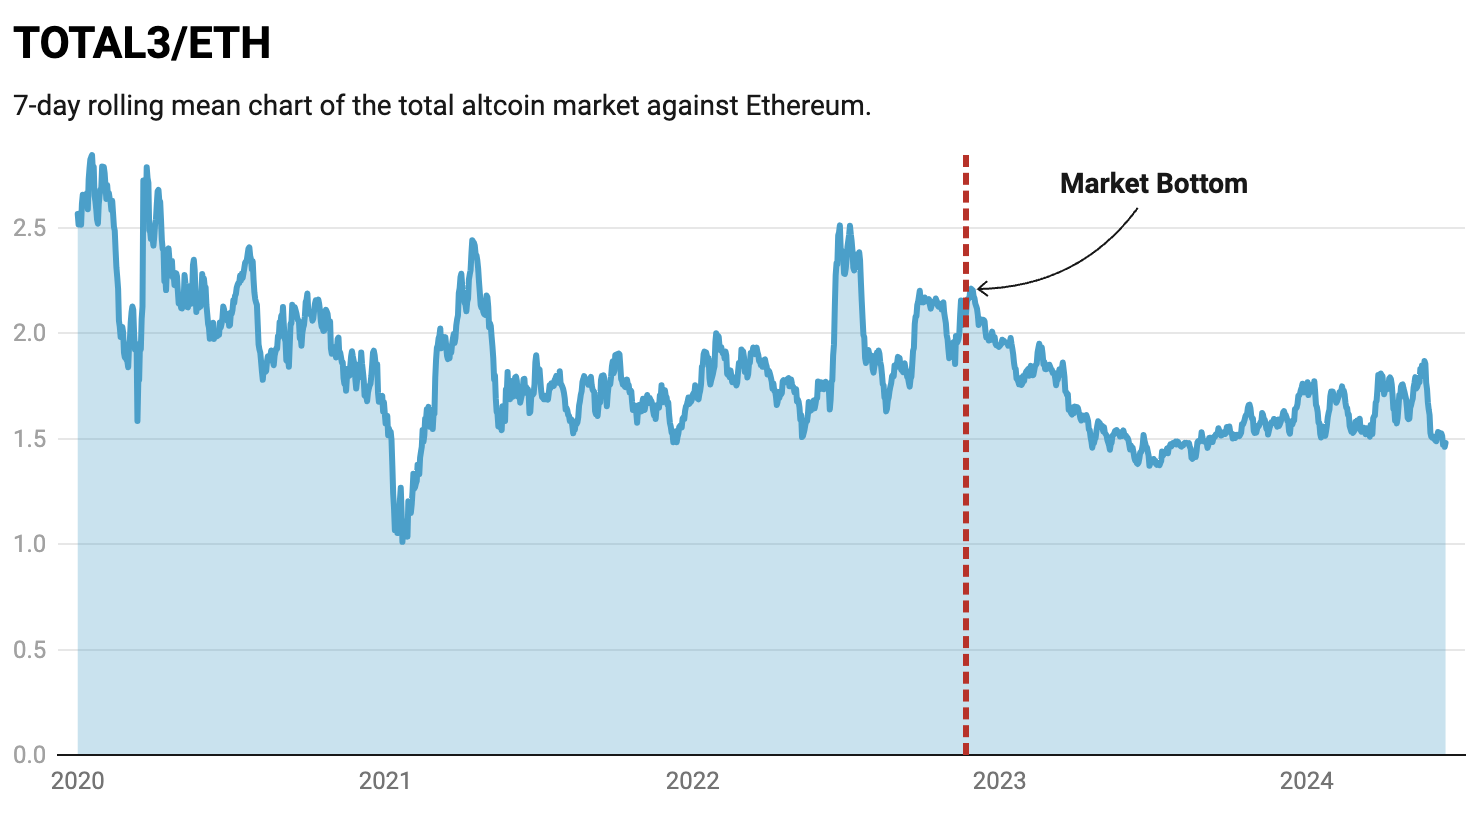
Chart: hyphin; Source created using Datawrapper
This chart can be interpreted from several angles. First, historically these altcoins tend to rebound at this level. Given the recent highly bearish sentiment toward altcoins, this could be a potential scenario. However, the chart shows a multi-year downtrend, suggesting it’s difficult to find altcoins that outperform ETH. Moreover, while altcoin market caps may increase, prices could still fall due to low circulating supplies and significant token unlocks. Thus, identifying reliable "ETH beta" assets becomes even harder.
The sample of tokens analyzed as potential ETH beta includes:
[L2s]
-
OP, ARB, MANTA, MNT, METIS, GNO, CANTO, IMX, STRK
[Alt L1s]
-
SOL, AVAX, BNB, TON
[DeFi]
-
MKR, AAVE, SNX, FXS, LDO, PENDLE, ENS, LINK
[Memes]
-
PEPE, DOGE, SHIB
Zooming in, the following charts show the performance of ETH and these four categories of tokens year-to-date (past 198 days).
L2 Year-to-Date Performance Percentage
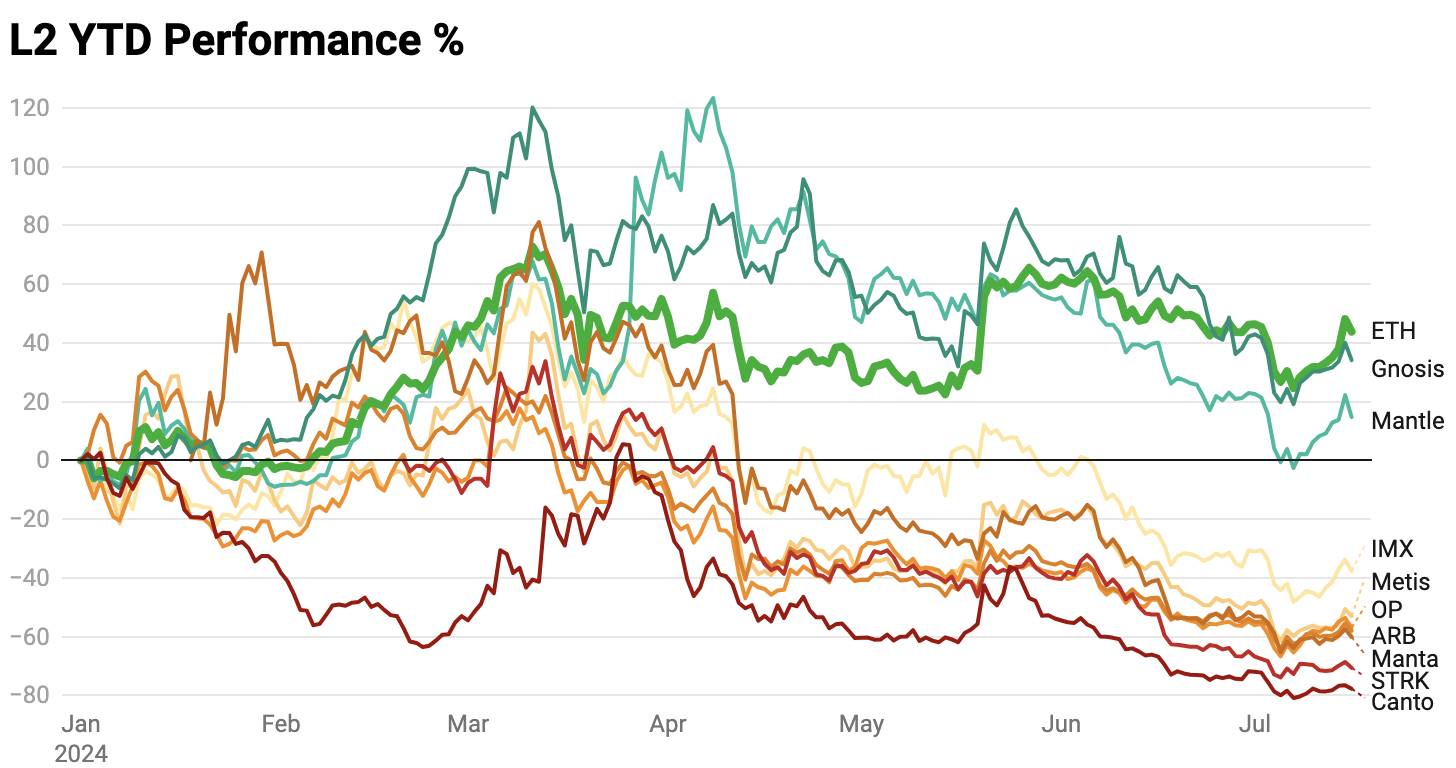
Chart: Thor Hartvigsen; Created using Datawrapper
Notably, no L2 token has outperformed ETH year-to-date. The best performer, GNO, rose 34%, while ETH increased by 44%. The worst performers include MANTA, STRK, and CANTO, all down over 60% year-to-date.
Top Alt L1 Year-to-Date Performance Percentage
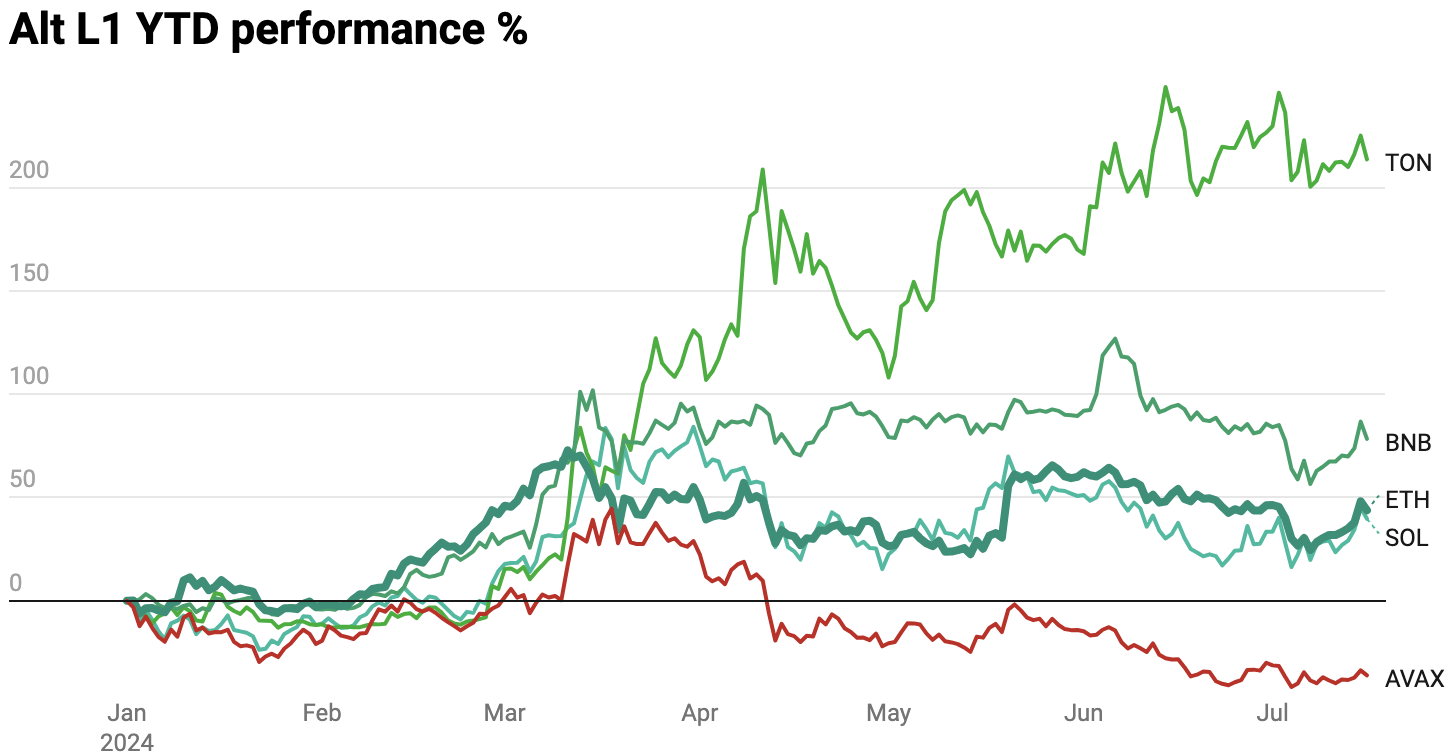
Chart: Thor Hartvigsen; Created using Datawrapper
Top alt L1 tokens performed much better, with both TON and BNB clearly outperforming ETH. AVAX is the only one that declined year-to-date.
DeFi Year-to-Date Performance Percentage
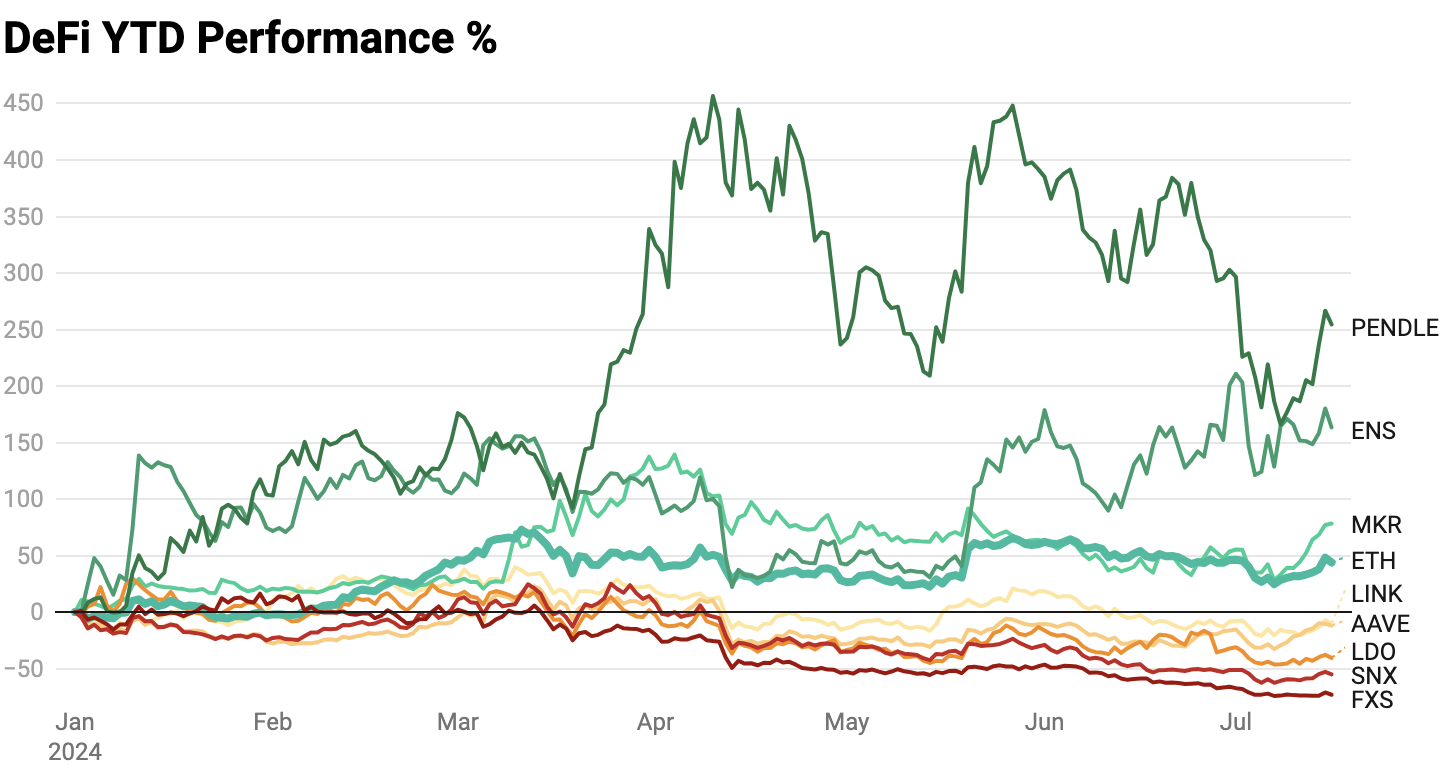
Chart: Thor Hartvigsen; Created using Datawrapper
Among the eight DeFi tokens in this basket, three outperformed ETH: PENDLE (+254%), ENS (+163%), and MKR (+78%). The remaining five declined year-to-date, with FXS being the worst performer, down 73%.
Meme Token Year-to-Date Performance Percentage
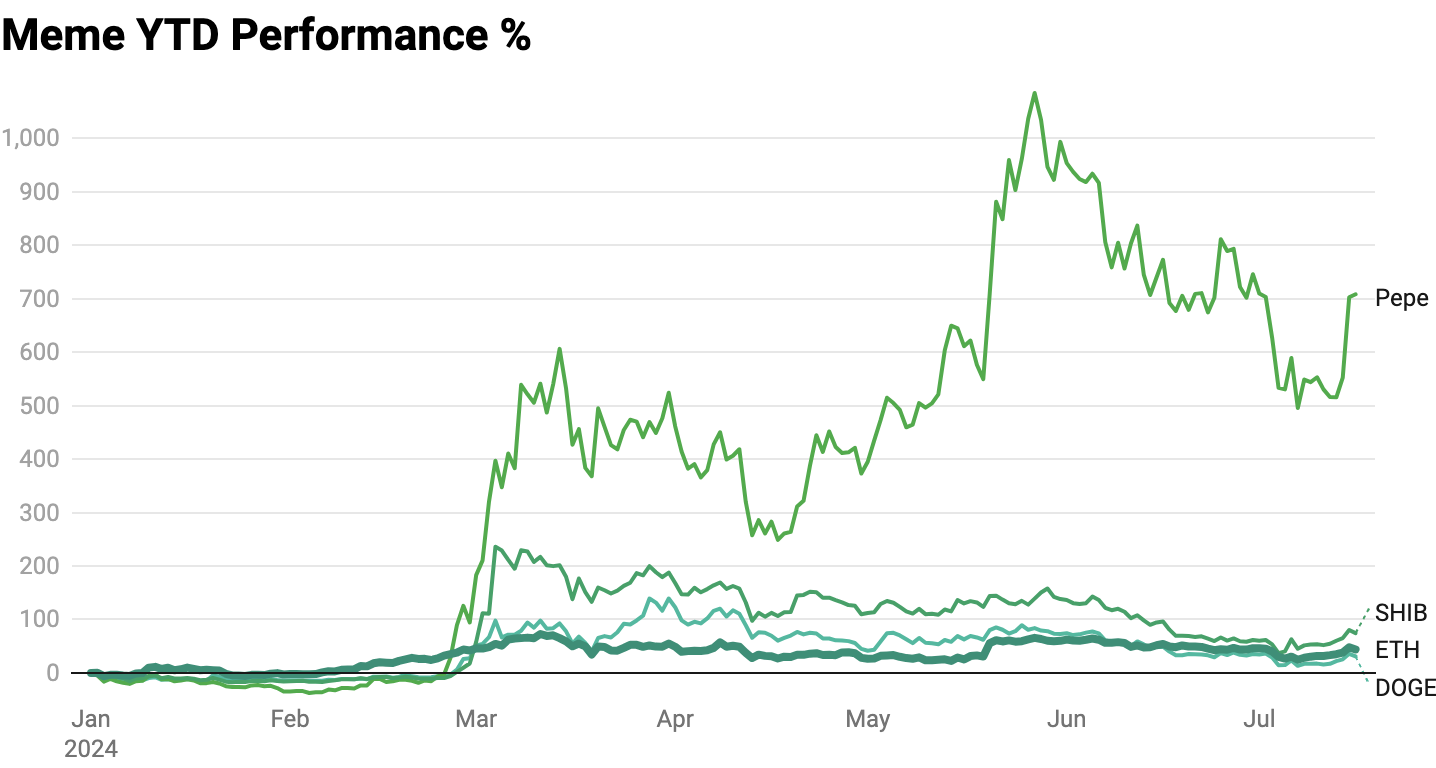
Chart: Thor Hartvigsen; Created using Datawrapper
In 2024, meme tokens stood out, particularly among the largest Ethereum-native meme tokens. PEPE had the highest gain, rising 708%; SHIB up 74%; DOGE up 31%.
Summary:
Year-to-Date Performance Percentage
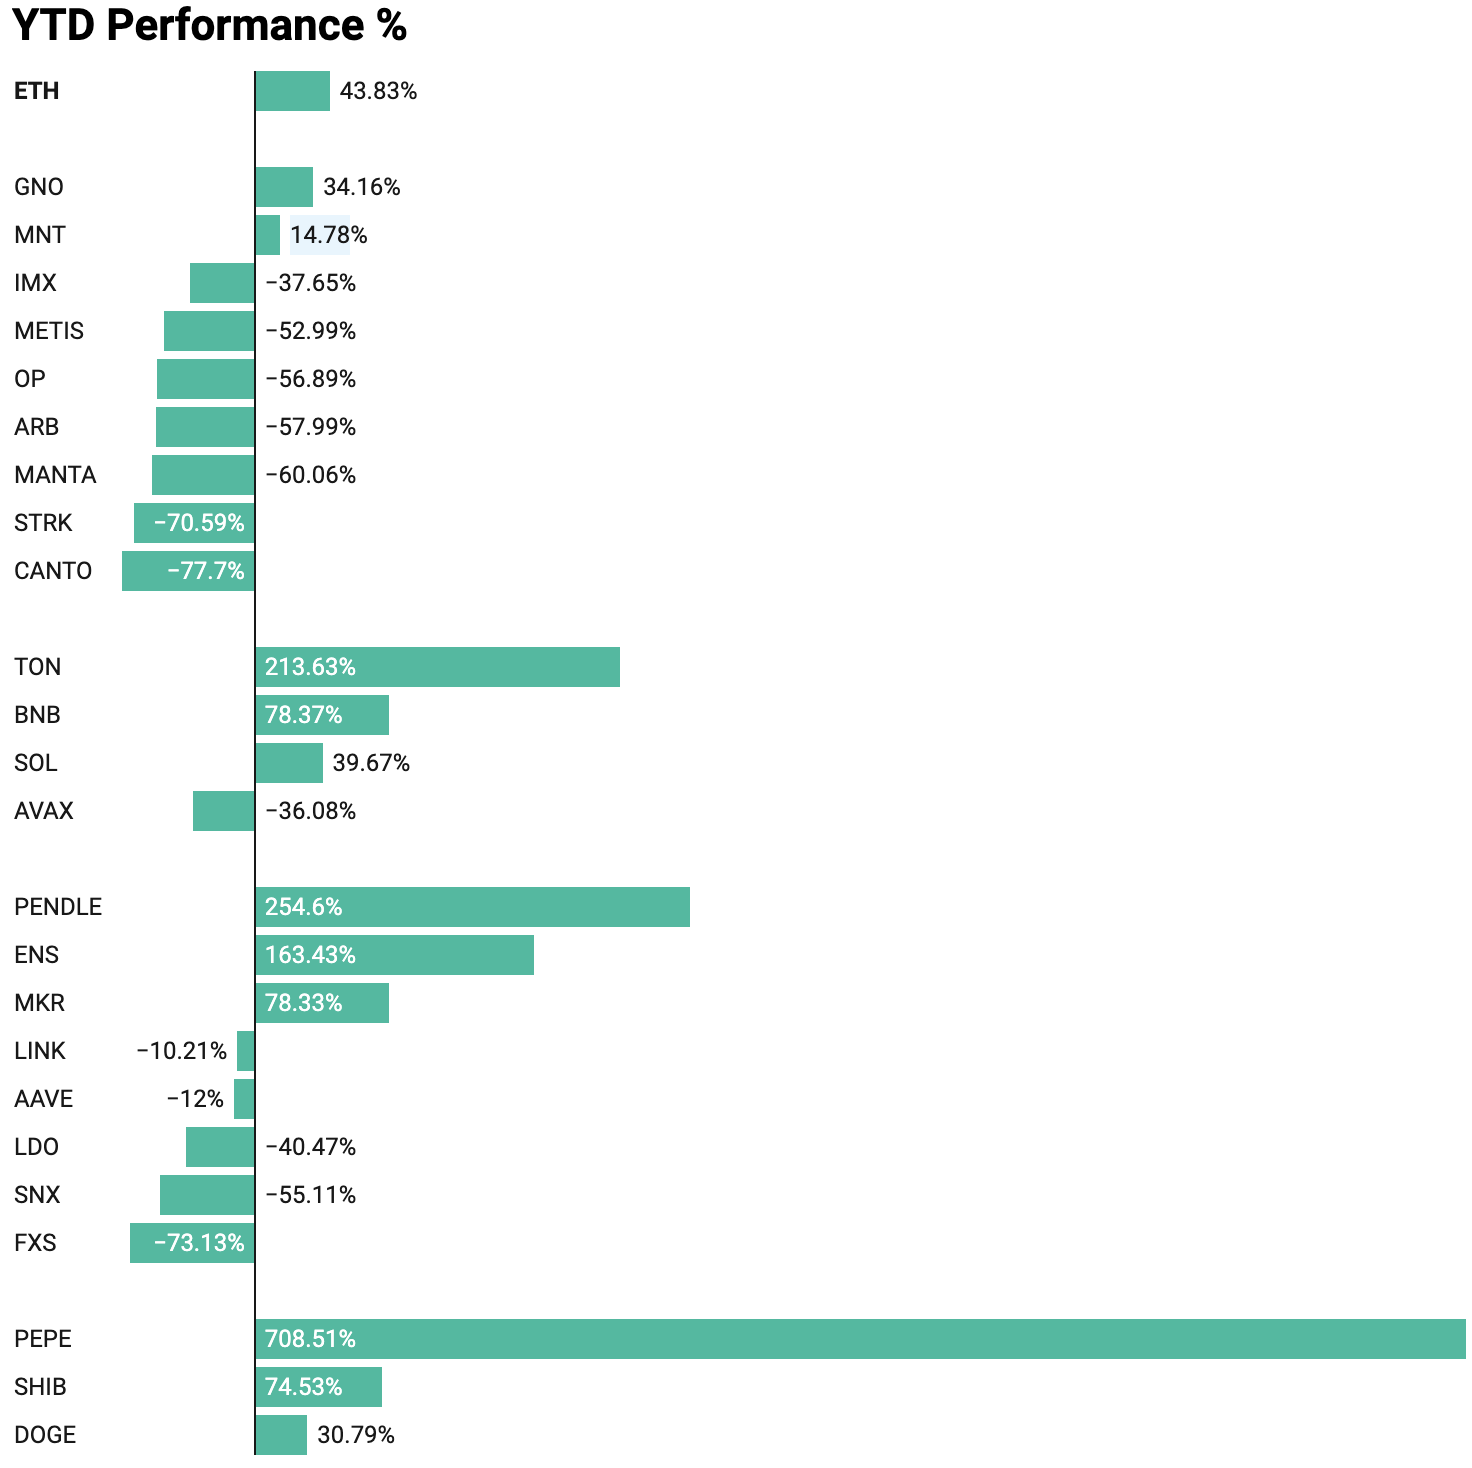
Chart: Thor Hartvigsen created using Datawrapper
Correlation
The selected altcoin sample is not random but consists of tokens typically believed to correlate with ETH performance. For example, a random DEX token on Solana or Sui has lower correlation with ETH compared to an ERC-20 token on the Ethereum network.
The individual year-to-date performances above are informative, although past performance does not guarantee future results—it may contain some signals. If we want to analyze whether these tokens truly act as leveraged beta exposure to ETH rather than just exhibiting individual behavior, we need to dig deeper. There is no perfect way to model this, and crypto markets are far from efficient. Therefore, the data obtained must be treated cautiously. However, one method to study this behavior is to examine the correlation between these altcoins and ETH.
Correlation measures the strength and direction of the relationship between two assets and helps explain how they move relative to each other. Correlation values range from -1 to 1, where 1 indicates perfect positive correlation and -1 indicates perfect negative correlation.
The chart below shows the correlation between various tokens and ETH. Naturally, the correlation between ETH and itself is 100%. The altcoins with the highest correlation to ETH are GNO, SNX, METIS, AAVE, and ARB.
Chart by Thor Hartvigsen created using Datawrapper
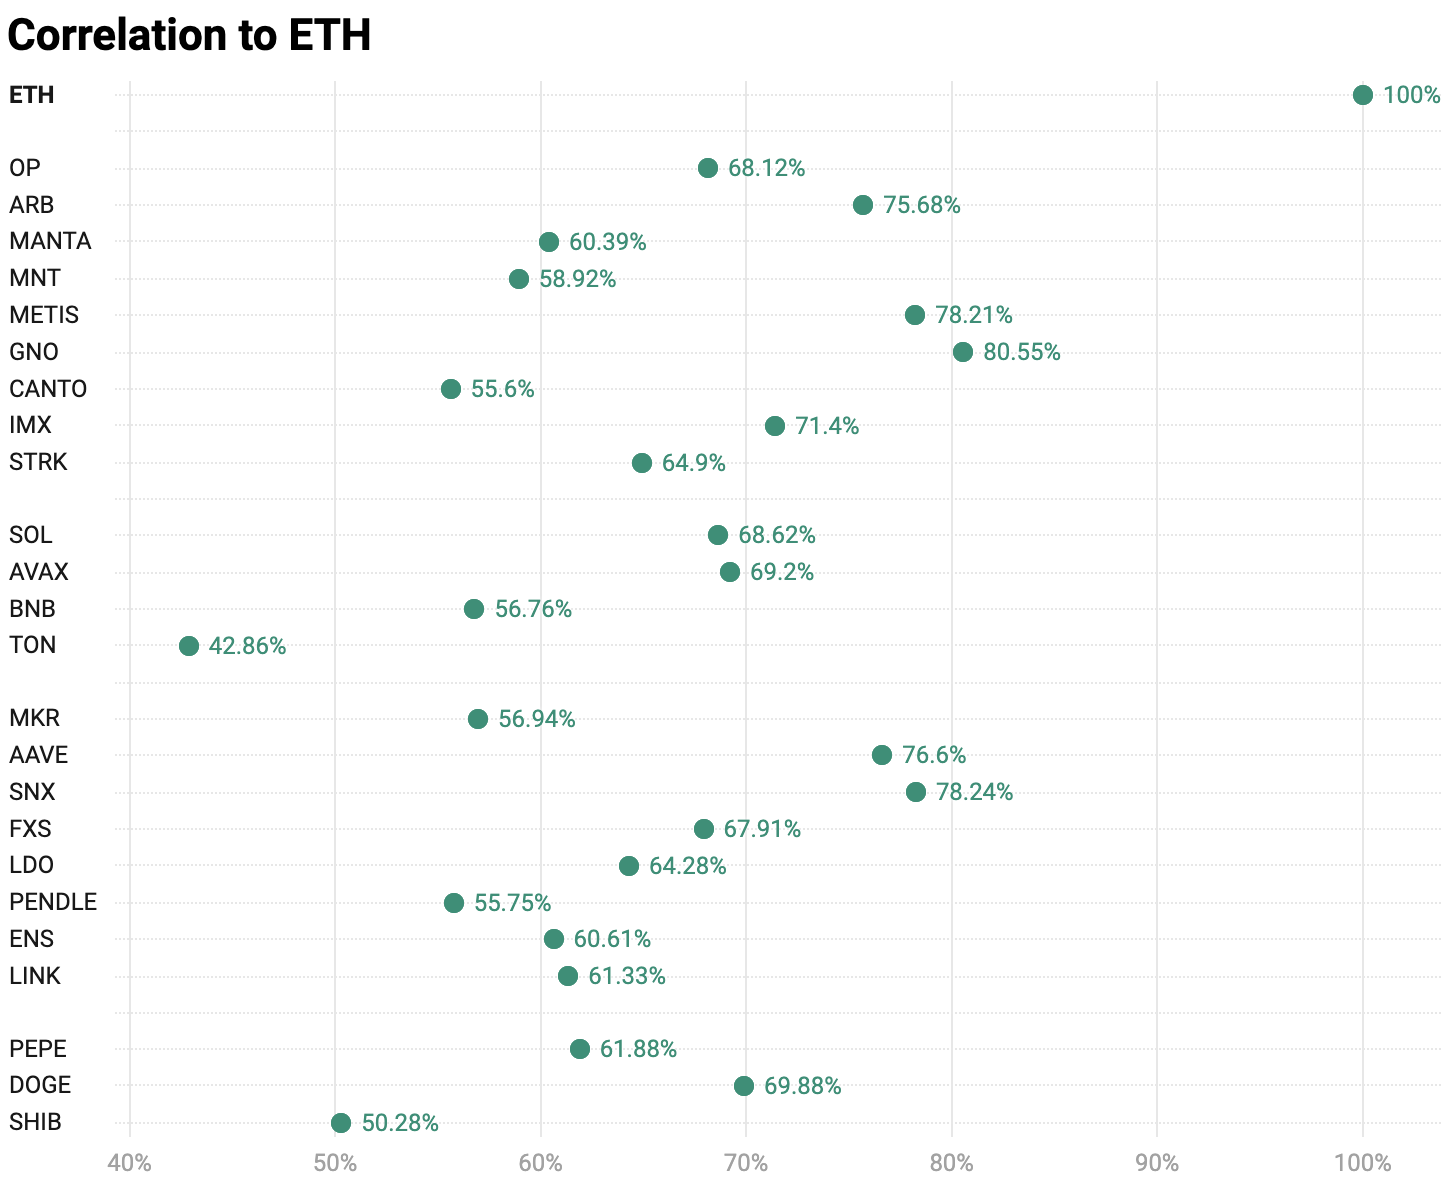
Chart: Thor Hartvigsen; Created using Datawrapper
Among the top-performing tokens year-to-date—PEPE, TON, PENDLE, ENS, and BNB—their correlation with ETH is all 60% or lower, suggesting their performance was driven more by other factors (possibly BTC correlation or idiosyncratic variables). TON has the lowest correlation with ETH, making it an unsuitable asset for capturing leveraged ETH exposure.
Beta
Going further, we can calculate the year-to-date beta of these altcoins relative to ETH. Beta indicates an asset’s volatility relative to a base market (in this case, ETH). ETH has a beta of 1; altcoins with higher volatility have beta > 1, and those with lower volatility have beta < 1.
Altcoin Beta vs. Ethereum Correlation
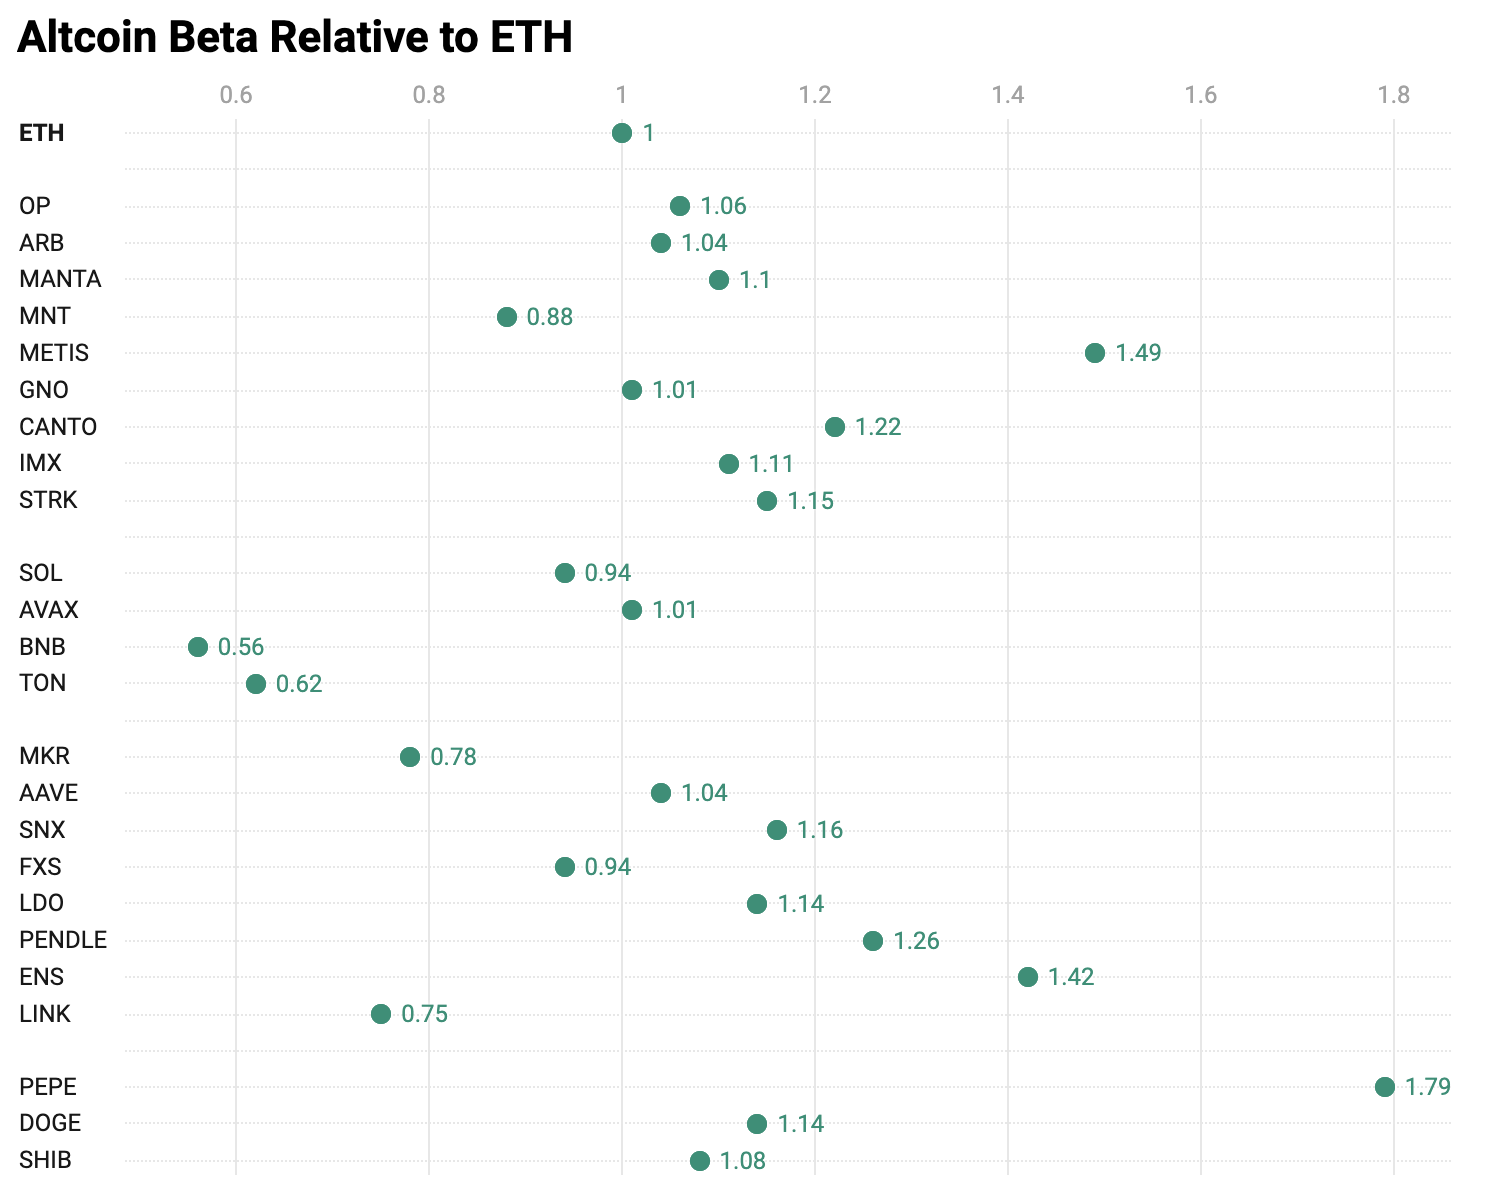
Chart: Thor Hartvigsen; Created using Datawrapper
From this analysis, only a few altcoins exhibit high beta relative to ETH: PEPE, METIS, ENS, and PENDLE. High-beta altcoins are more volatile than ETH itself. Combining our correlation and beta analyses, PEPE could be considered one of the better ETH beta assets—if ETH appreciates due to ETF approvals, it might deliver strong returns. However, it’s important to remember the limitations of this analysis. Many external factors influence these assets’ behaviors and are not included here, so treat this as a theoretical exercise rather than direct trading guidance.
Sharpe Ratio
Finally, we can calculate the year-to-date Sharpe ratio of these assets to measure their recent performance. The Sharpe ratio measures risk-adjusted return by subtracting the risk-free rate from the return and dividing by volatility (standard deviation). The risk-free rate used in this analysis is Maker’s “DSR” (DAI Savings Rate), offering an 8% annual yield. A higher Sharpe ratio indicates better performance.
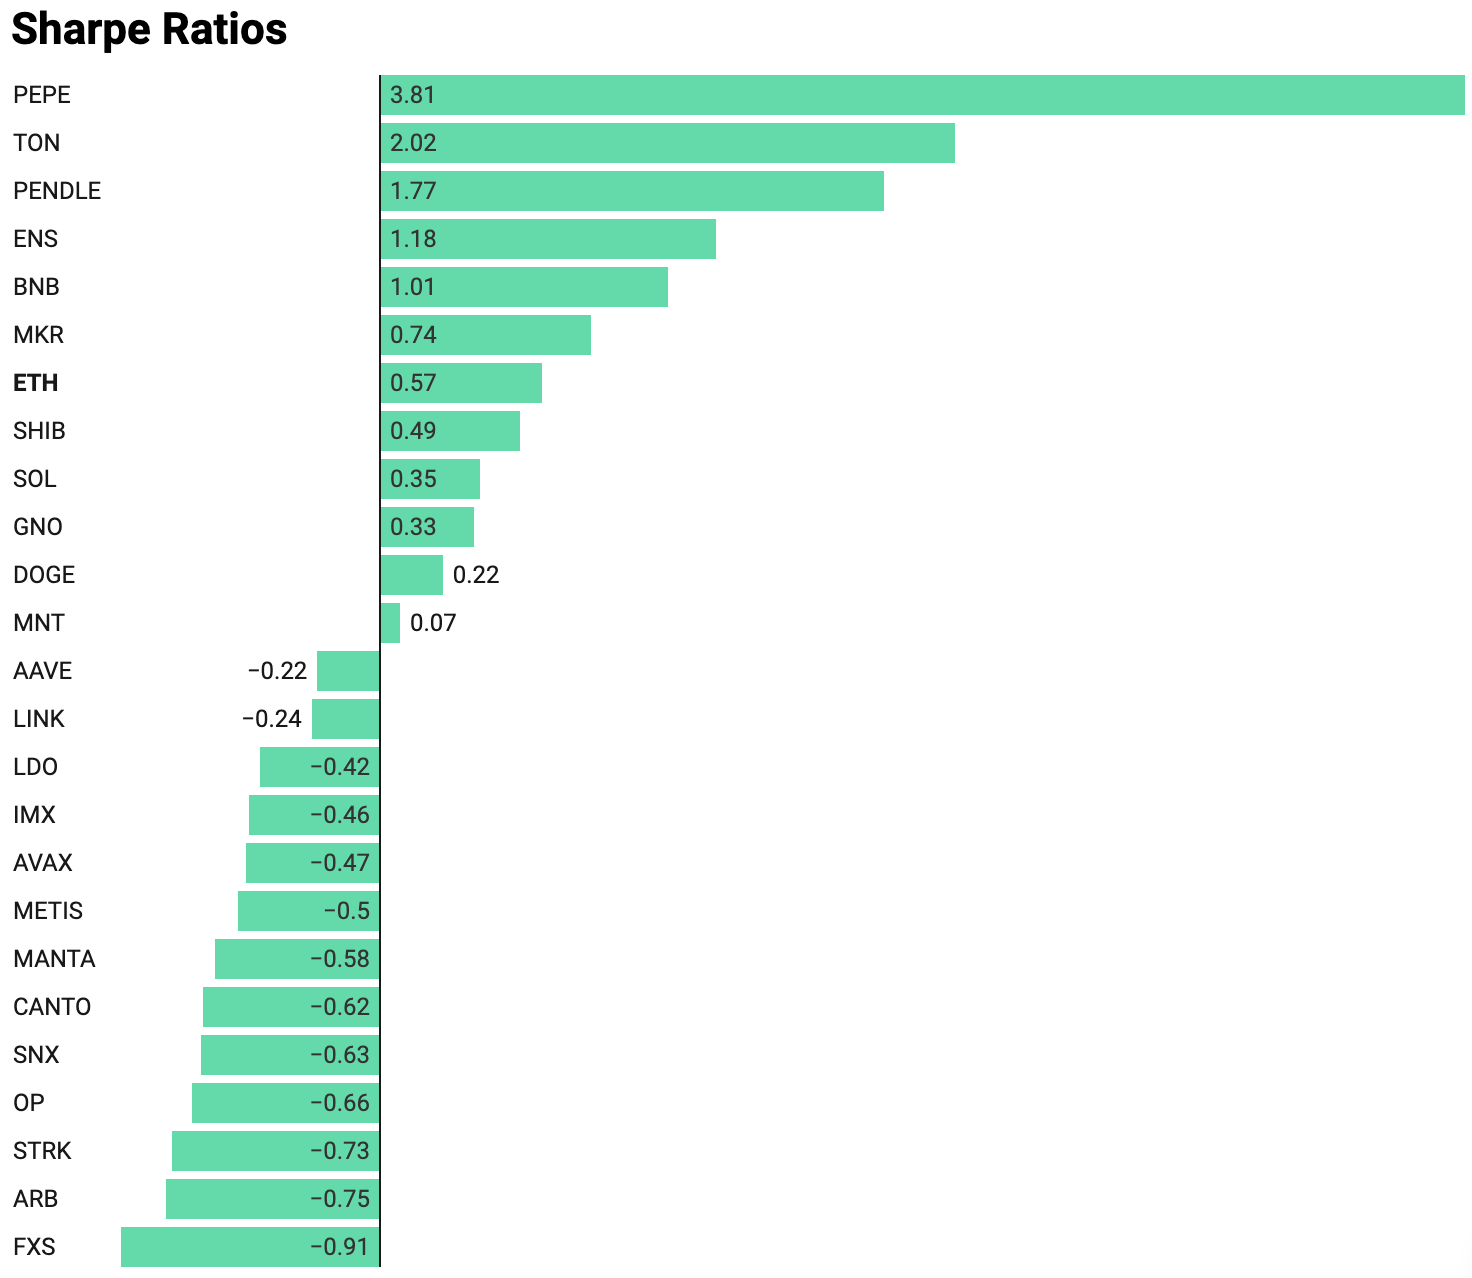
Chart: Thor Hartvigsen created using Datawrapper
Conclusion
So, what are the key takeaways from this analysis?
-
First, only a few altcoins categorized on Crypto Twitter as "ETH beta" have outperformed ETH itself.
-
Second, altcoin performance cannot be fully attributed to correlation with or beta to ETH. These tokens are influenced not only by assets beyond ETH but also by individual-specific variables.
Buying these altcoins for leveraged ETH exposure is unwise, as you may incur many unknown additional risks. If you want leveraged exposure to ETH, going long 2x ETH directly on Aave is more rational. In that case, you get 100% correlation and a beta of 2.
One final point: The expectation that ETH will perform well after ETF approval mainly stems from potential capital inflows from new ETH ETF buyers. These altcoins won’t benefit from such positive buying pressure (they aren't the tokens in newly launched ETFs), and face substantial token unlocks in the coming weeks or months. Don’t overcomplicate things.
Join TechFlow official community to stay tuned
Telegram:https://t.me/TechFlowDaily
X (Twitter):https://x.com/TechFlowPost
X (Twitter) EN:https://x.com/BlockFlow_News