BTC Price Movements from the Perspective of the Fed's Monetary Policy Cycle
TechFlow Selected TechFlow Selected
BTC Price Movements from the Perspective of the Fed's Monetary Policy Cycle
With the approval of BTC spot ETFs, the impact of dollar tides on the crypto market will become increasingly evident.
 Navigating Web3 tides with focused insights
Author: Lisa, LD Capital
Almost all asset prices are influenced by the Federal Reserve's monetary and fiscal policies, and BTC is no exception. Being in the crypto market requires constant attention to various U.S. economic data, statements from Fed officials, and the direction of monetary policy. With the approval of BTC spot ETFs, the impact of U.S. monetary tides on the crypto market will become increasingly evident. This article primarily reviews BTC price movements across different phases as illustrated in the chart below.
(1) From the Fed's final rate hike to the start of rate cuts
Period: Dec 2018 – Jul 2019
BTC price performance: sideways then upward, rising from ~$3,500 to $12,000
Main uptrend began: Apr 2019 (close to May 2019 when balance sheet reduction slowed), suggesting the market priced in rate cut expectations about 3 months early.
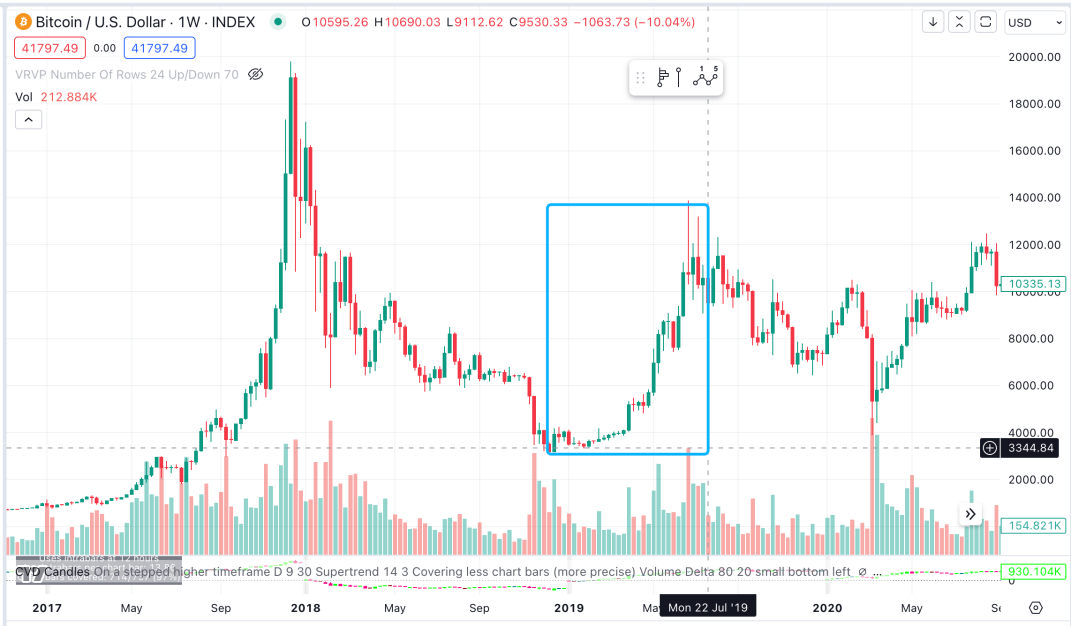
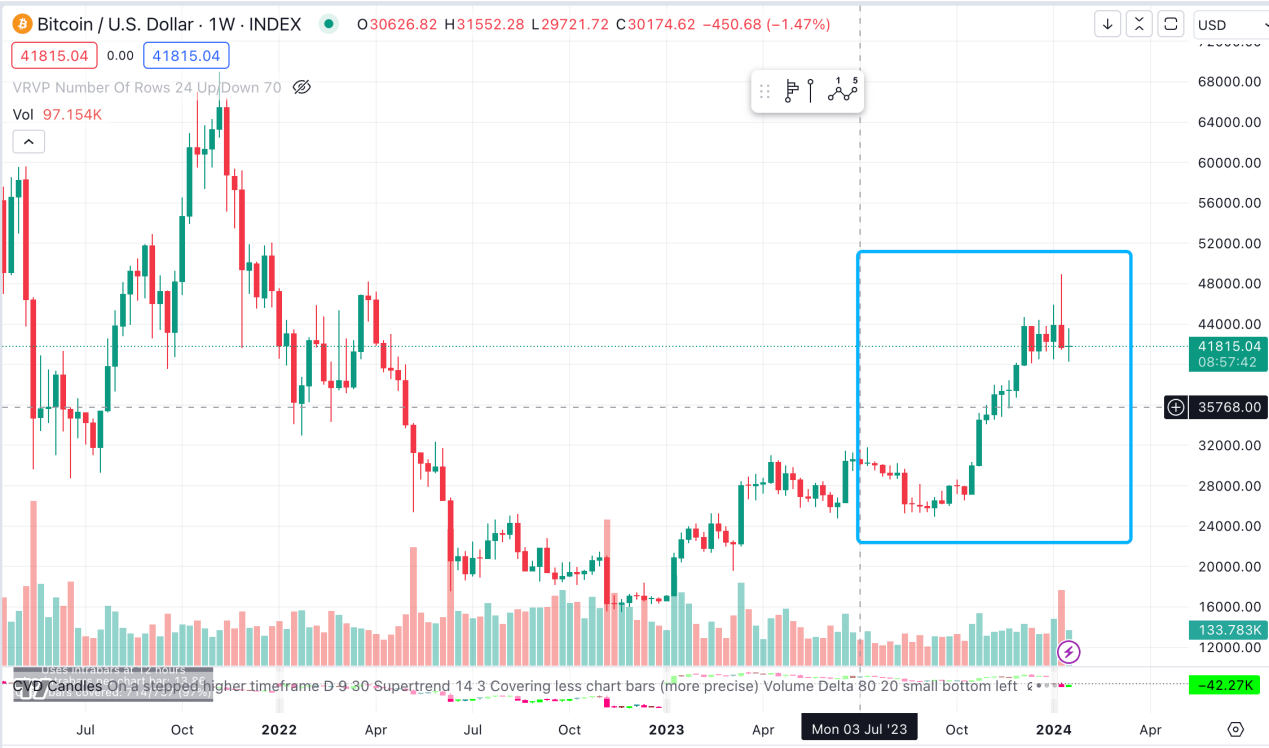
This historical period corresponds to the current market phase. It has been about six months since the Fed’s last rate hike in July 2023. Similarly, BTC prices began a major rally in October 2023—three months after rate hikes paused. In recent months, BTC prices have been significantly affected by ETF expectations, yet coincidentally still align with past cyclical patterns in both timing and shape.
(2) From the start of Fed rate cuts to pre-pandemic disruption
Period: Jul 2019 – Mar 2020
BTC price performance: down first, then up
Prices declined after rate cuts began, falling from ~$10,000 to $7,000 by December (a 30% drop). The end of balance sheet reduction in Sep 2019 did not generate a noticeable positive effect. Prices rebounded from December 2019 to February 2020, returning to $10,000.
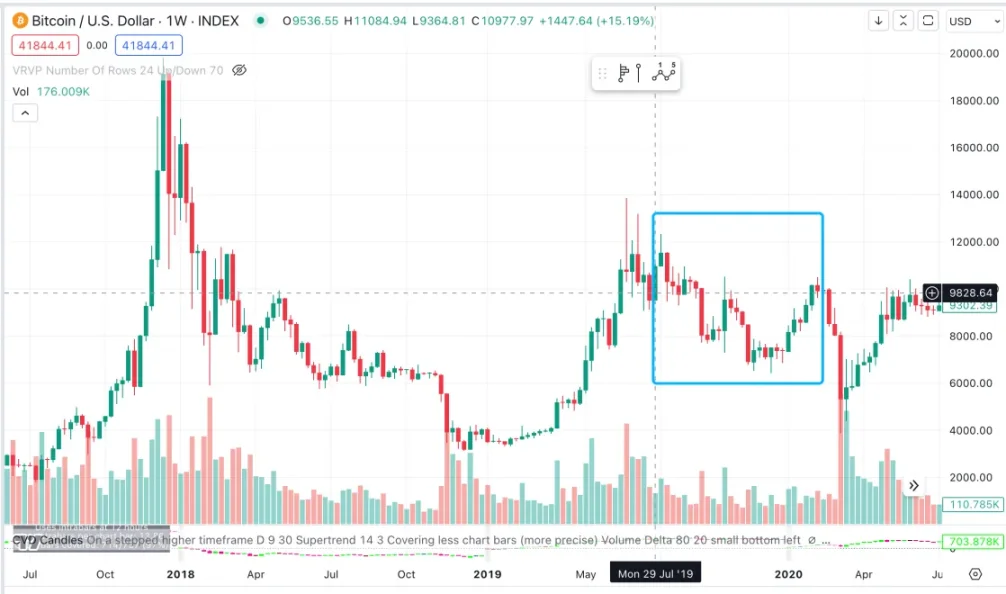
This phase represents where the market is expected to enter in 2024. Historically, BTC performance following actual rate cuts and the end of balance sheet reduction showed an overall pattern of declining first, then rising.
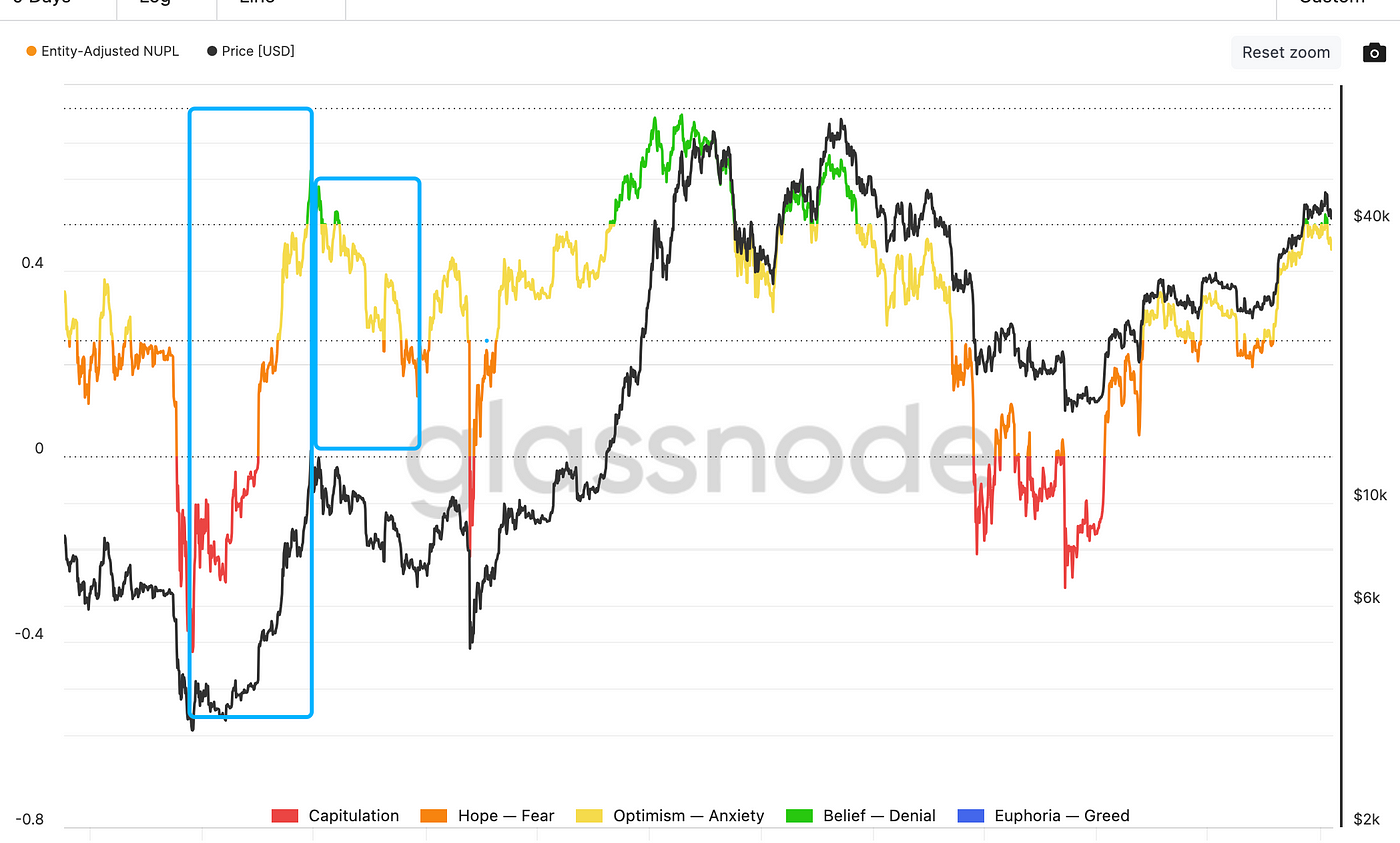
The combination of these two phases with NUPL indicators can effectively identify阶段性 high and low points.
(3) Period of pandemic-driven monetary easing
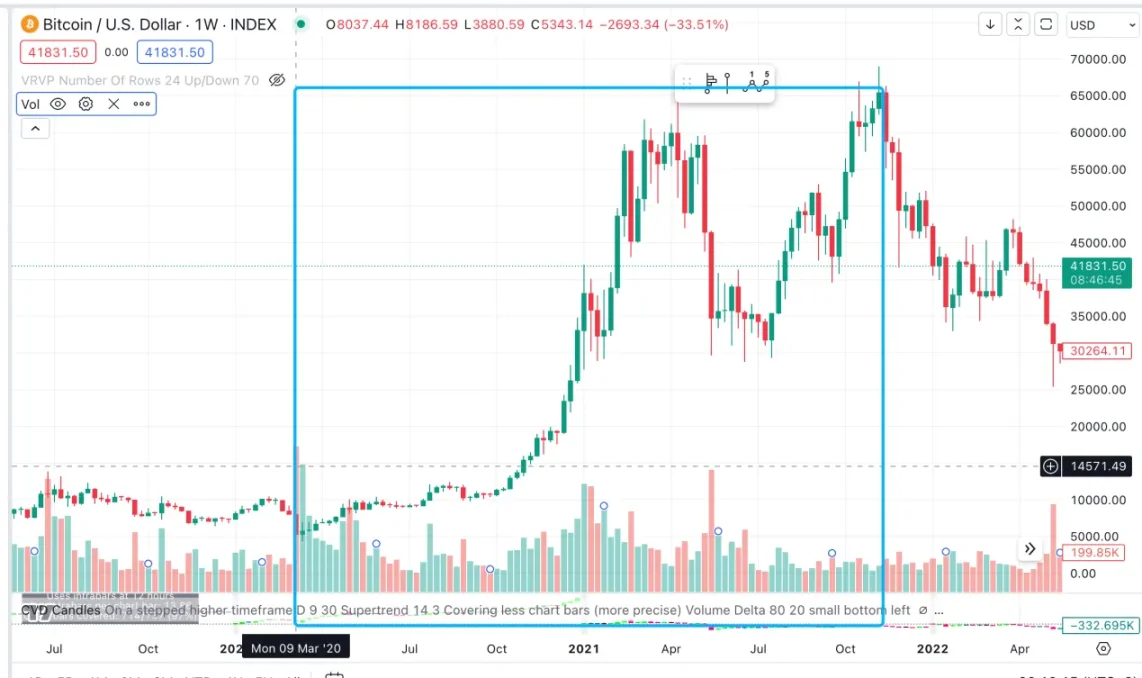
After March 2020, impacted by the COVID-19 pandemic, the Fed rapidly cut rates and launched large-scale QE. Combined with the halving event in May 2020, the market experienced a brief downturn before entering a major bull run, with BTC rising from ~$5,000 to $65,000.
The BTC market peak occurred in Nov 2021, four months before the end of monetary easing (first rate hike in Mar 2022), indicating that the market priced in rate hike expectations approximately four months in advance—similar to how it previously anticipated rate cuts.
Absent any black swan events, this cycle is unlikely to replicate such aggressive monetary policy or achieve the same pace or magnitude of price increase, but the directional trend remains.
(4) Resumption of tightening: Fed rate hikes from initiation to final hike
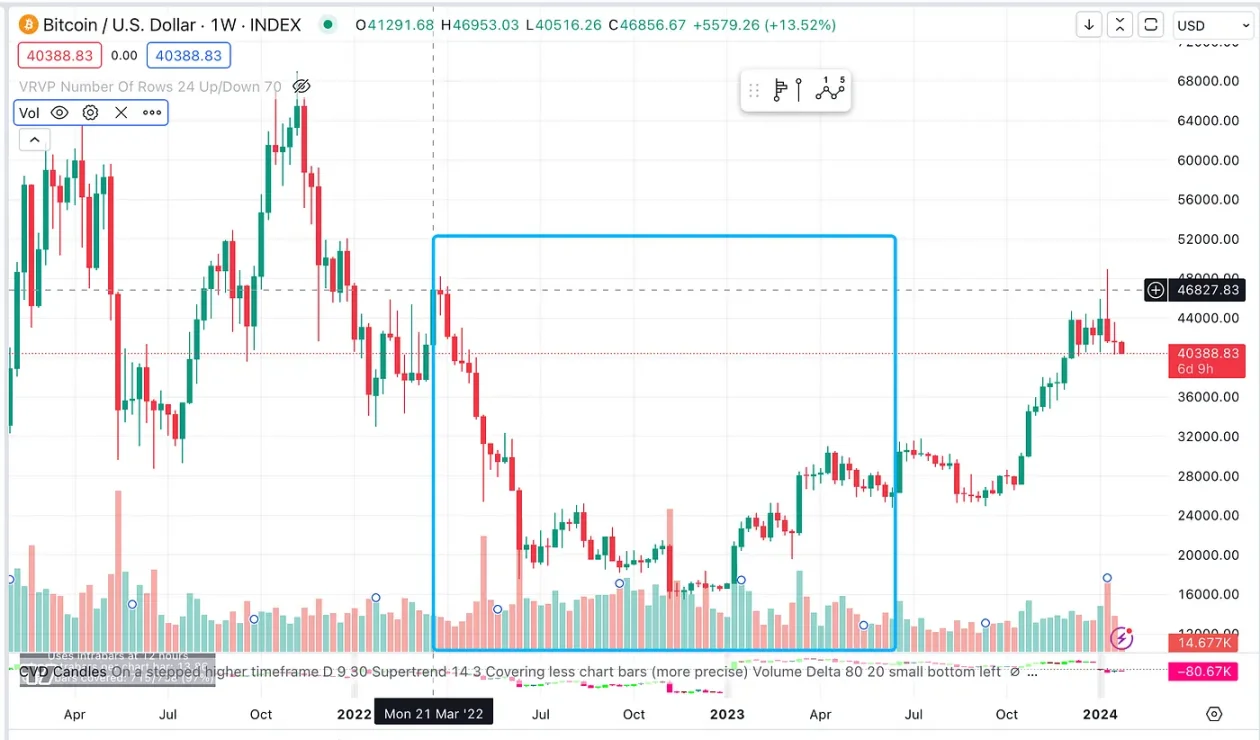
Period: Rate hikes started in Mar 2022, ending with the final hike in Jul 2023; Balance sheet reduction began in Jun 2022 and continues to date
BTC price performance: dropped from ~$46,000 to a low of $16,000, bottoming out after about nine months and beginning recovery in early 2023
The synchronized rise of BTC and the Nasdaq Index starting in early 2023 may be linked to market expectations that U.S. Treasury yields had peaked and that the pace of Fed rate hikes would slow.
Overall, rate cuts appear to have a greater impact on the BTC market than balance sheet reduction. So when will rate cuts begin this year?
Following the December FOMC meeting, Fed Chair Powell sent a "dovish" signal, boosting market expectations for rate cuts. However, recent U.S. economic data have been relatively strong: December CPI rose 3.4% YoY (vs. 3.1% prior), core CPI rose 3.9% YoY (vs. 4.0% prior), both above expectations. Meanwhile, the labor market remains tight. Current market pricing indicates a 52.88% probability that no rate cut will occur in March.
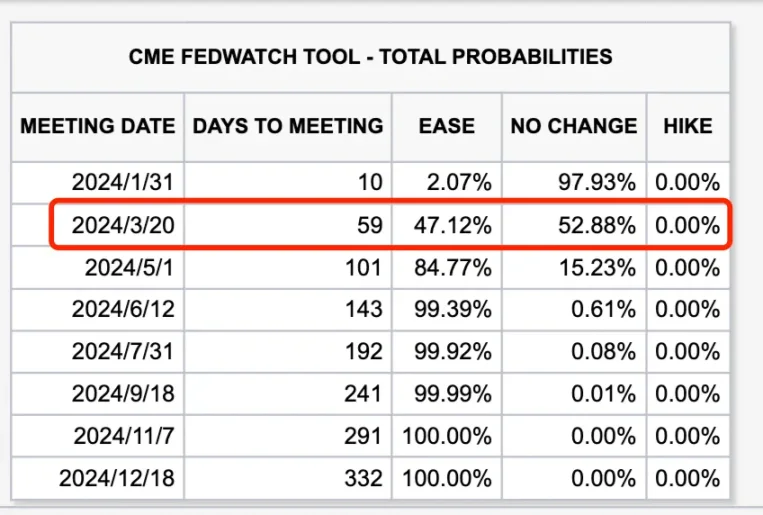
For 2024, expected rate cuts are likely either in March or May. Viewed rigidly, the market might experience a pullback around that time. Of course, spot ETFs represent a significant market disruption—the realization of long-awaited利好 and selling pressure from GBTC are currently dominant factors affecting BTC prices. Additionally, the upcoming BTC halving is occurring much earlier compared to the previous cycle (last halving happened 10 months after rate cuts began); this time, the halving falls precisely between the two anticipated rate cut start dates. Although price increases following halving events typically lag the actual event date, timing-wise it could partially offset potential declines following rate cuts.
Join TechFlow official community to stay tuned
Telegram:https://t.me/TechFlowDaily
X (Twitter):https://x.com/TechFlowPost
X (Twitter) EN:https://x.com/BlockFlow_News
 Cycle Capital Research