

Delphi Digital Co-Founder: Crypto Market Cycles May Be Predictable, Data Signals Bull Market Imminent
TechFlow Selected TechFlow Selected
Delphi Digital Co-Founder: Crypto Market Cycles May Be Predictable, Data Signals Bull Market Imminent
Bull market catalysts are accumulating...
Written by: Kevin Kelly
Translated by: TechFlow
Cryptocurrency markets tend to be highly cyclical, and this cyclicality is remarkably consistent and not coincidental. It is predictable. If we're right in our assumptions, this has profound implications for the future of crypto markets. It's time to bring out some charts...
Growing evidence suggests we are in the early stages of a new cycle, with risk assets such as equities and cryptocurrencies quietly confirming this trend throughout the year. In my view, this is more than just another bear market bounce.
The cyclical and consistent nature of cryptocurrency markets manifests in several ways:
-
The time interval from peak to trough;
-
The time required to recover back to prior cycle highs;
-
The time it takes for prices to rise to new cycle highs.
Using Bitcoin ($BTC) as a benchmark, a typical cycle unfolds as follows:
-
Bitcoin reaches a new all-time high;
-
It undergoes roughly an 80% drawdown, reaching its bottom about one year later;
-
It takes approximately two years to recover back to previous highs;
-
Prices rise for about one year before hitting a new all-time high.
Recent cycles have almost perfectly followed this blueprint...
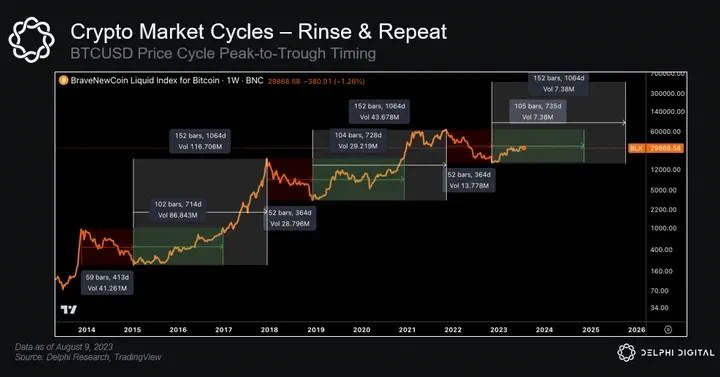
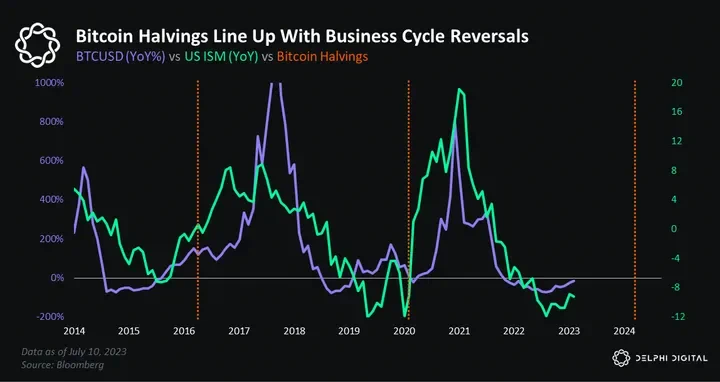
Each cycle typically lasts around four years, but their duration and consistency are not random—each cycle aligns almost perfectly with the periodic shifts of the business cycle...
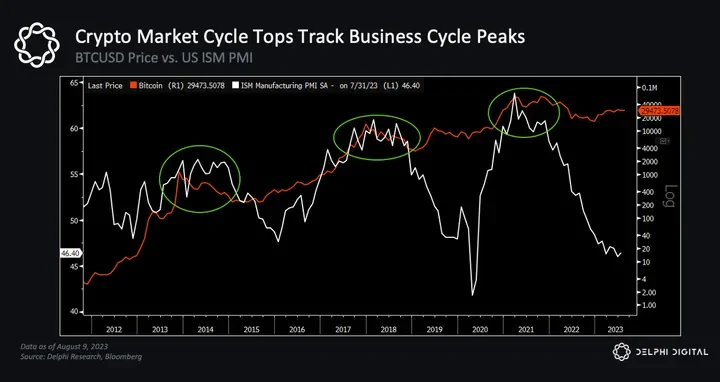
Bitcoin price peaks occur simultaneously with signs of a peak in the ISM index, while metrics such as active addresses, total transaction volume, and total fees also peak at the same time as ISM. As the business cycle shows signs of recovery, so too does network activity level...
(TechFlow note: The full name of the ISM index is “Institute of Supply Management Manufacturing Index,” a key data series released by the Institute for Supply Management in the U.S., which significantly reflects the health of the U.S. economy and influences the direction of the dollar.)

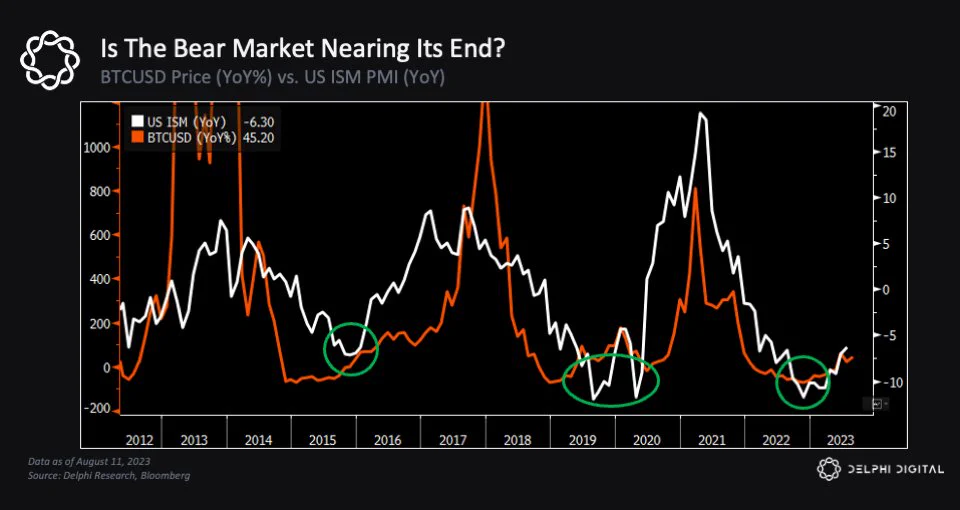
In fact, year-over-year changes in Bitcoin price often show reversal signals near the year-over-year lows of the ISM index. So far, this is exactly what we are seeing this time around...
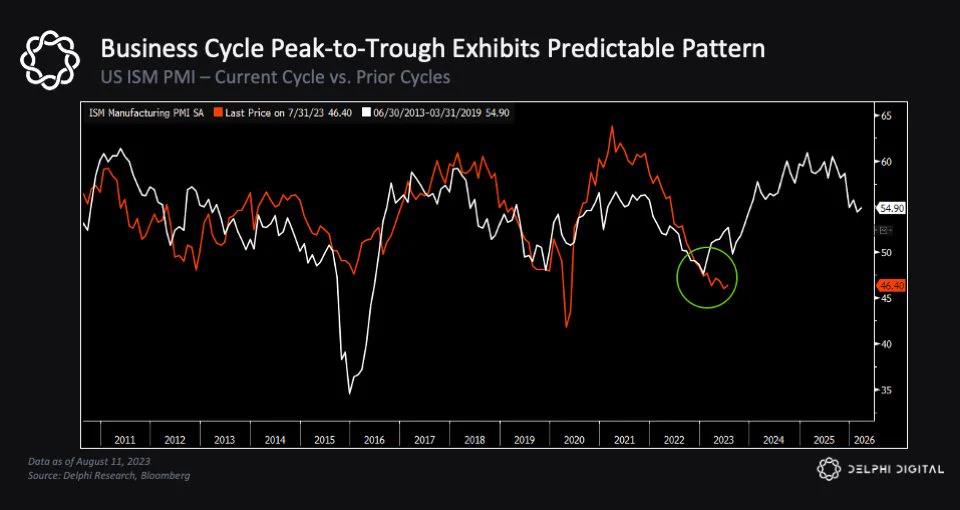
Equally striking is how closely ISM tracks the trajectory of its prior cycle, including the timing of peaks and troughs. This, I believe, is the real key point—every 3.5 years like clockwork, the reshuffling repeats...
This year, higher interest rates, persistent inflation, and recession concerns have led to broad aversion toward risk assets. But markets are forward-looking; before entering this year, equity markets had already priced in a significant slowdown.
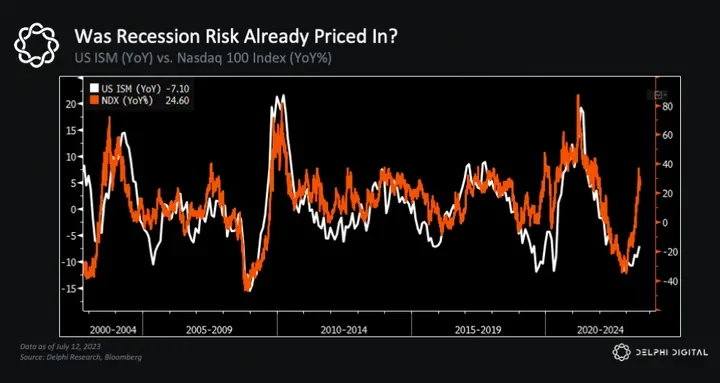
Historically, turning points in the business cycle have often been excellent opportunities to increase risk exposure, and currently, the ISM index appears to be nearing the end of a two-year downtrend—an indication that risk assets are being tested once again...
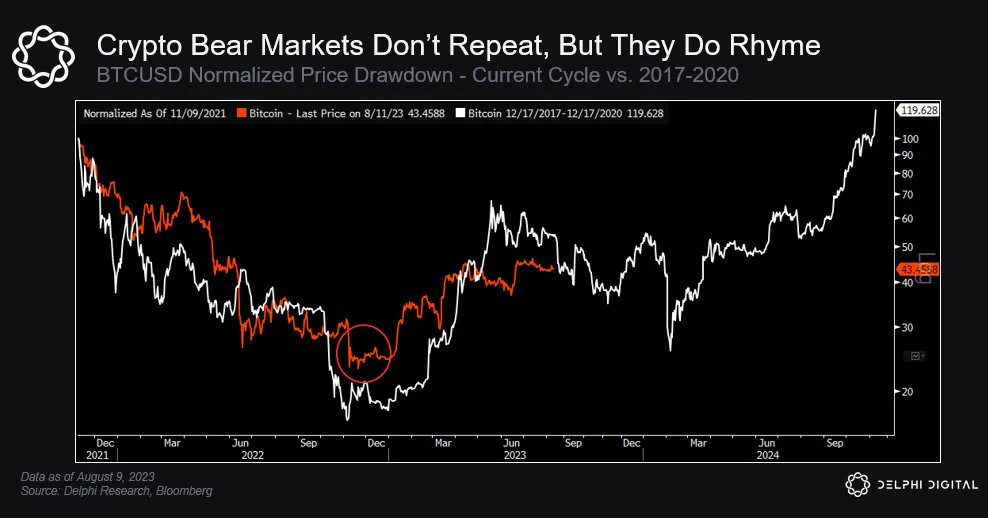
Therefore, I believe we are more likely in an environment similar to 2015–2017, and the more I study the charts, the more convinced I become that this scenario is the most probable.
There are several reasons for this. First, let’s examine market behavior. The S&P 500 (SPX) price action has almost perfectly mirrored the 2015–2017 period, including the timing of the double bottom...

I still remember all the doom-and-gloom predictions during 2015–2016, and the widespread uncertainty at the time.
Risk sentiment deteriorated, earnings were expected to take another hit, and many even called for a much deeper sell-off (even though global equity indices had already entered bear market territory). Fast forward to today—the uncertainty surrounding whether a recession will end the risk-on rally is similarly elevated. But if you look closely, we’ve already been in a profit recession for several consecutive quarters (similar to 2015–2016).

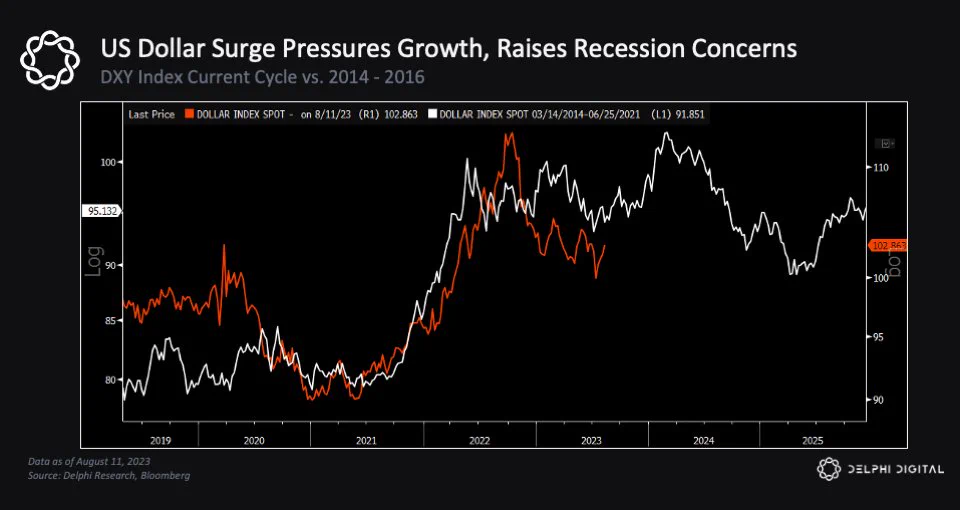
Back then, global economic growth prospects also dimmed, partly due to the strongest rally in the U.S. dollar in 15 years—again resembling what we saw from 2021 to 2022...
Interestingly, gold’s price action also resembles that period. Gold serves as a hedge against currency depreciation and is heavily influenced by shifts in the global liquidity cycle and a weakening dollar.
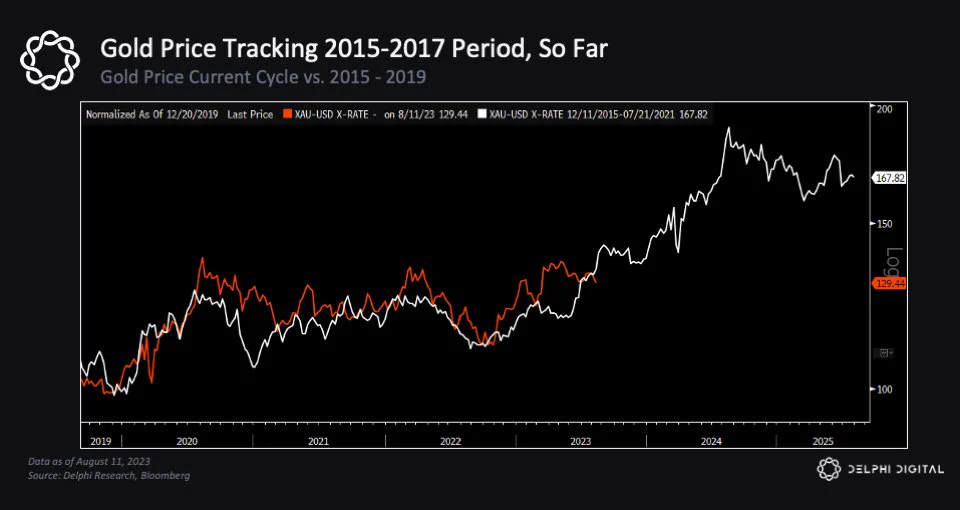
-
Gold peaked in 2014, contracted during 2015–2016, and then resumed its upward trend;
-
Gold peaked in 2021, contracted in 2022, and bottomed in Q4 2022.
...which also marked the bottom for risk assets such as equities and cryptocurrencies.

So what does all this have to do with cryptocurrencies? Everything is connected.
Because cryptocurrency market cycles are tied to broader macroeconomic cycles (as we've noted with the periodic shifts in the business cycle), and the biggest highlight of all this is directly relevant to crypto believers...
The Bitcoin halving is expected in April 2024. The previous two halvings both occurred:
-
Approximately 18 months after Bitcoin’s bottom;
-
About seven months before Bitcoin broke to a new all-time high.
If Bitcoin follows its usual cyclical pattern, this implies a new all-time high by Q4 2024 (and a new cycle high by Q4 2025).
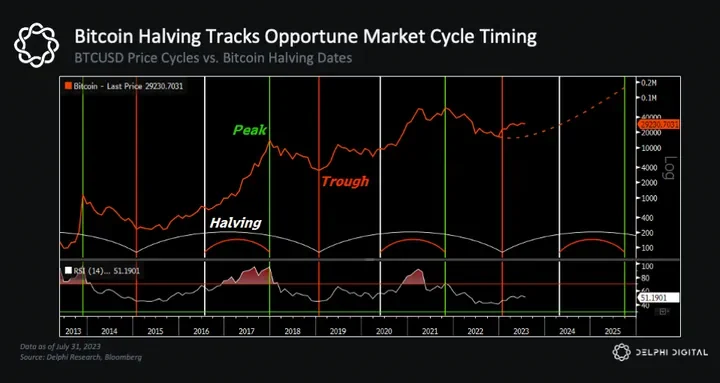
Just like in prior cycles, the timing of the halving couldn’t be better—it will happen at the most favorable moment, following indicators like ISM showing signs of bottoming and aligning with expectations for a rising trend in the new liquidity cycle.
Clearly, I have a bias here, and I can't guarantee everything will unfold as I expect. Maybe I'm wrong, or perhaps it's because I've spent too many hours staring at screens. But the more I look, the more the pieces start to fit together...
That's why I believe market movements will follow a path directionally similar to previous cycles—not by mere coincidence. But a brighter long-term outlook doesn't mean we won't experience further corrections or volatility...
In fact, now may be another period of moderate selling or price consolidation, especially after roughly nine months of strong gains (similar to the second half of 2019).
Another notable risk is a false bottom in the business cycle (like the one we saw in March 2020), or a failure to bottom as quickly as expected.

Over the past 18 months, the cryptocurrency market has wrestled with numerous "heavyweight narratives," but if we look beyond short-term trading and take the perspective I see, the outlook for the next 12 to 18 months is clearly brighter.
Bull market catalysts are accumulating...
Join TechFlow official community to stay tuned
Telegram:https://t.me/TechFlowDaily
X (Twitter):https://x.com/TechFlowPost
X (Twitter) EN:https://x.com/BlockFlow_News


