
Will ETH and BTC Enter a Bull Market? Find the Answer in Supply Analysis
TechFlow Selected TechFlow Selected
Will ETH and BTC Enter a Bull Market? Find the Answer in Supply Analysis
Crypto analyst BEN started with the most fundamental economic concept—the supply curve—to analyze how changes in supply might affect the potential price movements of Ethereum and Bitcoin. Using historical oil price fluctuations as an example, he attempts to reveal the underlying规律 that governs prices through supply and demand dynamics.
Written by: BEN LILLY
Compiled by: TechFlow
When will the bull market return? This is the question everyone wants to ask.
However, there's no definitive answer—but an analytical framework can help us get closer to the right one.
Crypto analyst BEN starts from the most fundamental economic concept—the supply curve—and analyzes how changes in supply could affect the future prices of Ethereum and Bitcoin. Using historical oil price movements as an example, he attempts to uncover the underlying规律—how supply and demand shape prices.
Below is the original article. Is it a futile attempt like "marking the boat to find a lost sword," or an accurate prediction? Perhaps after reading, each of you will have your own answer.
The second half of 2023 will witness a flourishing of various narratives. This happened before in 2020 and 2021 when printing presses ran at full speed due to the pandemic. Of course, the side effect was inflation.
During bull markets, every trader, investor, and participant promotes the narrative that Bitcoin can hedge against inflation. That’s also why many believe in Bitcoin’s long-term upward trend.
But rewind a year earlier—the results weren't ideal. From March to September 2022, inflation rates exceeded 8% month after month... yet during this same period, Bitcoin dropped by 50%.
It turns out that the narrative of Bitcoin as an inflation hedge failed. So what happened?
Well, many experts began changing their tune, claiming instead that Bitcoin is a leading indicator of inflation.
In fact, you can ignore all narratives, macro sentiment, and other factors, and focus on just one key issue—the halving. As we’ll discuss later, many price movements are driven by supply fundamentals.
But today, let’s start with Ethereum.
It underwent the Shanghai upgrade. While this upgrade may seem to have minimal impact on its supply… in the coming months, it could trigger an unexpected supply shock. This might give Ethereum an edge over Bitcoin in Q3 and Q4.
Then we'll turn to what I mentioned earlier—the full range of narratives surrounding Bitcoin toward the end of 2023 and into 2024.
EigenLayer: Supply-Side Impact on ETH Price
I spent over a decade trying to master the "social science" of economics. So when I entered the crypto space about six years ago, I thought I’d be leaving all that behind to explore something entirely new. But it turned out that the supply and demand curves ingrained in me from studying "social sciences" remained deeply embedded.
So when analyzing ETH (and other tokens), I naturally apply supply and demand frameworks, using monetary theory to assess ETH.
EigenLayer is no exception.
To briefly introduce: EigenLayer allows users to use staked ETH to secure other parts of the Ethereum ecosystem. The team believes that re-staking ETH (i.e., so-called “ultra-sound money” or super-linear staking) enhances the productivity of ETH as a token.
-
This is a great idea. First, it reduces the cost for users to participate across multiple sectors of the ecosystem since they don’t need to launch additional services or stake extra ETH.
-
Additionally, it helps projects that want to leverage Ethereum’s robust consensus layer for enhanced security. Early-stage projects often overspend on security by excessively rewarding validators with tokens, even when such high security isn’t needed. This creates oversupply in the market and adds financial strain. EigenLayer offers a powerful solution.
Therefore, it could be a very strong solution in the market. However, when it comes to monetary economic implications, I remain skeptical.
The primary benefit of implementing ultra-sound staking is that users won’t need to buy more ETH to stake into new projects—they can reuse their already-staked ETH.
The following diagrams help illustrate this point.
In the first chart below, the white line represents the total supply of ETH. The purple line beneath shows the ETH supply minus staked ETH. This is one way to view ETH’s “net liquidity.”
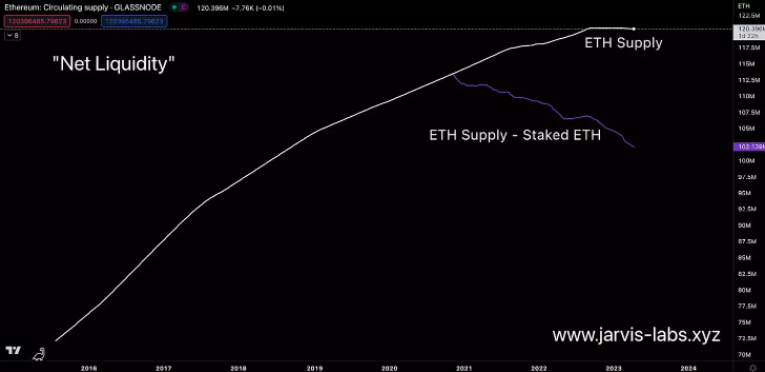
The problem with this approach is that liquid staking derivatives (LSDs) like those offered by Lido, Frax, Rocket Pool, and others effectively make staked ETH liquid again. This means the concept of net liquidity has an inherent flaw from the outset.
Therefore, in the chart below, I’ve included Lido’s LSD—stETH—to recalculate the net liquidity curve of ETH.
As shown, net liquidity is significantly higher. If we add rETH from Rocket Pool and frxETH from Frax, it would be even higher.
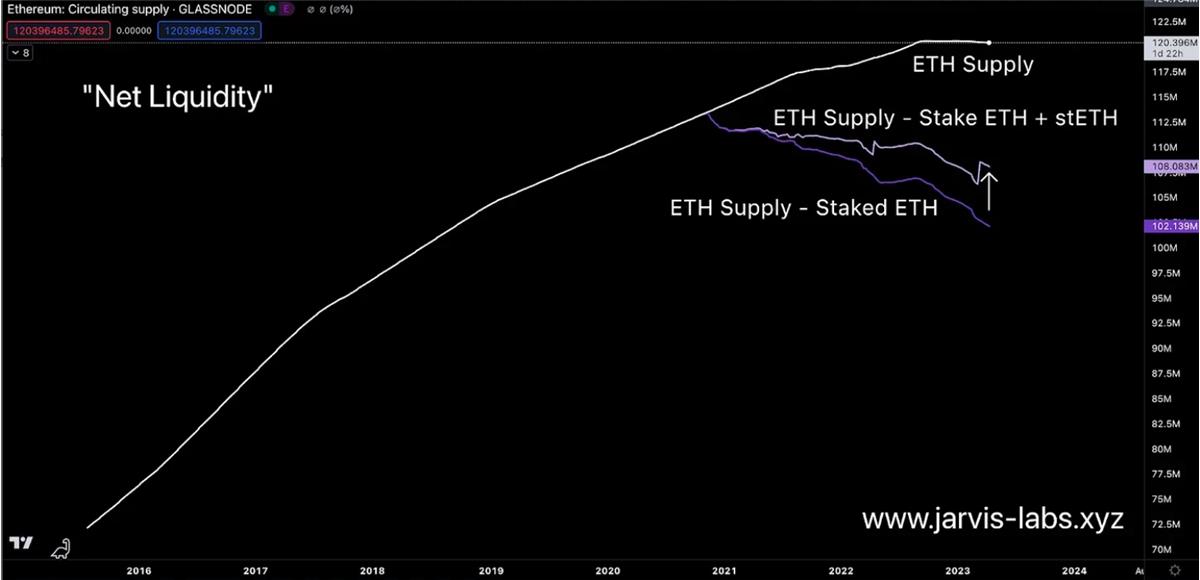
In other words, on the surface, EigenLayer appears to make staked ETH more liquid by allowing reuse of staked ETH.
But in reality, EigenLayer will make ETH supply less liquid than before. Because users will no longer stake ETH via LSDs but instead re-stake through EigenLayer. This means EigenLayer will lead to a decline in net liquidity.
A reduction in market supply leads to stronger price trends. Although EigenLayer may not attract much attention from the crypto market now, once active, we can expect to see a significant improvement in its price fundamentals. We look forward to tracking EigenLayer adoption.
But remember, ETH’s fate is still ruled by the king of the market—BTC. Wherever BTC goes, ETH will follow.
BTC Halving: The Path to a New Bull Market
Having discussed ETH, let’s move on to BTC.
Bitcoin’s next halving is roughly a year away. Each halving reduces the issuance of new bitcoins, creating a supply shock. If we draw a parallel with oil, this is equivalent to extracting less oil from the ground. When oil producers talk about such cuts, market prices tend to rise. Typically, news causes short-term volatility… followed by calm… then a slow, sustained price increase over time. For example, around 1999, global oil supply declined.
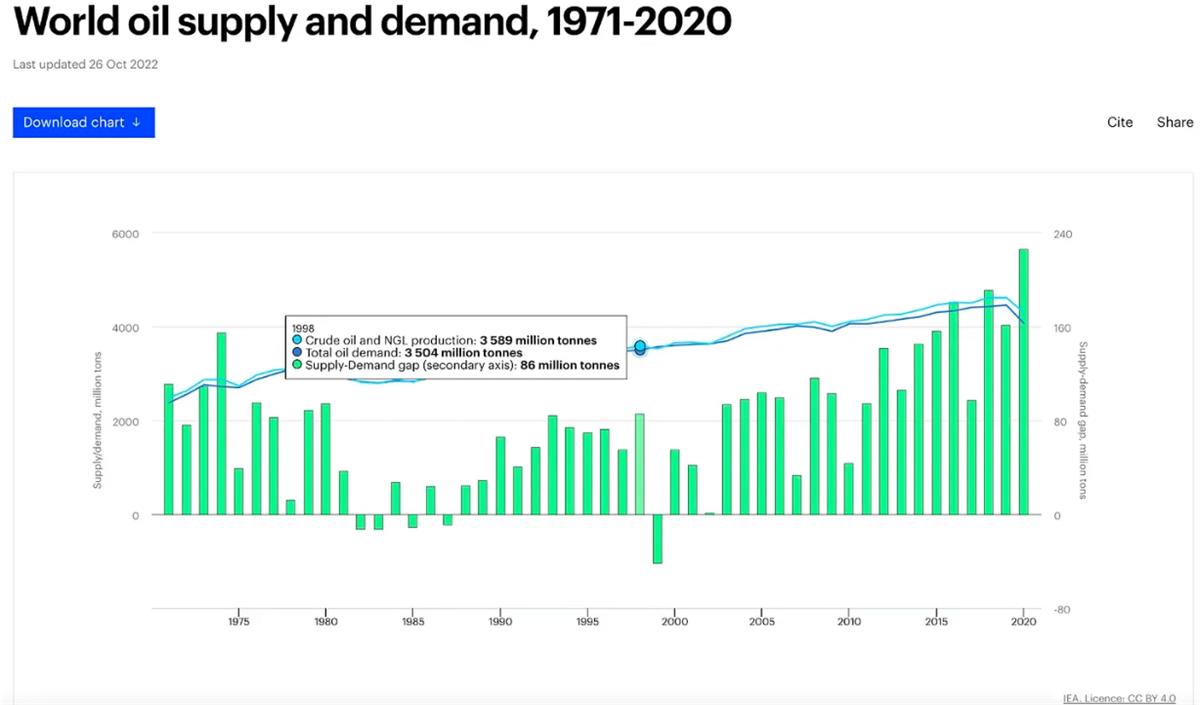
This was due to global production cut agreements announced in March and June 1998. Interestingly, price movements began even before these cuts were implemented. The chart below shows crude oil futures prices, with a red vertical line marking that period. Note the price action around that time—two sharp increases exceeding 20%, indicating market anticipation of reduced oil supply.
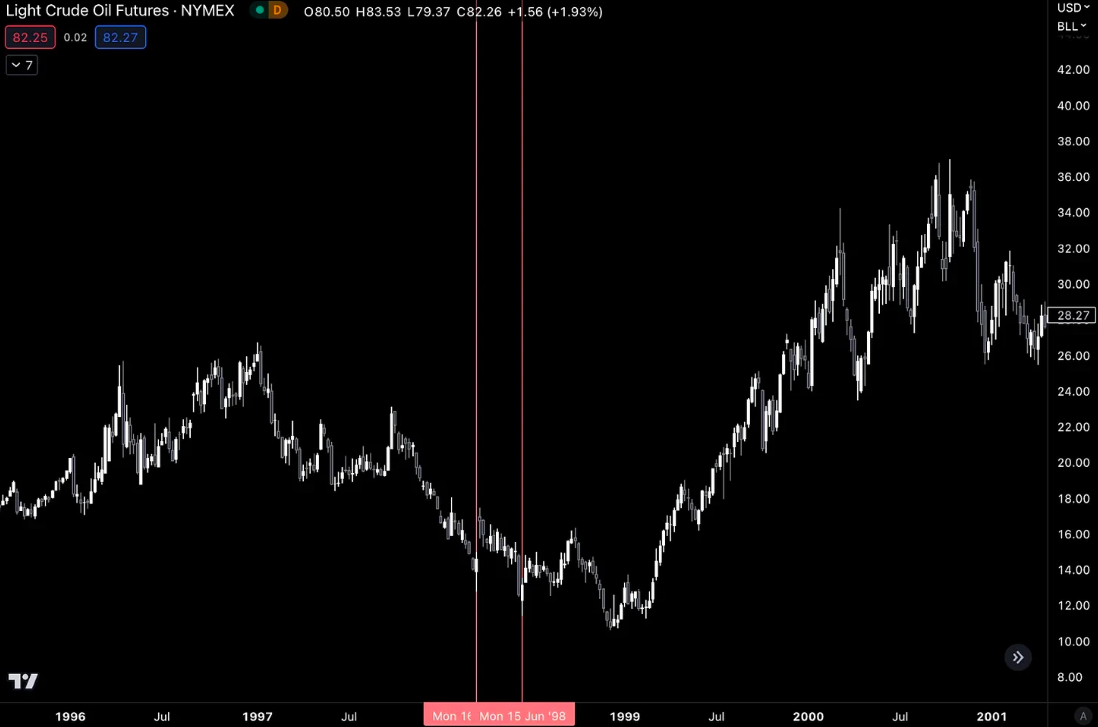
Yet prices continued to fall until 1999. This is because such supply changes take time to reflect in global market prices.
There is a lag between supply reduction and price response, as existing inventory continues to support the market. But once available supply begins to visibly shrink, prices react.
In 1999 and 2000, once the supply reduction became evident to the market, oil prices surged over 200%.
Bitcoin works similarly. The main difference is that its supply reduction is coded into the protocol. This means no press releases are needed—the market knows exactly when it’s coming and can price it in well ahead of time.
History shows that Bitcoin prices typically bottom between 13 and 18 months before each halving event. With the next halving now just 12 months away, according to this pattern, this explains why BTC prices have been rising recently.
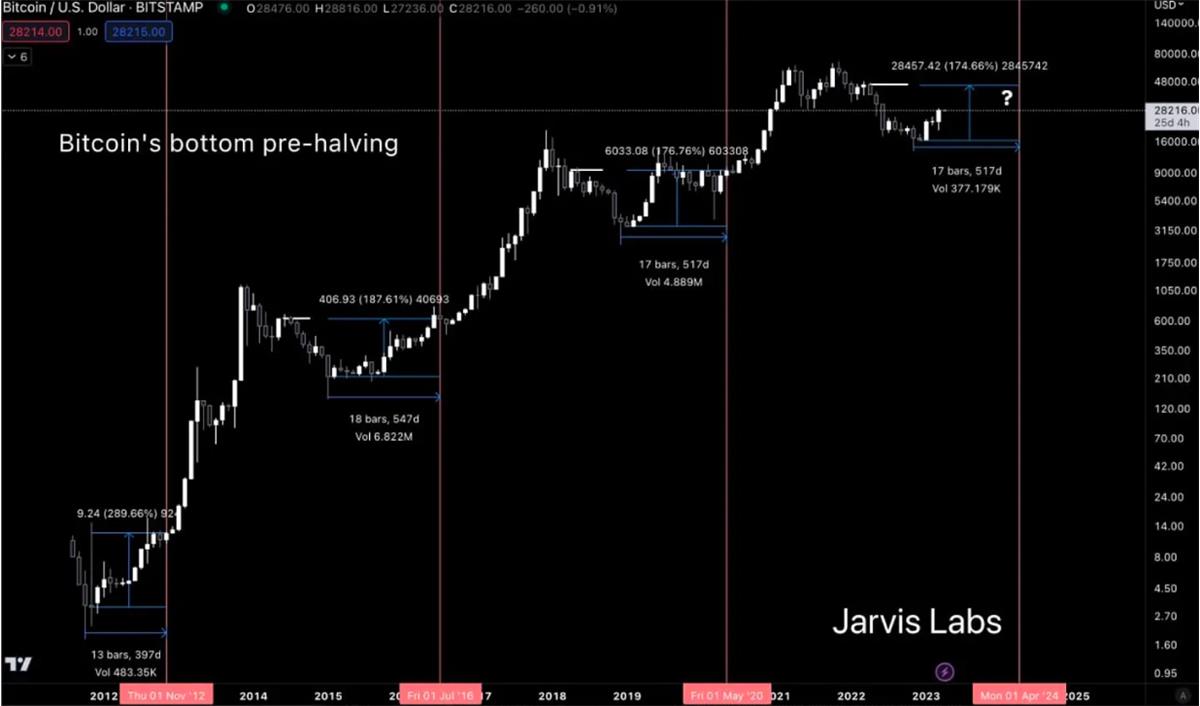
Another important observation is that between the bottom and the halving event, there’s often a period of consolidation—a calm phase that historically provides some of the best buying opportunities.
Join TechFlow official community to stay tuned
Telegram:https://t.me/TechFlowDaily
X (Twitter):https://x.com/TechFlowPost
X (Twitter) EN:https://x.com/BlockFlow_News


