

GameFi Industry Annual Report 2022: Analyzing Market Cap, Trading, User, and Funding Data, a Multi-Dimensional Examination of Web3 Gaming Market Development
TechFlow Selected TechFlow Selected
GameFi Industry Annual Report 2022: Analyzing Market Cap, Trading, User, and Funding Data, a Multi-Dimensional Examination of Web3 Gaming Market Development
Quickly understand the 2022 industry trends—the report covers key metrics such as market capitalization, trading volume, user numbers, and fundraising.
Written by: Gamefi Dash
Compiled by: TechFlow
This report, published by GamefiDash, aims to review the development trends and changes in the GameFi industry in 2022. It covers key metrics including market capitalization, trading activity, user numbers, and fundraising, offering a quick overview of the year’s industry movements.
If you are a developer, investor, or simply interested in this sector, this report is worth your time—approximately five minutes.
Market Capitalization Overview
Historical Review
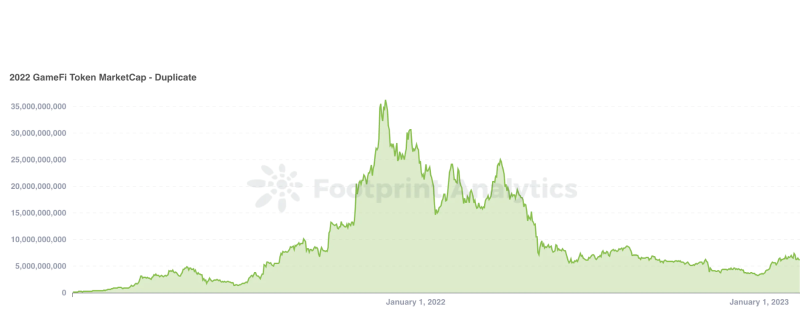
- The GameFi market began growing from early 2021, peaking on December 1, 2021, with a market cap reaching $36 billion.
- Under this trend, 2021 was widely seen as a breakout and expansion year for the GameFi market.
- However, shortly after the peak, the trend started to decline.
2022 Review
- In 2022, the overall GameFi market cap showed a downward trend, declining from $30 billion on January 2.
- The lowest point of 2022 occurred on December 31, with a market cap of $3.36 billion.
- The market lost 89% over the year.
These figures reflect the overall performance of the GameFi market, indicating falling prices for tokens and NFTs. This aligns closely with the broader Web3 market trend.
Trading Overview
Historical Review (Trading Volume)
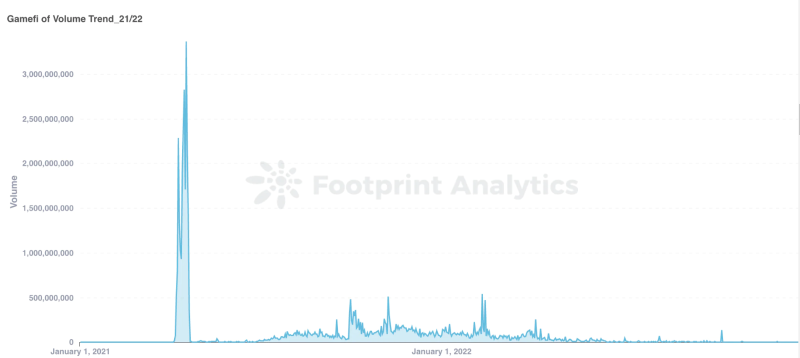
2021 was considered the inaugural year of the GameFi industry. From a market cap perspective, it grew consistently from the beginning to the end of the year. The peak occurred on April 18, with trading volume reaching $3.3 billion.
2022 Review (Trading Volume)
-
Trading volume in 2022 was primarily concentrated in the first two quarters: Q1 at $8.8 billion and Q2 at $2.8 billion. Volumes dropped significantly in Q3 and Q4 to $819 million and $440 million respectively. This trend mirrored the market cap fluctuations during 2022.
-
The highest daily trading volume in 2022 was on February 11, reaching $544 million.
-
The lowest daily trading volume occurred on December 25, at $98.7 million. From peak to trough, the decline reached 99.8%.
However, as explained below, the reduction in trading volume may be largely attributed to falling token prices rather than a drop in transactional activity.
Historical Review (Transaction Count)
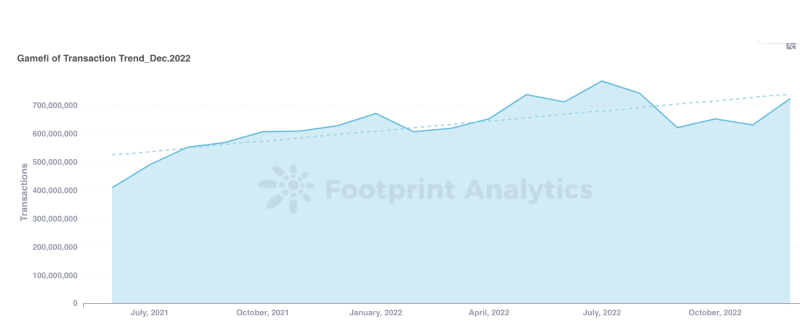
Transaction count reflects the level of market activity and remained high from mid-2021 through the end of 2022. This provided strong confidence that GameFi was a hot sector, attracting significant attention in 2021.
2022 Review (Transaction Count)
-
At the beginning of 2022, the daily transaction count stood at 22.4 million, rising slightly to 22.8 million by year-end.
-
This trend remained relatively stable. The lowest point was on August 9, with 15.3 million transactions, but it rebounded the next day. This dip may have been caused by Dragonma suddenly losing liquidity on Polygon, resulting in its token price dropping over 99%.
-
The peak occurred on May 28, with 28.8 million transactions.
-
All these figures remain higher than the transaction count on April 9, 2021—the day of highest market cap in 2021—when it was 15.6 million.
Throughout 2022, market activity remained robust. This can continue to inspire confidence among investors and developers in the potential of the GameFi market.
User Count / New Users
Historical Review
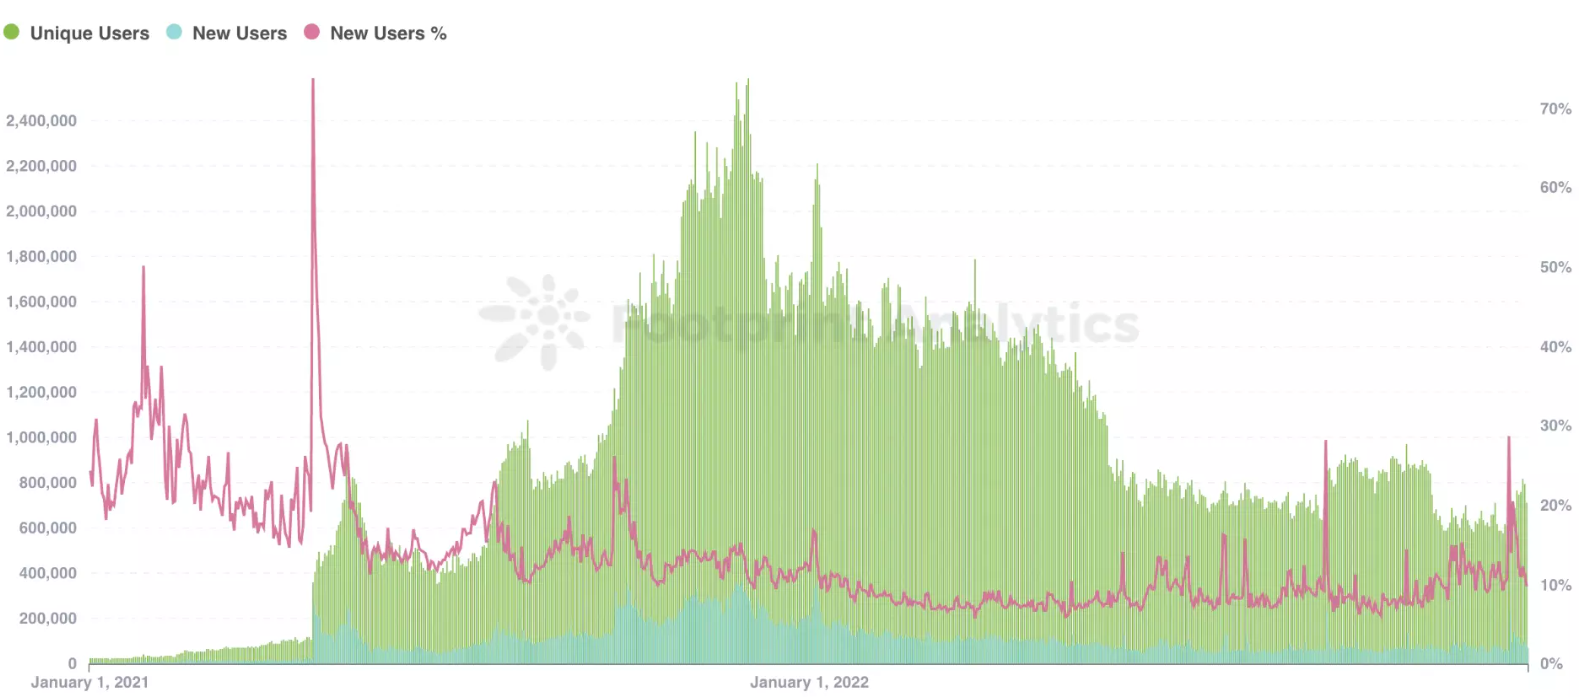
Total users peaked on December 1, 2021, reaching 2.58 million. In contrast, only 27,000 users existed at the beginning of 2021.
The largest single-day increase in new users occurred on April 29, 2021, while the highest growth in early 2022 was observed in January.
2022 Review
-
The highest number of users in 2022 was on January 5, with 2.2 million users. After that, user counts continued to decline, fluctuating between 1.7 million and 590,000.
-
The lowest user count in 2022 was on November 19, with 593,000 users.
-
Two peaks in user count occurred at the end of September and December, likely driven by user growth on Polygon and Ultiverse's Arc8.
-
However, the number of transactions per user steadily increased throughout 2022—from 17.84 transactions per user on January 1 to 30.48 on December 31.
-
On the other hand, due to the declining market cap, the transaction value per user dropped from $60.3 on January 1 to just $1.9 on December 31, 2022.
Number of Games and Investment Trends
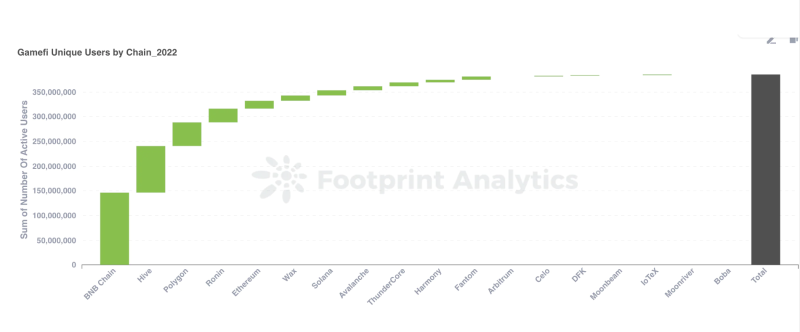
-
In 2022, BNB Chain had the most users (145.9 million), followed by Hive (94.6 million) and Polygon (47.8 million).
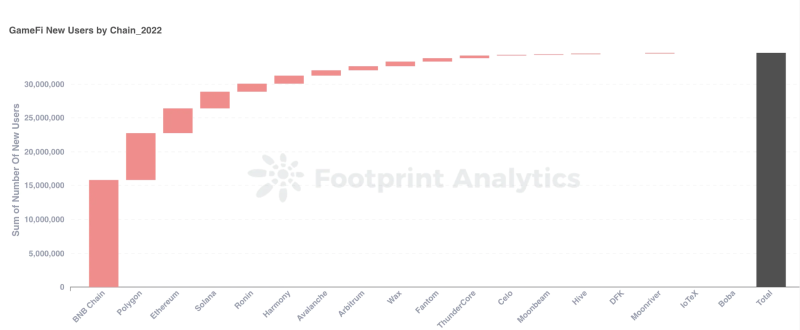
-
For new users, BNB Chain ranked first (15.7 million), followed by Polygon (6.96 million) and Ethereum (3.62 million).
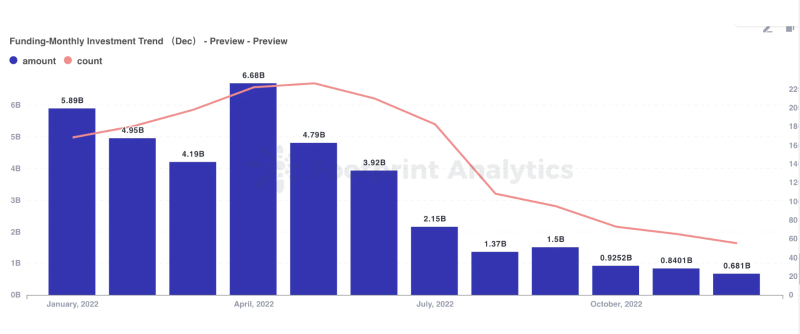
-
Overall Web3 funding amounts declined throughout 2022, from $5.89 billion in January to $671 million in December.
-
The highest monthly funding occurred in April 2022, totaling $6.68 billion.
-
The number of funding events followed a similar trend to total funding amounts.
-
January saw the highest number of funding rounds, while December recorded the fewest.
Conclusion
In summary, compared to 2021, the 2022 market showed a downward trend, particularly in terms of market capitalization, user numbers, and GameFi fundraising activities. This period is widely regarded as the "bear market" of 2022.
Nevertheless, there were also positive signals in the data. For instance, total transaction counts remained stable, and the number of transactions per user increased by over 70% from the beginning to the end of 2022. Additionally, notable user growth toward the end of 2022 provides room for optimism about the market outlook in 2023.
Join TechFlow official community to stay tuned
Telegram:https://t.me/TechFlowDaily
X (Twitter):https://x.com/TechFlowPost
X (Twitter) EN:https://x.com/BlockFlow_News


