
Bankless: Five On-Chain Signals That the Crypto Market Has Bottomed
TechFlow Selected TechFlow Selected
Bankless: Five On-Chain Signals That the Crypto Market Has Bottomed
Inflation is declining, the Federal Reserve appears to be becoming less hawkish, and global conflicts may have slightly eased.
 Navigating Web3 tides with focused insights
Written by: Jack Inabinet
Translated by: TechFlow
In November, the dominant theme in crypto has been anxiety about its fate: a top-three cryptocurrency exchange valued at $32 billion in June collapsed overnight; a major crypto lending platform also failed.
Yet, ETH did not make a new cycle low!
Despite market turmoil, crypto's surprising resilience prompts us to revisit an old question: have we bottomed yet?
Inflation is cooling, the Fed appears less hawkish, and global tensions may ease slightly.
So, what on-chain evidence supports this bullish case?
Today we’ll examine five on-chain signals indicating a "bottom."
1. Rising Yields
Since hitting a bottom on June 9, total yields in DeFi have been rising.
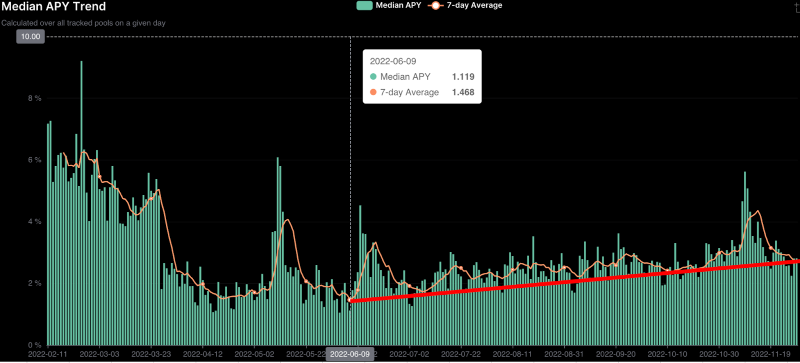
Ethereum reached its cycle low about a week and a half later, on June 18.
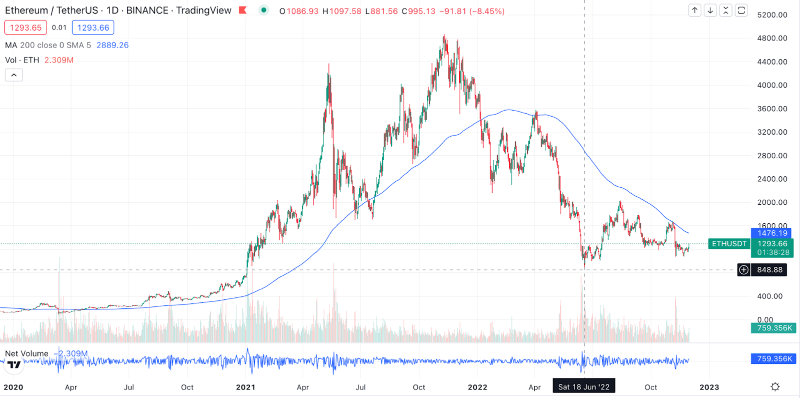
The yield increase from June 9 to 18 reflected growing demand for borrowing crypto assets as users opened short positions. Afterward, the seven-day moving average yield peaked locally on June 19.
Unlike traditional financial markets—where yields on debt instruments like mortgages, commercial paper, or Treasuries are primarily driven by macroeconomic interest rate conditions and the Fed’s rate targets—crypto yields are driven by asset demand.
Higher DeFi yields are typically associated with higher crypto asset prices.
Why?
Individuals and institutions mainly borrow to gain leverage or execute market-making and other yield-generating strategies. Higher yields mean borrowers are willing to pay more for capital, suggesting overall better capitalization among borrowers.
Moreover, rising borrowing yields suggest that borrowers are shifting toward riskier investment approaches, which benefits risk assets like cryptocurrencies.
2. Rebalancing of Curve Pools
Remember when FTX collapsed and Alameda was reportedly shorting USDT, causing it to break its peg?
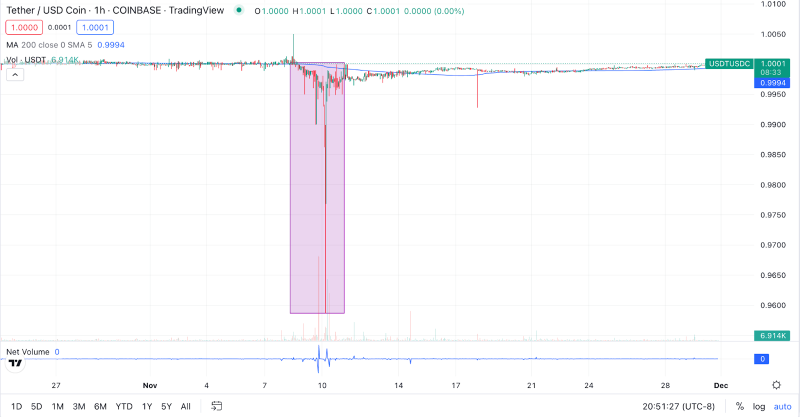
That move by Alameda and the resulting capital flows reduced demand for USDT while increasing its supply, pushing the peg below $1.
Due to this sudden supply-demand imbalance, the ratio of USDT in Curve’s 3Pool—the most important and liquid stablecoin swap pool in decentralized finance—began increasing relative to DAI and USDC.
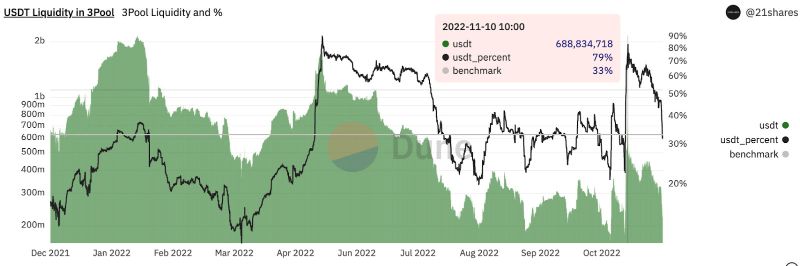
Increased supply from shorting activity, selling pressure from affected holders, and lack of demand to absorb the excess supply caused USDT’s share in the 3Pool to rise.
During sharp market declines, stablecoin balances often deviate from their ideal 1:1:1 target levels among USDT, USDC, and DAI. Recently, inflows into USDT have brought the pool back toward equilibrium: 38% of Curve’s 3Pool is now USDT, with USDC and DAI each making up 31%. The stabilization of Curve’s 3Pool, especially after extreme volatility, signals renewed confidence in major stablecoins.
As a barometer of fear within the industry, the rebalancing of USDT holdings in the 3Pool is a bullish on-chain signal.
Although the ratios between USDT, USDC, and DAI in the 3Pool remain subject to rapid fluctuations, their stabilization suggests market expectations of calmer or even positive conditions ahead.
3. Negative Funding Rates with Stable Prices
Funding rates keep perpetual futures prices aligned with the spot price of the underlying asset.
When short positions dominate, perpetual contracts trade below the spot price of the asset. In this case, short traders pay longs via funding rates.
When futures prices exceed spot prices, longs pay shorts through funding rates. This mechanism encourages the instrument to track the asset’s spot price.
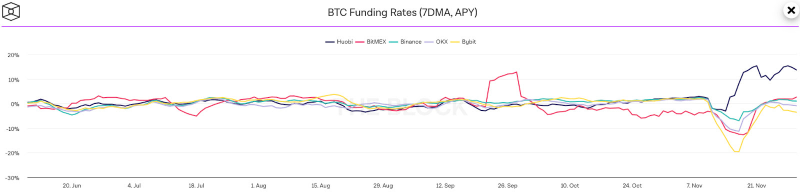
Throughout November, BTC funding rates across all major exchanges tracked by The Block were largely negative. Generally, positive funding rates imply bullish sentiment, while negative ones indicate bearish behavior.
However, persistent negative funding rates combined with stable market pricing offer hope for bulls, signaling resistance to further downside despite unusually high selling pressure in crypto.
4. Volatility Normalization
After peaking at 126.02 on November 9 during the FTX collapse, the Crypto Volatility Index (CVI)—crypto’s counterpart to TradFi’s VIX, which tracks the S&P 500—has declined to a baseline level of 80.71.
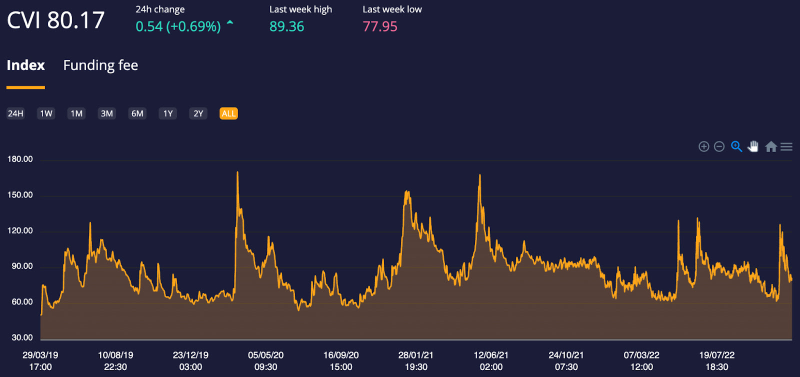
Like the VIX, elevated CVI levels usually correlate with adverse market conditions. Today’s CVI reading resembles levels seen in June–July when ETH formed a potential cycle bottom.
Reduced volatility and uncertainty are necessary for a market bottom. Low CVI readings confirm this decline in volatility.
If a true bottom forms, we’d expect CVI to continue falling, as it did prior to November 7.
5. Declining Stablecoin Holdings Among Smart Money
Smart money’s allocation to stablecoins peaked at 38% on November 9 but has since declined.
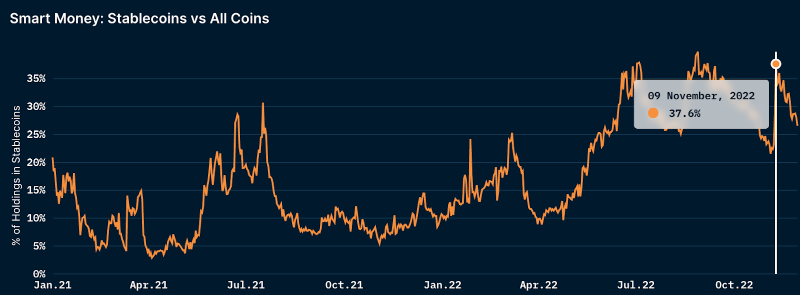
For the remainder of November, smart money shifted from high stablecoin concentration to today’s levels. Currently, stablecoins account for 27% of smart money wallet balances.
Just as stablecoin holders sell Tether when confidence wanes, crypto investors turn to stablecoins when the future value of crypto assets is questioned.
Holding stablecoins allows crypto investors to reduce risk and limit potential portfolio drawdowns, while keeping capital on-chain so whales can easily redeploy funds when market conditions improve.
Although stablecoins still dominate smart money portfolios—as they did in April when ETH rebounded to $3.5K, before dropping below 9%—smart money typically reduces stablecoin exposure before a bottom fully forms. Currently, this metric is trending into bullish territory.
Join TechFlow official community to stay tuned
Telegram:https://t.me/TechFlowDaily
X (Twitter):https://x.com/TechFlowPost
X (Twitter) EN:https://x.com/BlockFlow_News