








Insight into the True State of the Web3 Industry in 2022 Through Data Visualization
TechFlow Selected TechFlow Selected
Insight into the True State of the Web3 Industry in 2022 Through Data Visualization
Overall, the crypto ecosystem is facing a winter, but the author sees it as a dormancy before spring.
 Navigating Web3 tides with focused insights
Author: Tomasz Tunguz, VC at Redpoint
Translation: TechFlow
This article is based on Tomasz's presentation materials shared at Dunecon this month, using tools such as Dune and Tokenterminal for data analysis, covering multi-dimensional data including wallet activity, DEX/CEX user counts, NFT trading volume, and L2 ecosystems.
TechFlow has compiled and translated the materials, while also presenting and interpreting additional valuable data not included in the original text.
Key Insights / Takeaways:
1. There are 2.5 million active wallets daily on web3, with Binance, Solana, Polygon, and Ethereum wallets accounting for over 80% of these daily active users.
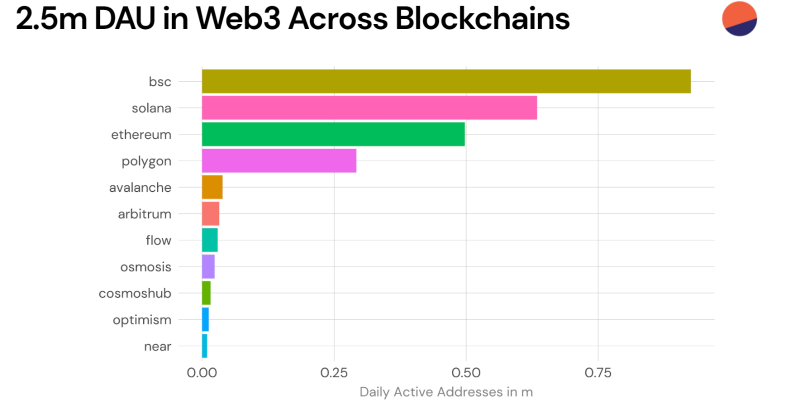
Interpretation: What does 2.5 million daily active users mean? For comparison, consider Apple Pay—the most popular digital wallet outside China. Public data shows that Apple Pay had 500 million total users in 2020. Even under the unreasonable assumption that only 1% were active, Apple’s wallet would still have had 5 million active users two years ago.
Polite version: Huge breakout potential. Blunt version: Still very small user base.
2. Centralized exchanges manage 90 million active wallets, yet Coinbase’s trading volume has dropped by 60%.
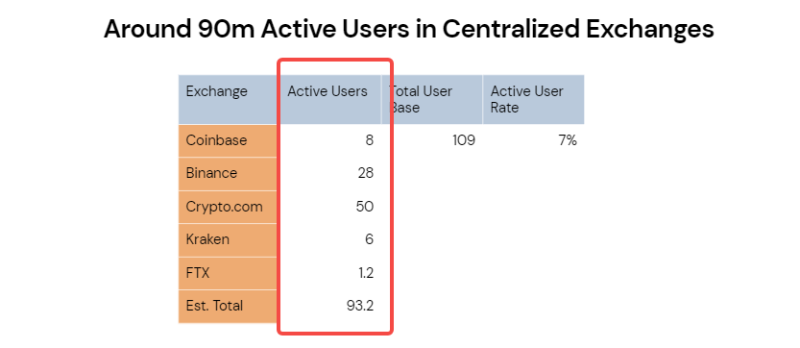
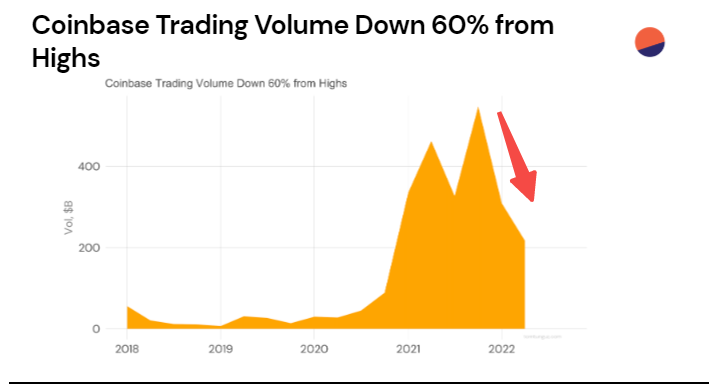
Interpretation: Large CEXs may be too big to fail, but crypto-savvy users are too easy to flee.
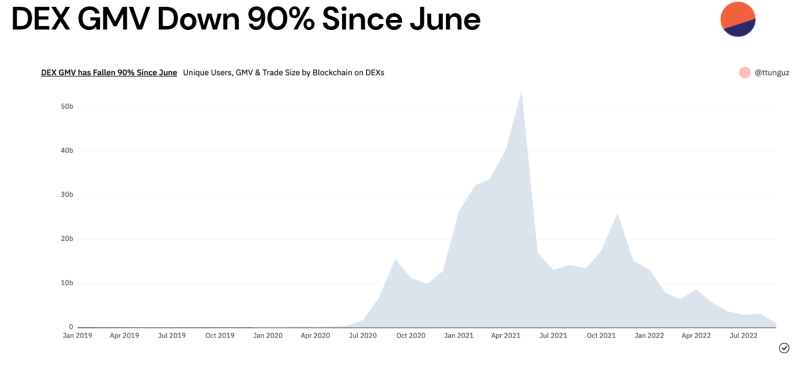
3. The average trade size on DEXs has declined from $8,000 to $1,400.
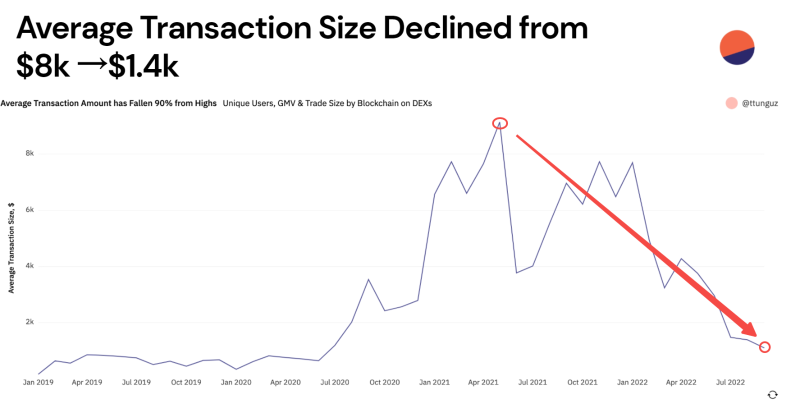
Interpretation: Consistent with CEX trends—shrinking trading volume. Another chart shows that DEX website transaction value (GMV—a metric commonly used in e-commerce to gauge market heat) has fallen 90% since June last year, indicating an even more severe situation.
4. Comparing CEX and DEX, their revenue growth rates show a certain correlation.
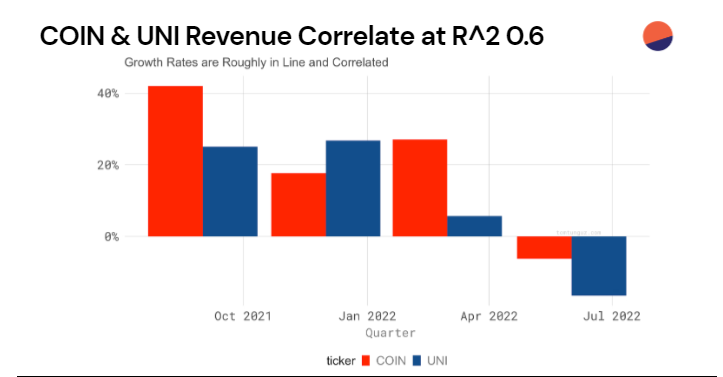
Interpretation: Red represents Coinbase, blue represents Uniswap; the bars indicate revenue growth rate. Both move in tandem—positive or negative—and turned negative in July. The statistical R-squared correlation coefficient is 0.6, indicating a moderate positive correlation.
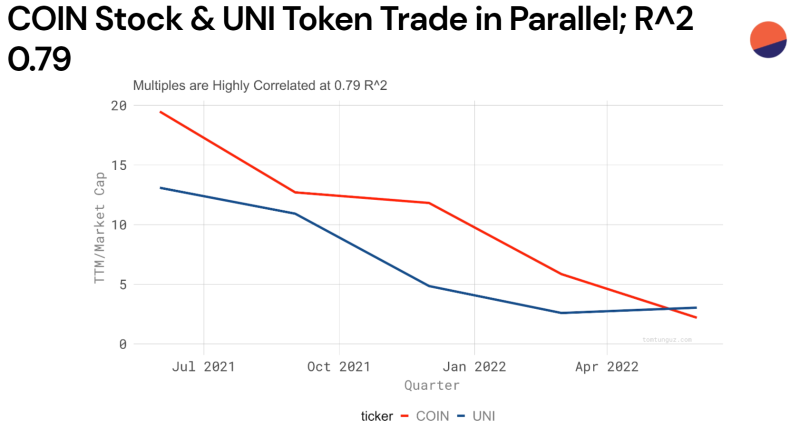
More interestingly, both Coinbase's stock market cap and UNI's token market cap have been declining, with a correlation coefficient approaching 0.8. Perhaps capital markets have already sensed the coming winter—both traditional finance and crypto.
5. NFT trading volume has dropped 97% from its peak.
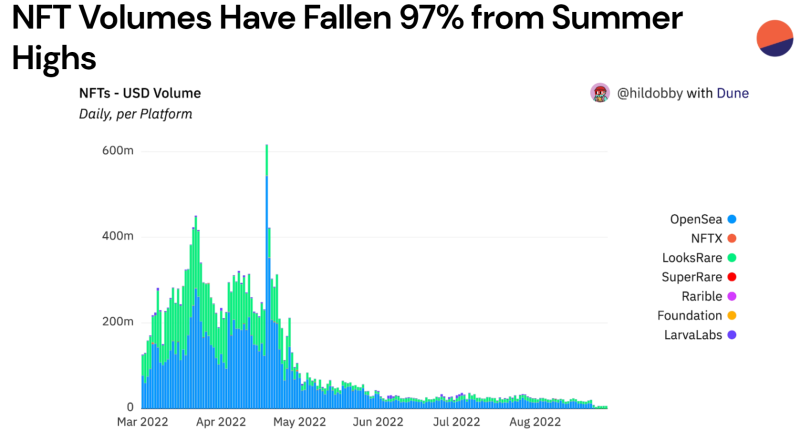
Interpretation: A well-known macro trend. But the data visualization makes it clearer: the once towering blue bar representing Opensea is now nearly invisible. Also, today’s rising "gold farming" projects might just be survivors suffering from selection bias.
6. 40% of NFT buyers use Solana. The average Solana NFT is worth 10% of the average Ethereum NFT.
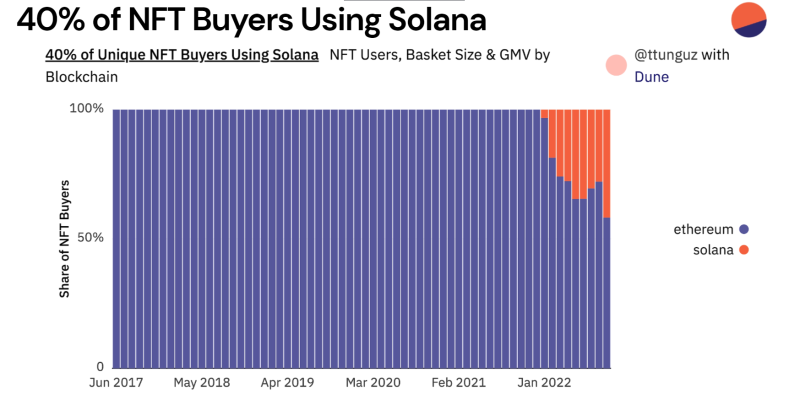
Interpretation: Pay attention to NFTs on Solana. In a severely contracted market, high-value NFTs suffer from poor liquidity and harder turnover. Therefore, relatively cheaper NFTs on Solana may offer more speculative opportunities.
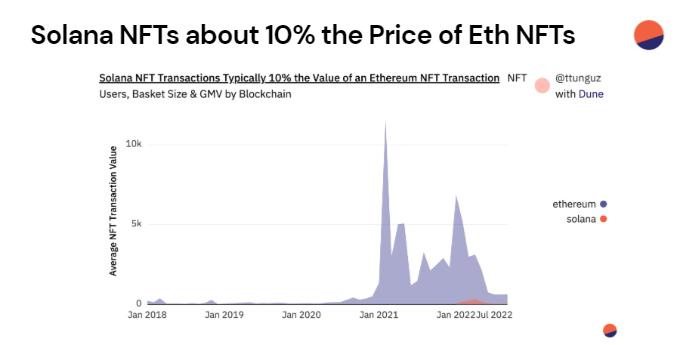
7. L2s (Arbitrum & Optimism) account for 30–40% of all Ethereum transactions but consume only 2% of total gas, reinforcing their value proposition.
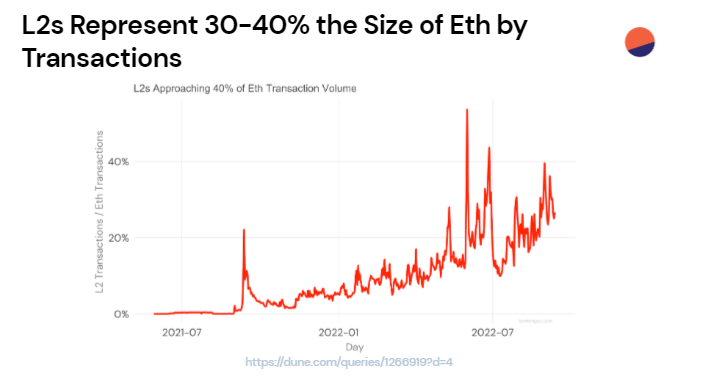
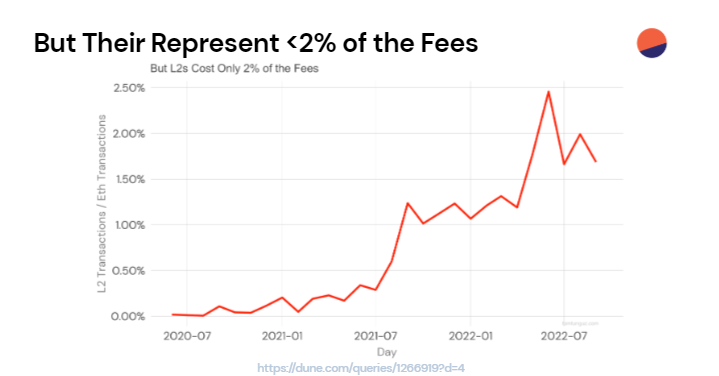
Interpretation: The value of L2s has long been debated. From a metrics standpoint, things look promising. But we should also examine what kinds of transactions occur on L2s—are there signs of artificial volume inflation?
8. $250 million flows into L2s every month.
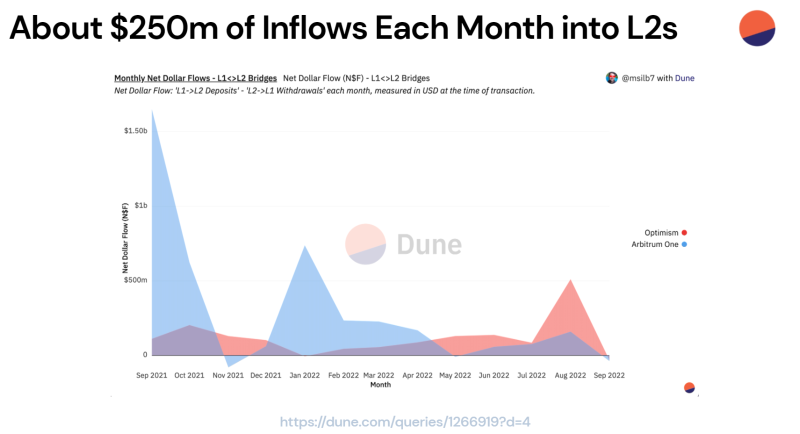
Interpretation: This figure is calculated by subtracting total withdrawals from L2 to L1 from total deposits from L1 to L2, resulting in a net inflow of $250 million. Following up on the previous question: Is much of this capital chasing yield farming incentives or other short-term gains?
9. Thanks to Flashbots' searchers, MEV (Maximal Extractable Value) has gradually decreased. Lower MEV means users pay less in transaction fees, as markets become more efficient.
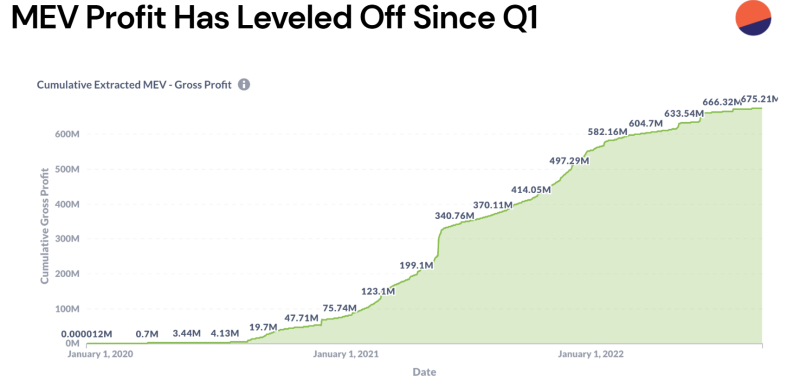
Interpretation: MEV (Maximal Extractable Value) is an abstract concept for most users, so we won’t dive deeper here. But from the chart, the y-axis shows cumulative MEV net profit. As time (x-axis) progresses, the slope of growth is flattening—meaning validators (or miners) extract less MEV per unit of time.
10. Developers deploy approximately 300,000 smart contracts to Ethereum each month—a number that has remained flat over the past five months. Around 5,000 developers push code to Web3 weekly, down 20% from the beginning of the year. This number needs to increase significantly for the ecosystem to thrive.
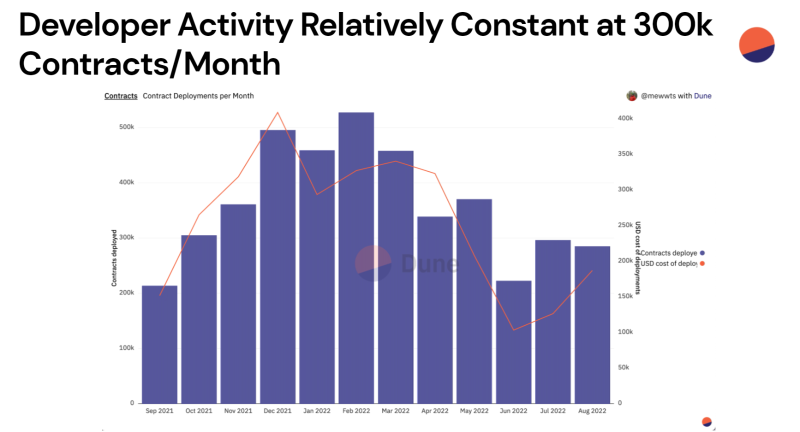
Interpretation: At the development layer, the 300,000 monthly smart contracts may include redundant builds and copycat projects. We suggest focusing more on code quality and community recognition metrics—such as GitHub stars and forks.
11. Web3 valuation multiples are increasingly correlated with revenue. The investor community has matured in understanding how to evaluate Web3 companies. This milestone will begin reshaping valuations in both early and late-stage private markets.
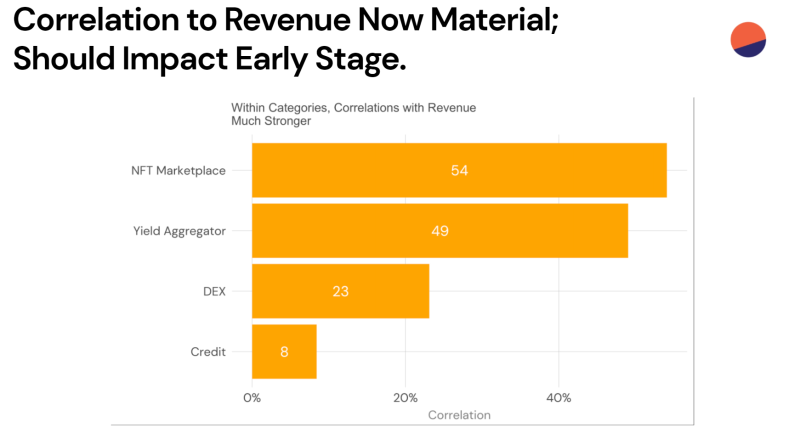
Interpretation: Protocol or project revenue is becoming increasingly important to investors. The recent hype around “real yield” narratives may be evidence of this shift—investors are placing greater emphasis on sustainable, revenue-generating projects.
Overall, the crypto ecosystem is facing a winter—but the author sees this as dormancy before spring.
Over the past few years, we’ve seen an explosion of innovation, and we’re now absorbing and implementing the best use cases these innovations can offer.
Note: Most of the data mentioned in this article can be found on Dune. The full data-driven PPT is available here.
Join TechFlow official community to stay tuned
Telegram:https://t.me/TechFlowDaily
X (Twitter):https://x.com/TechFlowPost
X (Twitter) EN:https://x.com/BlockFlow_News






