The bear market has lasted 400 days. How much longer does BTC have to endure?
Author: Biteye
On November 15, BTC hit a low of $62,006, nearly halving from its historical peak last October.
How brutal was this downturn? Even Yi He shared her account performance on the Binance Square, revealing assets shrinking by over $100 million in the past 30 days.
As prices continued to fall, pessimism spread across the market. Some believe BTC has already approached a bottom, while others fear even deeper declines ahead.
So, where exactly are we in this bear market? How far is the next bull run? This time, we will try to find answers from three perspectives: the reasons behind the decline, historical patterns, and the current market environment.
Why Has BTC Kept Falling?
Faced with the continuous downtrend, CZ also published a post summarizing several potential triggers for the BTC decline:
1. Continuous withdrawal of ETF funds: As of November 13, US spot BTC ETFs experienced net outflows of approximately $1.91 billion for seven consecutive trading days, and ETH ETFs also saw capital fleeing.
2. AI sector absorbing market liquidity: With Anthropic preparing for an IPO, markets speculate that some investors are selling BTC and other assets to free up capital for US stock market IPOs.
3. Phased macroeconomic pressure: Rising US inflation has led markets to bet on renewed Fed rate hikes. The resulting strength in US Treasury yields and the dollar are weighing on risk assets like BTC.
4. Security incidents eroding holder confidence: Security breaches at several centralized platforms, along with wallet and browser vulnerabilities, have reduced investors' willingness to hold crypto assets.
5. Political and regulatory uncertainty: Following the US midterm elections, markets are growing concerned about the possibility of tighter crypto regulations.
In addition, there are three structural factors worth noting:
1. Growing anxiety over CEX security: As Yi Lihua previously pointed out, hacking techniques are continuously evolving in the AI era, placing sustained severe strain on the security defenses of centralized exchanges.
2. High-yield stablecoin wealth management diverting risk appetite: Currently, stablecoin yield products offered by several major platforms are highly attractive. Investors can lock in near 10% annualized risk-free returns by allocating funds to high-interest quotas, significantly diverting their willingness to hold volatile assets.
3. Long-term concerns from AI and quantum computing: Justin Sun previously mentioned in an interview that breakthroughs in AI algorithms and future quantum threats (Q-Day) could challenge the foundations of existing asymmetric cryptography. The market has yet to fully digest this long-term potential risk.
Where Exactly Is This Bear Market?
Looking back at the past three complete BTC bear market cycles:
· 2013 cycle: Dropped approximately 85% from its peak, taking 406 days to hit bottom;
· 2017 cycle: Dropped approximately 84% from its peak, taking 364 days to hit bottom;
· 2021 cycle: Dropped approximately 77% from its peak, taking 366 days to hit bottom.
From a statistical perspective, the past three major bear markets essentially required a bottoms-building period of about one year to fall from their historical peaks to their ultimate lows.
This cycle's BTC peaked in October 2025, and the current correction period has already exceeded 13 months. By temporal measurement, we have practically entered a window where historical bear markets have a high probability of forming cyclical bottoms.
How Much Longer Until We Exit the Bear Market?
As the analyst Wizard (@0xcryptowizard) stated, regardless of whether there are a hundred reasons to be bullish or a thousand to be bearish, when facing future price action, everyone remains merely an ordinary participant unable to foresee the outcome.
Since no one can precisely anchor the absolute bottom, we might as well look for patterns in the evolutionary logic of historical bull and bear cycles to serve as a reference for current market analysis.
Halving Cycle Indicators
BTC has undergone four halvings in history, occurring in 2012, 2016, 2020, and 2024, with an interval of approximately four years between each.
Reviewing the past three cycles, BTC initiated clear recovery trends approximately 272, 404, and 462 days before the halving, respectively, with all three turning points occurring significantly prior to the event.
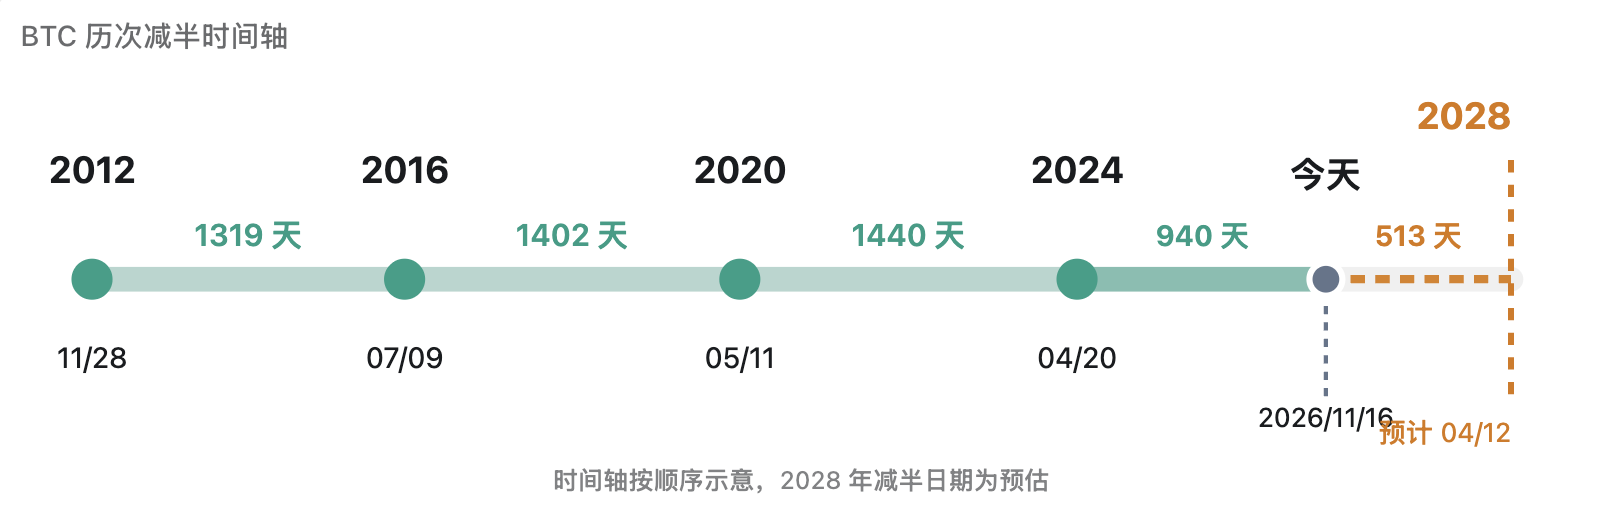
Chart: Comparison of BTC Historical Halving Cycles and Recovery Rhythms
If this historical rhythm continues, this cycle's BTC may welcome a new wave of sustained recovery between January and July 2027, leaving roughly a 2-to-8-month window from the present.
Midterm Election Indicators
Historical experience shows that after the dust settles on US midterm elections, US stocks often see strong performance. BlackRock's statistics indicate that since 1970, the S&P 500 index has averaged a gain of approximately 14.1% in the six months following midterms.
Looking at BTC's past three bear markets, the bottoms in 2015, 2018, and 2022 all occurred within 1 to 71 days after the conclusion of the US midterm elections.
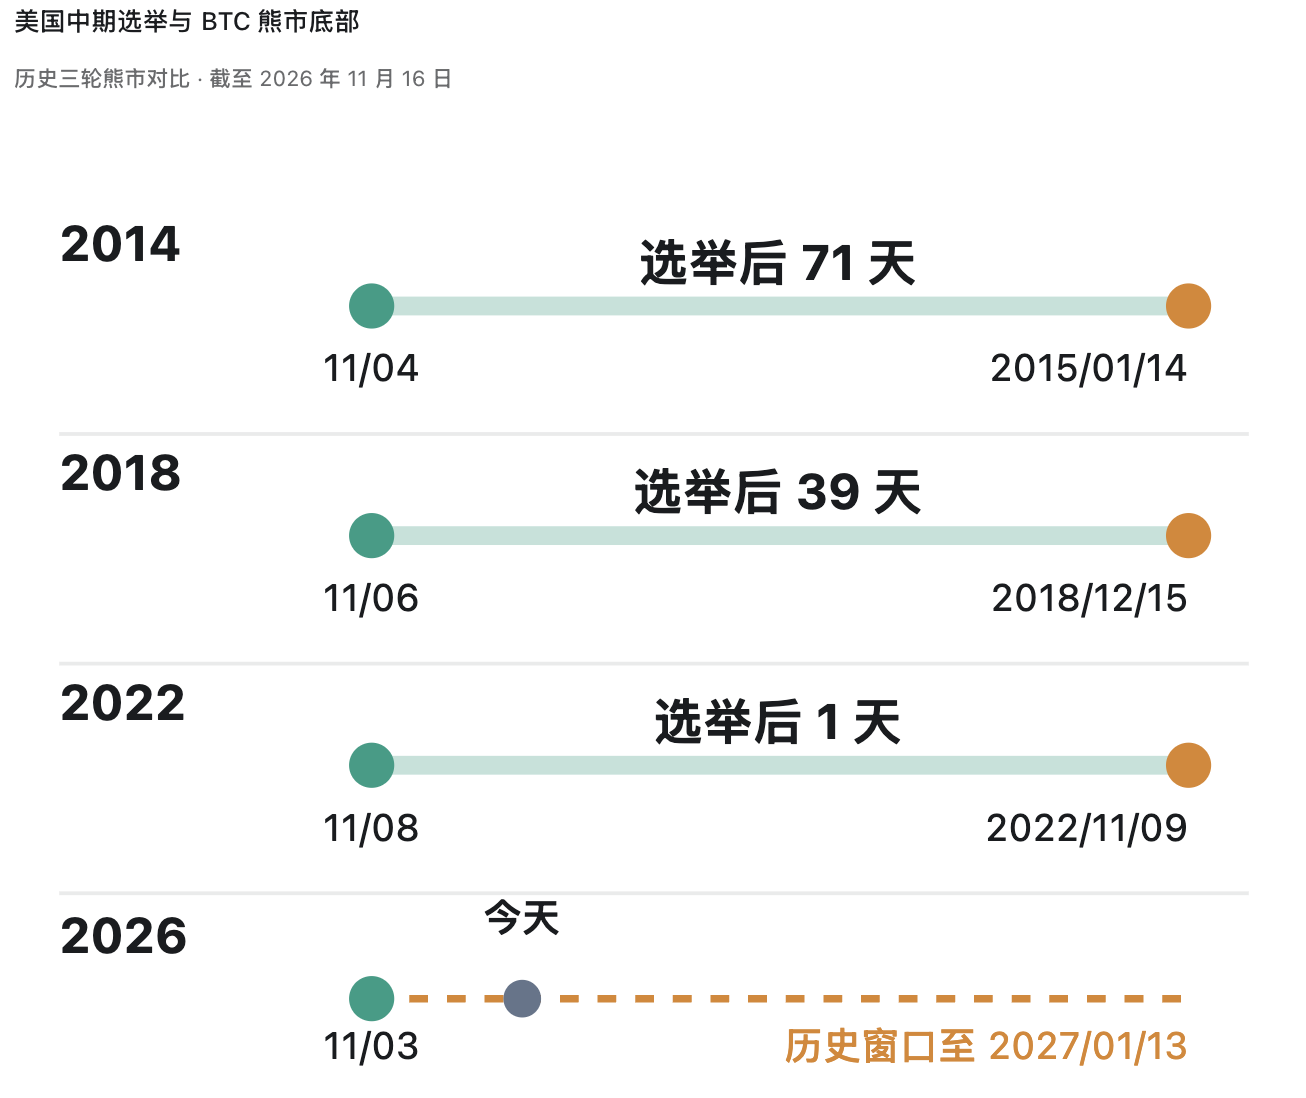
Chart: Relationship Between Past US Midterm Elections and BTC Bottom-Timing
With the midterms concluded, uncertainties surrounding taxation, regulatory policies, and fiscal spending are gradually fading, making capital markets' expectations for future policy directions increasingly clear.
Global M2 Liquidity Cycles
Global M2 serves as the core barometer for measuring macro monetary liquidity. In historical reviews, the expansion of global M2 often resonates highly with BTC's upward moves, as the enlargement of the monetary reservoir drives incremental funds to spill over into the crypto ecosystem.
Currently, global M2 generally maintains an expansionary trend, primarily driven by currency supply growth in major economies such as China and the US. Among them, US M2 grew 5.7% year-over-year, with bank credit and deposit creation remaining key drivers of monetary expansion.
Research by Coinbase indicates that cyclical turning points in global M2 typically lead BTC by about 110 days (i.e., 3 to 4 months).
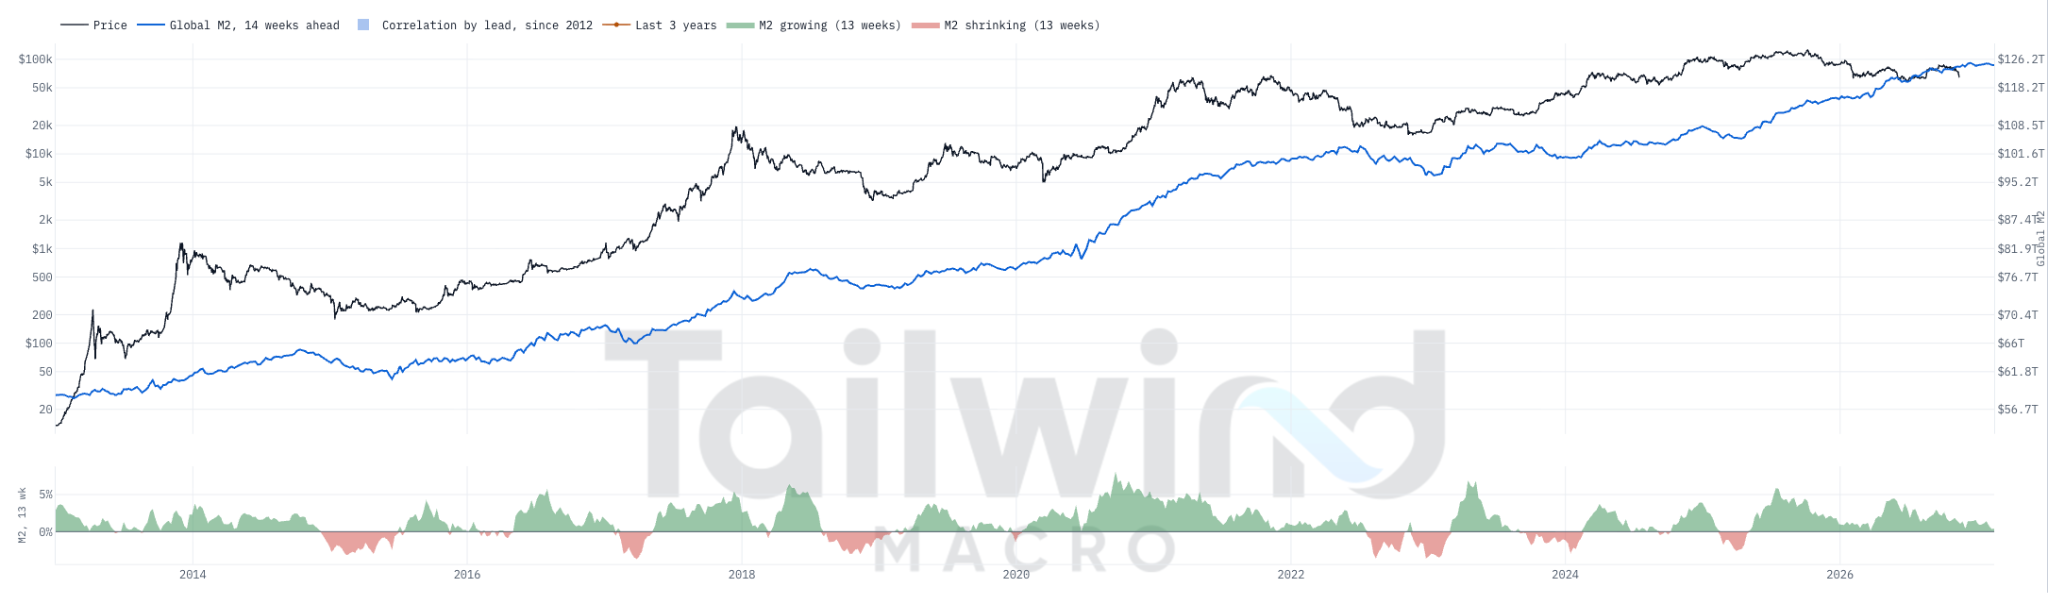
Chart: Lead-Lag Relationship Between Global M2 Supply Growth and BTC Price Action
If we calculate based on the historical pattern of M2 leading by 110 days, Q1 2027 will be a crucial time window to observe BTC regaining momentum and strengthening.
The Reality: Does BTC Have the Conditions to Exit the Bear Market?
From the perspectives of halving cycles, midterm elections, and liquidity patterns, the bear market is gradually approaching its end on a temporal scale. However, returning to reality, the evolution of the current financial environment still faces numerous constraints:
1. Renewed heating of Fed rate hike expectations: US inflation resilience continues to beat expectations, with markets pricing in potential room for further hikes totaling around 64 basis points over the next 12 months. Tightening pressure could extend into 2027. Policy-side tightness means USD liquidity is unlikely to quickly pivot to accommodation in the short term.
2. US Treasury yields and the dollar maintain dual strength: The US 10-year Treasury yield has climbed back to around 5.15%, and the Dollar Index continues to oscillate above 103. Capital's preference for risk-free yields and dollar-denominated assets suppresses the allocation willingness for non-yielding assets like BTC.
3. Surge in AI capex triggers tech stock valuation reassessment: Leading AI firms reported capex reaching $230 billion in Q3, with some exceeding operating cash flows. Markets are beginning to scrutinize the ROI of AI commercialization investments, putting pressure on tech stocks as they range. If subsequent corporate earnings can absorb current valuations, US stocks may rebuild support.
4. Phased contraction of existing crypto market liquidity: Spot BTC ETFs face continuous net outflows, major stablecoins shrank by approximately $11.5 billion in supply over the past 30 days, and both on-chain and institutional funds are narrowing from both sides, leaving a short-term lack of ample incremental buying pressure.
5. Institutional position costs face tests: The current BTC spot price has fallen below the average cost basis lines for some key institutions (such as MicroStrategy), and a tightening market financing environment may limit their capacity for subsequent continuous position building.
Evaluating holistically, the current market is undergoing a triple resonance adjustment involving macro monetary policy, tech stock valuation systems, and crypto asset liquidity. With the endpoint of rate hikes becoming clear, US stocks stabilizing, and institutional buying flow returning, BTC will gradually build the necessary and sufficient conditions to exit the bear market.
How Much Longer Will the Bear Market Last?
Whether observing the early recovery pattern of halving cycles or the timing window of US midterm elections, historical statistics all show that BTC has entered the late stage of bottoms-building in this major bear market.
However, today's macro and funding environments feature structural differences compared to previous cycles: the extension of the Fed's monetary tightening cycle, valuation divergence in the tech sector, and the extraction of on-chain liquidity are all extending the grinding phase of market recovery to some extent.
Synthesizing deductions across multiple dimensions, late 2026 to the first half of 2027 is highly likely to be the critical window where this bear market completely finishes its bottoms-building process and establishes a new cycle. Wolfy (@wolfyxbt)'s Wolf Wave Cycle Index aligns with this timeframe, even suggesting that BTC in theoretical models is gradually approaching or entering the germination stage of a new cycle.
Join TechFlow official community to stay tuned
Telegram:https://t.me/TechFlowDaily
X (Twitter):https://x.com/TechFlowPost
X (Twitter) EN:https://x.com/BlockFlow_News
 @BiteyeCN