
JPMorgan Research Report Analysis: Deleveraging Only Halfway Done, US Stocks Must Endure for Another Three Months
TechFlow Selected TechFlow Selected
JPMorgan Research Report Analysis: Deleveraging Only Halfway Done, US Stocks Must Endure for Another Three Months
Retail investors continue to buy, sovereign wealth funds have increased allocations amid rising oil prices, and overall demand still exceeds supply.
 Navigating Web3 tides with focused insights
By: Rita
TechFlow Insights
Over the past month or so, the US stock market has experienced violent volatility, with the Nasdaq pulling back from highs and then rebounding. JPMorgan's capital flow report on July 15 provided an assessment: the deleveraging started in June is not yet over; leveraged ETFs, options, and margin accounts still have room for further compression, and the US stock market still faces pressure in the short term.
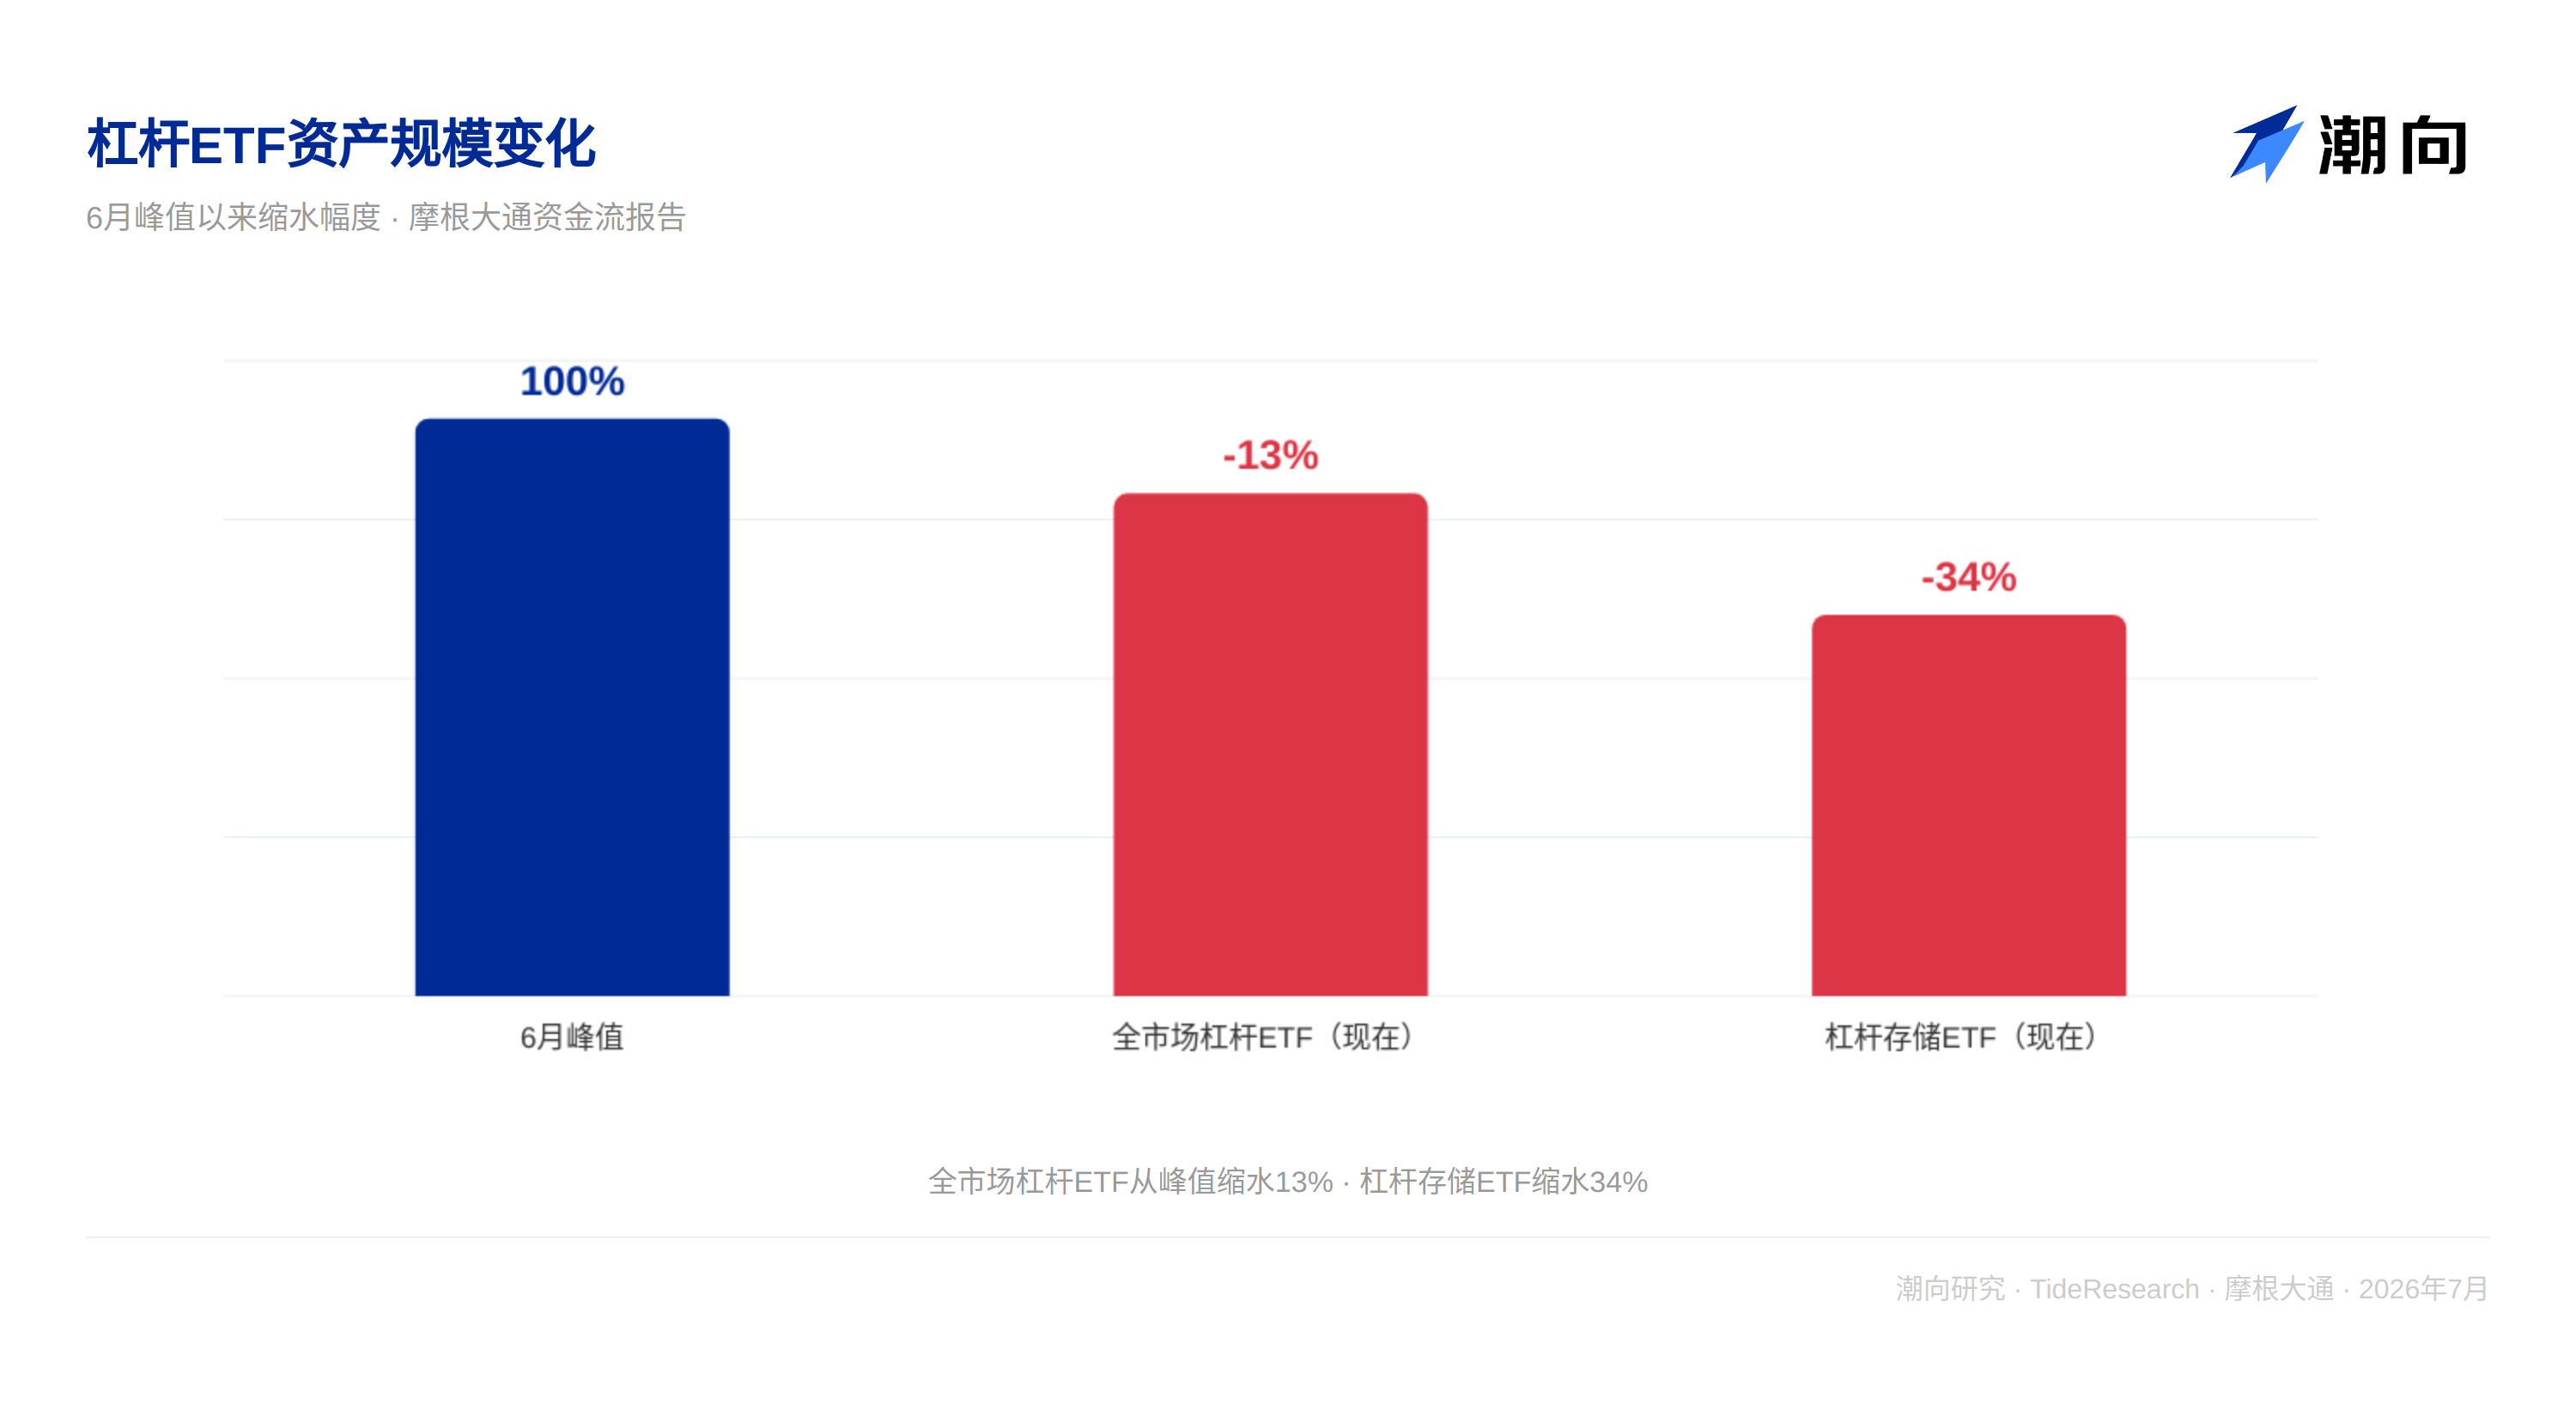
Leveraged ETFs were specifically singled out by JPMorgan. These products self-consume in volatile markets. If the index falls 10% and then rises 11.1% to return to the original level, a 3x leveraged ETF has already lost 7%. This is the cost of convexity. Since the peak in June, the size of leveraged storage ETFs has shrunk by 34%, and leveraged ETFs across the market have shrunk by 13%. However, JPMorgan believes that at the current pace, it will take about three more months of volatility for the size proportion of leveraged ETFs to return to pre-April levels.
The good news is that after deleveraging ends, the supply and demand dynamics of long-term capital will provide support. Retail investors are continuing to buy, sovereign wealth funds have increased allocations against the backdrop of rising oil prices, and overall demand still exceeds supply.
Leveraged ETFs Are Self-Correcting, But Not Yet There
The problem with leveraged ETFs is structural. The daily return of these products is a fixed multiple of the daily index return; they perform well in single-sided upward trends but are repeatedly eroded in oscillating markets.
JPMorgan used a simple example to illustrate: if the index falls 10% and rises 11.1% the next day to return to the original level, a 3x leveraged ETF loses 7% over the two days. This is convexity decay, which continuously erodes asset size in range-bound oscillations.
This mechanism is self-correcting. The higher the leverage, the greater the volatility, and the faster the decay. Since the peak in June, the AUM of leveraged storage ETFs has shrunk by 34%, and leveraged ETFs across the market have shrunk by 13%. However, relative to the market cap proportion of held stocks, the decline is far from enough. JPMorgan believes that it will take about three more months of oscillating markets for the market cap proportion of leveraged ETFs to return to pre-April levels.
Additionally, since July, leveraged ETFs have continued to receive capital inflows, which will prolong the deleveraging time. The market cap proportion of leveraged storage ETFs is three times that of ordinary ETFs, meaning the volatility source of storage stocks is highly concentrated in leveraged products.
Retail Options and Margins Are Also Deleveraging
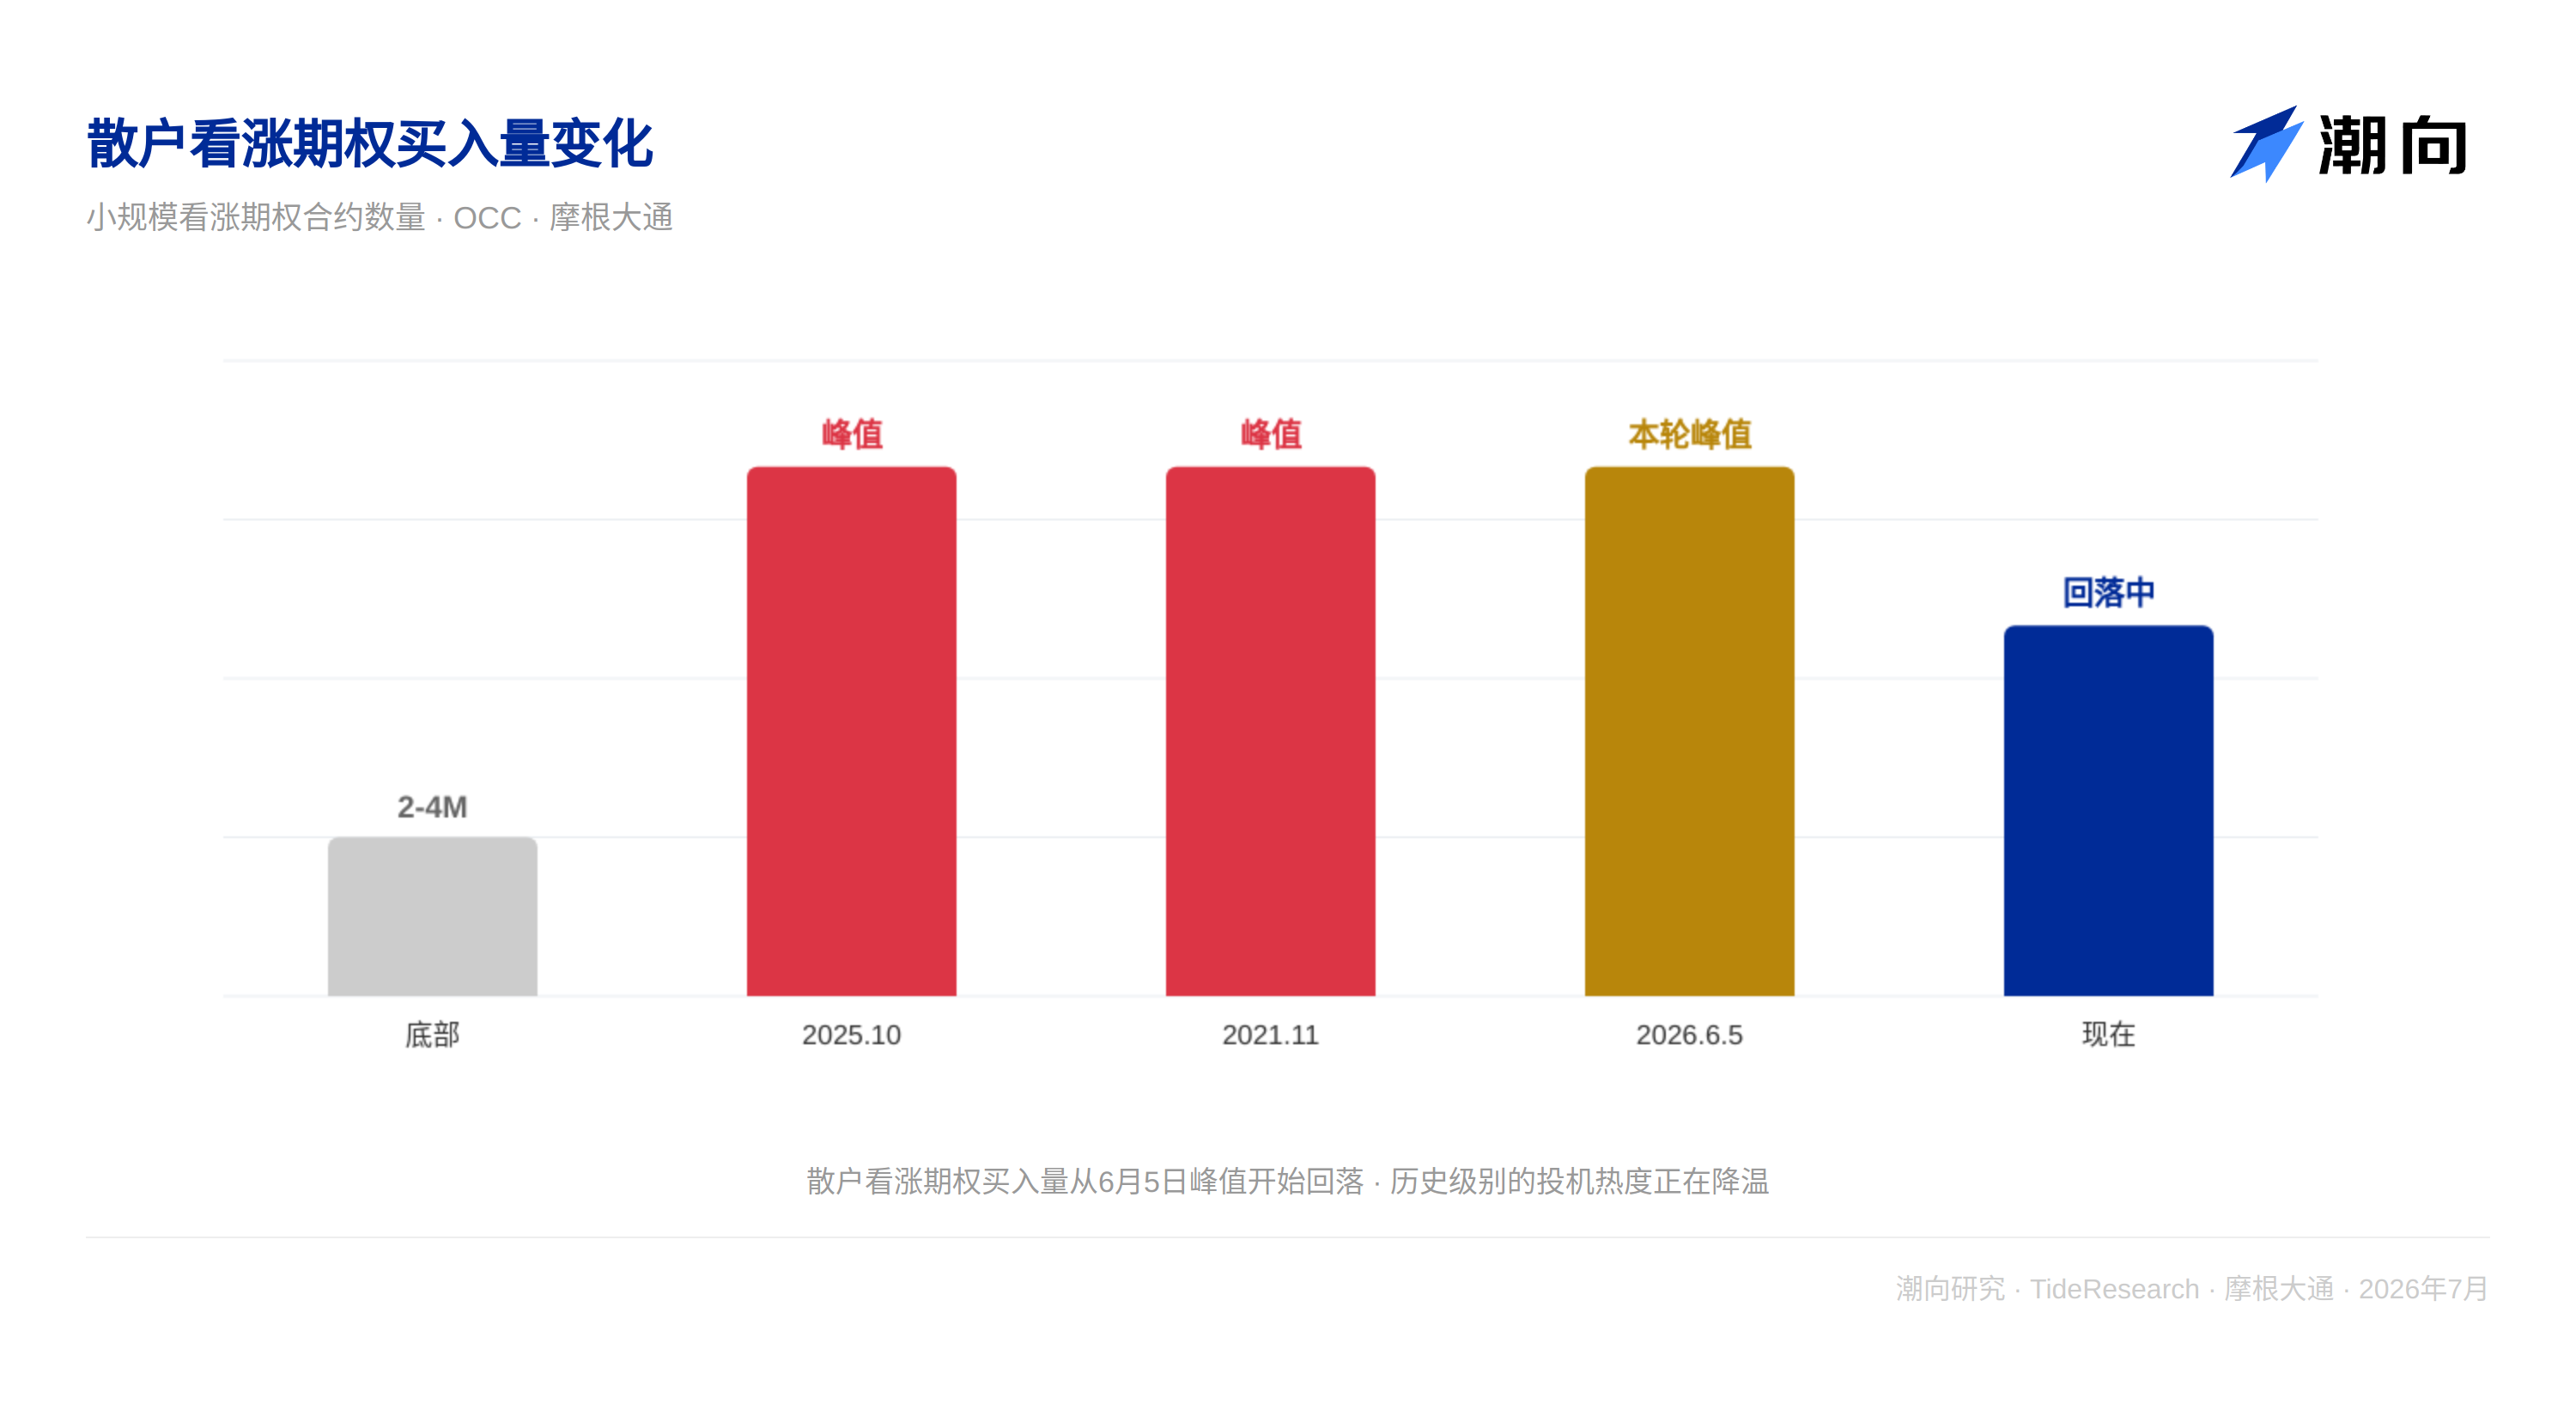
On June 5, the indicator tracking retail small-scale call option buying volume touched 14 million contracts, comparable to the peaks in October 2025 and November 2021. After the previous two peaks, tech stocks experienced months of pullbacks until this indicator fell to between 2 million and 4 million contracts to bottom out.
Currently, this indicator has retreated from its peak but is still some distance from historical bottoms. JPMorgan believes that retail enthusiasm in the options market is waning, which remains a suppressing factor for tech stocks (the sector most preferred by retail investors).
Leverage in margin accounts is also at extreme levels. The net debit balance tracked by JPMorgan shows that current levels are comparable to peaks at the end of 2021 and mid-2018. After the previous two peaks, the market experienced months of adjustment. Currently, this indicator has just shown signs of an initial retreat, far from returning to normal.
Hedge Funds Are Already Reducing Positions
In June, although the S&P 500 and Nasdaq fell, equity long-short hedge funds and TMT sector funds still achieved positive returns (+1.2% and +3.7% respectively). The reason was that their overweight positions in semiconductors hedged the losses. The SMH Semiconductor ETF rose 9.5% in June, while mega-cap tech stocks fell 14.5%.
But the situation changed in July. The daily hedge fund leverage indicator tracked by JPMorgan shows that the leverage ratio of equity long-short funds has retreated from the historical high in June, and the correlation with semiconductors is also weakening. This indicates that hedge funds may have reduced their semiconductor positions in July.
The leverage of risk parity funds has returned to normal levels and no longer constitutes additional selling pressure.
Long-Term Capital Is Still Waiting
Retail investors are the biggest buyers, with net purchases of about $550 billion year-to-date, expected to exceed $1 trillion for the full year. CTAs (Commodity Trading Advisors) and equity long-short hedge funds have cumulatively bought about $40 billion this year. Sovereign wealth funds and central banks, due to rising oil prices, are expected to contribute about $110 billion in stock demand for the full year.
Pension funds and insurance companies are stable net sellers, expected to sell about $470 billion for the full year, but half of this has already been completed. On the supply side, due to large IPOs and refinancing this year, net supply is about $200 billion, an increase from zero supply last year, but overall still within a controllable range.
Comprehensively calculated, full-year stock demand is about $775 billion, supply is about $200 billion, and net demand is about $275 billion. There is still about $200 billion of net demand waiting to be released in the second half of the year; once deleveraging ends, these funds will become the market's supporting force.
TechFlow Perspective
This JPMorgan report helps investors distinguish between forces on two time scales. In the short term, deleveraging is a self-correcting but time-consuming process. The convexity decay of leveraged ETFs, the waning enthusiasm of retail options, and the compression of margin accounts cannot be completed within one or two weeks. JPMorgan gave an estimate of "three months," which is a useful reference anchor.
But looking at a longer time dimension, the funding side is not bad. Retail investors are still buying, sovereign wealth funds are increasing allocations, and CTAs and quantitative strategies still have room to add positions. The reason these funds are not pushing up stock prices now is that the force of deleveraging is hedging their impact in the short term.
For investors, this means: short-term market volatility may be the end of deleveraging, rather than the start of a new round of declines. The key is to distinguish between "deleveraging" and "fundamental deterioration"; the former is a structural self-correction, while the latter is the real risk.

Disclaimer
This article is a compilation and interpretation by TechFlow Research of a third-party broker research report (JPMorgan, July 15, 2026). The ratings, target prices, earnings forecasts, and related judgments cited in the text are the views of the broker's analysts, represent only the position of their affiliated institution, do not represent the views of TechFlow Research, and do not constitute any investment advice.
The market carries risks; decisions must be made independently. This article should not be used as a basis for buying or selling any securities.
Join TechFlow official community to stay tuned
Telegram:https://t.me/TechFlowDaily
X (Twitter):https://x.com/TechFlowPost
X (Twitter) EN:https://x.com/BlockFlow_News
 @chaoxiangooo