

Huobi Growth Academy | Crypto Market Macro Report: Bitcoin Returns to $80,000; Major Reversal in U.S.-Iran Tensions and Fed Leadership Change
TechFlow Selected TechFlow Selected
Huobi Growth Academy | Crypto Market Macro Report: Bitcoin Returns to $80,000; Major Reversal in U.S.-Iran Tensions and Fed Leadership Change
Identifying Structural Signals Amid Macro Uncertainty
Summary
In early May 2026, the global crypto market exhibited extreme divergence and heightened uncertainty amid simultaneous disruptions from three macro-level variables. Geopolitically, on May 4, former U.S. President Donald Trump announced the launch of the “Freedom Plan”—a U.S. naval escort operation for commercial vessels through the Strait of Hormuz—only to dramatically suspend it one day later, citing “major progress” in comprehensive U.S.-Iran negotiations. Iran, however, insisted it remained in a state of war with the United States and continued to close the Strait, requiring all transiting vessels to obtain explicit Iranian permission. At the Federal Reserve level, Kevin Warsh is set to formally succeed Jerome Powell as Fed Chair around May 15, while the April 30 FOMC meeting held rates steady as expected. The Beige Book revealed that surging energy prices had placed broad-based cost pressure on businesses across all 12 districts; Goldman Sachs subsequently raised its year-end core PCE inflation forecast from 2.5% to 2.6%. Amid these macro headwinds, Bitcoin rebounded strongly from its early-February low of $60,000 to reclaim the $80,000 threshold—but whether this rally can consolidate remains uncertain given persistent macro pressures. Meanwhile, institutional behavior displayed an unusual “counter-trend accumulation” pattern: on May 1, U.S. spot BTC ETFs recorded a single-day net inflow of $630 million, with BlackRock’s IBIT alone accounting for $284 million and Fidelity’s FBTC contributing $213 million. Overall, the market has entered a critical juncture where the interplay among geopolitical developments, Fed policy, and institutional capital flows will determine its directional bias.
I. Geopolitical Contest: The Reversal of the “Freedom Plan” in the Strait of Hormuz and the Resurgence of Inflation
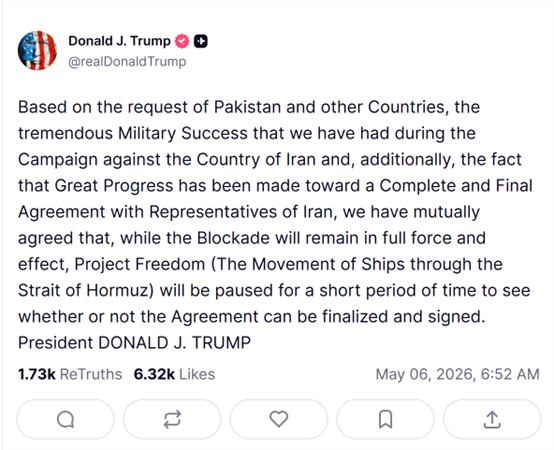
On May 4, 2026, former U.S. President Donald Trump announced on Truth Social that the United States would officially launch the “Freedom Plan” naval escort operation for commercial vessels through the Strait of Hormuz at local time that morning. The operation involved missile destroyers, over 100 sorties of land- and sea-based aircraft, multi-domain unmanned platforms, and 15,000 active-duty personnel. Washington characterized the mission as a “defensive humanitarian operation,” designed to circumvent the 60-day authorization limit imposed by the U.S. War Powers Resolution on presidential military actions. Yet just one day later, Trump posted again announcing the suspension of the “Freedom Plan,” citing “major progress” in comprehensive U.S.-Iran negotiations—but emphasized that the U.S. maritime blockade against Iran would “remain fully effective.” This dramatic reversal caught global markets off guard, triggering sharp volatility in crude oil prices.
Iran’s stance proved far more uncompromising than the U.S. rhetoric. Ali Akbar Velayati, foreign affairs advisor to Iran’s Supreme Leader, explicitly declared the Strait of Hormuz closed—reopening only “at the discretion of the Islamic Republic of Iran.” All vessels intending to transit the Strait must submit formal applications via official email and receive explicit Iranian approval before proceeding. The Chairman of Iran’s Parliament National Security Committee warned that any foreign armed forces—particularly U.S. military assets—approaching or entering the Strait would be targeted. On critical issues including the nature of the ceasefire, freedom of navigation through the Strait, and whether the “Freedom Plan” had truly been suspended, U.S. and Iranian positions remain sharply divergent. Markets have not yet reached a point where geopolitical risk pricing can be relaxed.
The direct consequences of this geopolitical contest are already emerging in global inflation data. With escalating U.S.-Iran military tensions and the UAE’s announcement on May 1 of its withdrawal from the OPEC+ alliance, international oil prices rose steadily from late April into early May, driving significant upward pressure on energy costs. Goldman Sachs responded by raising its year-end core PCE inflation forecast from 2.5% to 2.6%, and its overall PCE forecast from 3.1% to 3.4%. More alarmingly, this inflationary surge stems not from overheated demand but rather from supply-side shocks (oil) compounded by tariff effects—rendering the Fed’s monetary policy response mechanism increasingly complex: it dares not raise rates hastily (fearing deeper economic slowdown), yet struggles to initiate rate cuts (as inflation expectations risk becoming unanchored). For Bitcoin, such “stagflationary” macro conditions have historically exerted dual downward pressure—its safe-haven properties lack broad consensus, while tightening liquidity expectations continue to suppress risk-asset valuations.
II. On the Eve of the Fed’s Leadership Transition: The Beige Book Warning and the Crossroads of Policy Independence
In mid-May 2026, the Federal Reserve is set to undergo the most controversial chair transition in its modern history: Kevin Warsh will formally succeed Jerome Powell as Fed Chair. Breaking a 75-year precedent, Powell will remain on the Board of Governors after stepping down as Chair—a move widely interpreted by markets as a political compromise reflecting incomplete separation between the White House and the Fed. Warsh’s policy posture exhibits a nuanced blend of hawkishness and dovishness: he is hawkish on inflation control and balance sheet management, emphasizing monetary discipline and framework reform, and has publicly criticized the Fed’s ultra-loose policies over the past two decades as having “seriously deviated from its mandate.” Yet he is dovish on long-term interest-rate trajectories, acknowledging technology’s natural disinflationary effect and supporting rate cuts where data permits. This mixed stance has generated widespread market disagreement about the likely path of monetary policy under “Warsh-era” leadership—making it a key source of uncertainty in May’s crypto macro-pricing.
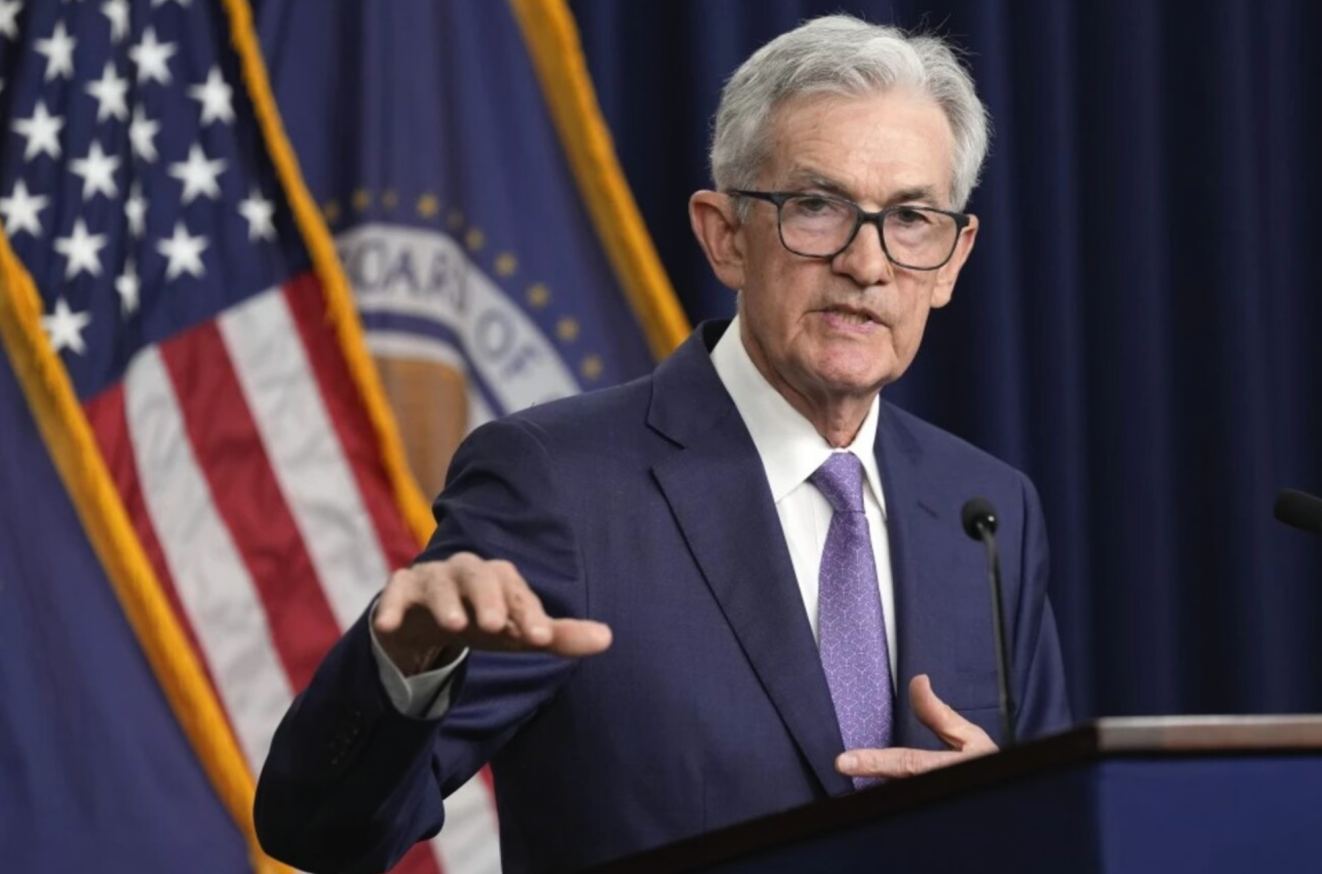
The Federal Reserve’s April 30 FOMC meeting—the last chaired by Powell—held the federal funds rate unchanged at 3.50%–3.75%, as widely anticipated. The post-meeting statement and Powell’s press conference conveyed a complex message: on one hand, he acknowledged that the impact of rising energy prices on inflation “has already begun to materialize and may expand further in the near term,” adding that “no officials currently support a rate hike, though some advocate trimming the accommodative tone of the statement”; on the other hand, Powell stressed that he would “not serve as a shadow chair” after stepping down, seeking to reassure markets concerned about compromised Fed independence. Yet within days of the meeting’s conclusion, internal Fed divisions surfaced: Stephen Milan, a Trump-nominated governor, dissented in favor of rate cuts, while “hawkish heavyweights” including Cleveland Fed President Loretta Mester and Minneapolis Fed President Neel Kashkari dissented in favor of holding rates steady. Such pronounced internal discord casts a high degree of uncertainty over Warsh’s first FOMC meeting.
The Federal Reserve’s Beige Book released on April 16 offers invaluable grassroots insight into the true state of the U.S. economy. It reports modest-to-moderate expansion across eight of the twelve Federal Reserve districts, little change in two, and modest-to-moderate contraction in two. Most notably, regarding inflation: “Energy and fuel costs rose sharply across all twelve districts,” with businesses broadly reporting input-cost increases outpacing sales-price gains—compressing profit margins. Hiring, pricing, and capital-investment decisions have grown more complex, and “wait-and-see” has become the dominant business strategy. For crypto assets, the Beige Book’s core message is clear: while the U.S. economy has not entered recession, its growth momentum is being eroded by energy-driven inflation—implying the Fed’s path to rate cuts will be more winding than previously anticipated by markets. This remains a structurally bearish macro backdrop for the liquidity-sensitive crypto market.
III. Institutionalization Deepens: ETFs’ Counter-Trend Accumulation and Miners’ Balance-Sheet Optimization
Against the backdrop of Bitcoin’s sharp pullback from its highs, institutional investors’ counter-trend buying emerged in May 2026 as the most notable structural signal in the crypto market. According to SoSoValue data, on May 1 (U.S. Eastern Time), U.S. spot Bitcoin ETFs recorded a single-day net inflow of $630 million—led by BlackRock’s IBIT ($284 million) and followed by Fidelity’s FBTC ($213 million). On May 4, spot ETFs registered another $532 million in net inflows. This capital flow stands in stark contrast to BTC’s price action: while price oscillated repeatedly between $76,000 and $81,000, ETFs continued posting net inflows—indicating institutions were building positions steadily during weakness, rather than exhibiting the momentum-chasing behavior typical of retail traders. As of early May, total net assets of U.S. spot BTC ETFs reached $103.785 billion—approximately 6.66% of Bitcoin’s total market cap. The ongoing rise in institutional ownership is fundamentally reshaping Bitcoin’s price discovery mechanism—from a retail-driven, highly volatile speculative asset toward an institutional allocation asset.
From a broader perspective, deepening institutionalization is reshaping Bitcoin’s supply-demand equilibrium. Since U.S. spot Bitcoin ETFs received regulatory approval in January 2024, the ETF channel has absorbed over 580,000 BTC—equivalent to roughly three years of Bitcoin network issuance. Concurrently, supply held by long-term holders has risen continuously since mid-February 2026, suggesting long-term investor conviction strengthened—not weakened—during the price correction. This dual “institutional + long-term holder” lock-up dynamic has steadily reduced Bitcoin’s effective circulating supply, providing implicit downside support for price amid macro headwinds.
IV. Bitcoin’s Return to $80,000: Halving-Cycle Patterns and the Bull-Bear Dialectic at the Current Juncture
As of early May 2026, Bitcoin is staging a pivotal comeback from a deep correction. BTC fell to a low near $60,000 in early February, then staged a robust rebound in early May to reclaim the $80,000 level—representing over a 33% gain from its recent trough. While this “return to $80,000” still leaves BTC roughly 46% below its all-time high set in October 2025, the current correction differs structurally from the brutal bear markets of 2018 and 2022—characterized by retail panic selling and mass miner shutdowns. By contrast, 2026’s drawdown shows markedly different features: sustained ETF net inflows, rising long-term holder supply, and leading miners continuing to optimize their balance sheets rather than cut production and exit. Collectively, these signals point toward a judgment that this is more likely a “deep correction within a bull market,” rather than the start of a new bear market signaling the end of the bull cycle.
Historically, Bitcoin’s halving cycles suggest that the 12–18 months following each halving constitute the most intense phase of price discovery. After the 2012 halving, BTC broke its prior high approximately 12 months later; after the 2016 halving, the main bull run began around month 17; and after the 2020 halving, the cycle peak occurred around month 12. Applying this historical pattern, the 12–18-month window following the April 2024 halving (when block rewards dropped from 6.25 to 3.125 BTC) spans April to October 2026—precisely the period we are in now. This implies the current price correction may well represent a “washout and consolidation” phase inherent to the halving cycle—not a cyclical top reversal. Of course, the validity of this historical pattern in today’s deeply institutionalized environment remains highly uncertain.
Technically, Bitcoin’s core trading range following its “return to $80,000” is $76,000–$83,000. The $80,000 level itself serves as both a key psychological threshold and short-term support, while $83,000 marks the location of the 200-day simple moving average—and represents the critical “bull-bear dividing line” contested by both sides. A confirmed daily close above this level would open the path to targets of $89,000–$94,000. Below, $76,000 is the low tested multiple times in April 2026; if breached, technical downside targets shift to $70,000–$65,000. Momentum indicators show RSI-7 has risen to 71.27—approaching overbought territory—suggesting near-term technical pullback pressure. However, MACD formed a bullish crossover in mid-April, offering some medium-term momentum support. Synthesizing these technical signals, the most reasonable assessment at this juncture is that BTC is in a “confirmation phase following its return to $80,000,” with range-bound trading likely to persist for another 2–4 weeks until a clear macro catalyst emerges.
V. Outlook: Three-Scenario Forecast and Key Observation Points
Integrating the three primary drivers—geopolitics, Fed policy trajectory, and institutional fund flows—the crypto market from May to July 2026 may evolve along the following three scenarios.
Scenario One (Probability ~35%): Geopolitical de-escalation + Fed dovish pivot → BTC challenges $89,000–$94,000. If substantive framework agreements emerge from U.S.-Iran negotiations during the “Freedom Plan” suspension window—leading to normalized Strait of Hormuz passage, falling oil prices, and cooling inflation expectations—and if Warsh, in his inaugural public remarks around May 15, signals dovish intent, then a dual macro “double hit” would be triggered: a substantial recovery in risk appetite and accelerated ETF inflows. BTC could break above the $83,000 (200-day SMA) resistance within 2–4 weeks and target the $89,000–$94,000 zone. Key observation points include Warsh’s inaugural speech around May 15, the April U.S. nonfarm payrolls report released on May 8, and interim announcements from U.S.-Iran negotiations.
Scenario Two (Probability ~45%): Geopolitical stalemate + Fed wait-and-see → BTC trades sideways in $70,000–$85,000. This neutral scenario reflects the market’s most fully priced-in base case. Neither side achieves a comprehensive agreement within the four-week ceasefire window, nor do they escalate into large-scale new hostilities—the Strait remains in a “semi-blockade” state; meanwhile, the Fed maintains its “data-dependent” stance under Warsh. Under this scenario, BTC is most likely to trade in a wide range, with ETF weekly net flows becoming the most immediate price driver: sustained weekly inflows above $300 million would push price toward the upper bound, whereas a week of net outflows would test lower-bound support. Range-trading strategies suit most investors best under this scenario.
Scenario Three (Probability ~20%): Escalating conflict + runaway inflation → BTC retreats to $65,000–$70,000. If the ceasefire collapses entirely, Iran declares a full closure of the Strait of Hormuz, oil prices breach $120/barrel, and Goldman Sachs is forced to further revise its year-end PCE forecast upward—and if hawkish Fed officials openly discuss “raising rates if necessary to combat inflation”—this macro “perfect storm” would simultaneously damage liquidity expectations and risk sentiment. BTC could break below the $70,000 psychological level. Though relatively low-probability, such an event would trigger systemic liquidations across leveraged crypto positions. In this scenario, cash and short-term Treasuries represent optimal holdings, and Bitcoin should only be repositioned after confirming a macro inflection point.
VI. Conclusion: Identifying Structural Signals Amid Macro Fog
The crypto market in May 2026 sits at a historic confluence of three powerful forces: geopolitics, monetary policy, and institutionalization. The dramatic reversal of the “Freedom Plan,” the uncertainty surrounding the Fed’s leadership transition, the halving-cycle verification period, and the structural shift of sustained counter-trend ETF accumulation collectively form an exceptionally complex—and rich—macro chessboard. For investors, mastering this stage hinges on distinguishing “noise” from “signal”: the back-and-forth of geopolitical events and the hawk-dove debates among Fed officials are essentially short-term noise—they influence prices on an intraday to weekly basis, but cannot alter the medium-term trend defined by deepening institutionalization and halving-driven supply contraction.
Macro headwinds often serve as the best friends of long-term allocators. The macro pressures Bitcoin faces in May 2026—rising oil prices, Fed policy ambiguity, and persistent geopolitical conflict—are, in fact, far milder than the darkest moments of March 2020’s “liquidity crisis” or 2022’s “FTX collapse + aggressive Fed hiking.” Meanwhile, the continuous rise in institutional holdings, the ongoing expansion of the ETF product suite, and the ability of leading miners to optimize their capital structures even at cycle lows—all quietly tell a larger story: Bitcoin is evolving from a fringe speculative instrument into a permanent fixture in the global asset allocation landscape. This evolution is volatile—but its direction is unmistakable. We recommend focusing on three key variables: First, Warsh’s inaugural speech around May 15 will determine the re-pricing direction of rate-cut expectations; second, tangible progress—or lack thereof—in U.S.-Iran ceasefire negotiations within the four-week window will define the path of oil prices and inflation expectations; third, consecutive weekly net ETF inflows exceeding $500 million for two weeks running would be the clearest direct signal of accelerating institutional accumulation. The macro fog will inevitably lift—and those investors who maintain composure and correctly identify structural signals amid the haze will emerge as the most poised winners of the next leg up.
Join TechFlow official community to stay tuned
Telegram:https://t.me/TechFlowDaily
X (Twitter):https://x.com/TechFlowPost
X (Twitter) EN:https://x.com/BlockFlow_News


