
The 10 trickiest questions in today's global markets, according to UBS
TechFlow Selected TechFlow Selected
The 10 trickiest questions in today's global markets, according to UBS
Covered core market concerns ranging from tariff shocks to dollar depreciation.
 Navigating Web3 tides with focused insights
Author: Dong Jing, Wall Street Insights
UBS has addressed the 10 most pressing global economic questions in its latest research report, covering core market concerns ranging from tariff shocks to dollar depreciation.
On July 8, according to Wind Trading Desk, UBS Research released a major report providing in-depth analysis on the top ten issues most concerning investors. The report indicates that the global economy faces complex and intertwined challenges: U.S. tariffs are equivalent to taxing importers by 1.5% of GDP, while the global growth tracker stands at just 1.3% annualized growth—only at the 8th percentile historically.
UBS also stated in the report that dollar depreciation and central bank policy adjustments have become focal points for markets. While UBS holds a cyclical bearish view on the dollar, it does not expect this to mark the beginning of a long-term depreciation trend. Tariff impacts on inflation are expected to show up in July CPI data, while the Federal Reserve faces dual pressures from inflation and employment.
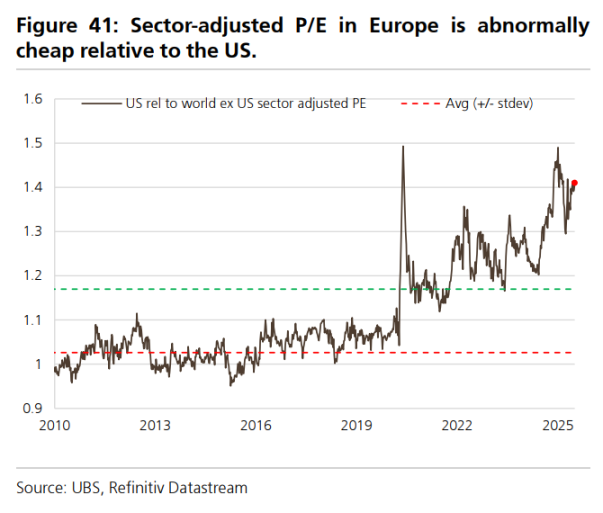
UBS noted that European equities offer valuation advantages relative to U.S. stocks, with sector-adjusted P/E ratios 25% lower than those of the U.S., far exceeding the historical norm of 7%. The firm maintains its strategic recommendation of benchmark allocation to U.S. equities and overweighting European equities.
The report also discusses the impact of Trump's "Great America Act" on the U.S. economy, the global shift toward accommodative monetary policies in response to growth slowdowns caused by tariffs, and prospects for China’s economic stimulus measures in the second half of the year.
Question 1: Has the impact of tariffs on global growth already materialized?
The report states that current U.S. tariffs are equivalent to imposing a tax of about 1.5% of GDP on American importers, and even with trade agreements, there is no clear downward trend in tariffs.
Data from the U.S. Treasury shows that based on tariff revenues in June, annual collections exceed $300 billion. According to Wind Trading Desk, Morgan Stanley previously reported that annualized U.S. tariff revenue has reached $327 billion, or 1.1% of GDP.
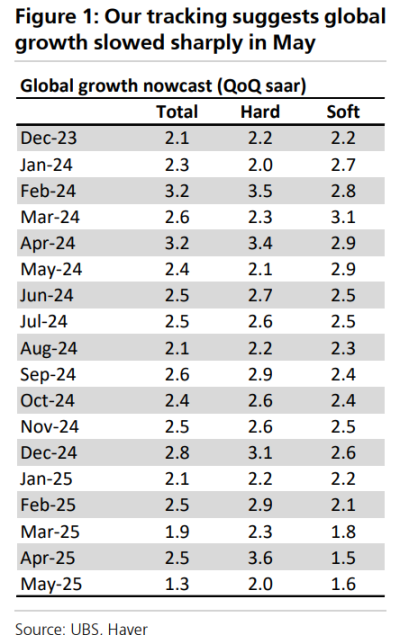
UBS said that after the tariff announcements in April, global hard and soft data diverged sharply (reaching the highest gap in 27 years): hard data showed 3.6% annualized growth, while soft data indicated only 1.3%. However, starting in May, the two began to converge as hard data deteriorated faster than soft data improved.
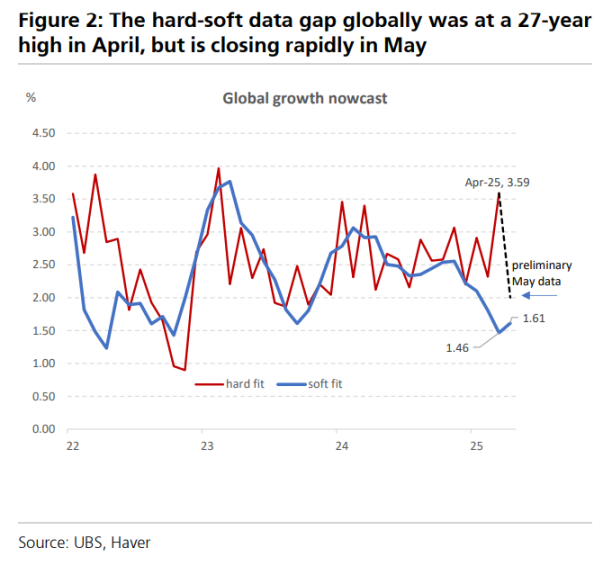
UBS’ composite global growth tracker shows global growth at only 1.3% annualized, placing it at the 8th percentile historically.
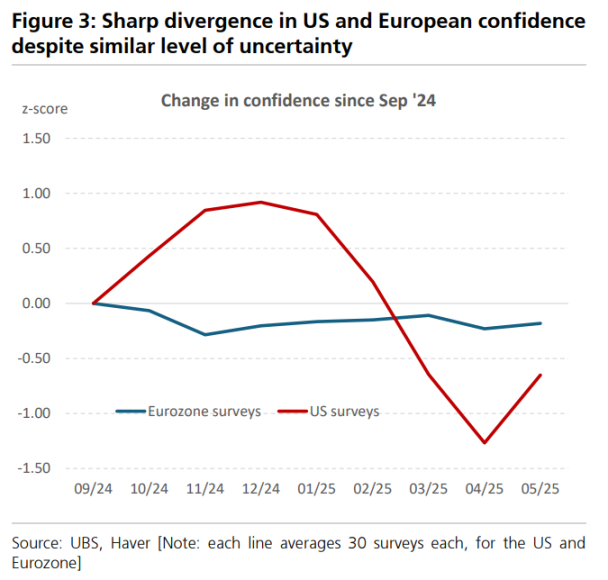
Notably, U.S. confidence indices have declined more than other regions, while European survey data remain largely flat, despite similar levels of policy uncertainty across both regions. In the U.S., survey data are now 1.5 standard deviations below December levels.
Question 2: How is this round of dollar selling different from previous episodes?
UBS holds a cyclical bearish view on the dollar but does not believe this marks the start of a long-term depreciation trend.
UBS analysts believe dollar depreciation is primarily driven by three factors: increased hedging demand against downside dollar risk, cyclical slowing in the U.S. economy, and improving trend growth elsewhere in the world. The first factor is already active, and the second is about to emerge.
Foreign investors hold $31.3 trillion in U.S. long-term securities, including $6.3 trillion held in official accounts. UBS estimates that a 5-percentage-point increase in foreign exchange hedging ratios would generate $1.25 trillion in dollar-selling flows—far exceeding the U.S. annual external deficit.
However, UBS emphasizes that the current dollar sell-off lacks key conditions seen in past long-term dollar downturns—namely, improved growth outside the U.S. and reduced risk premiums. This will likely limit the scope and duration of the current dollar depreciation cycle.
Question 3: The lagged impact of tariffs on inflation
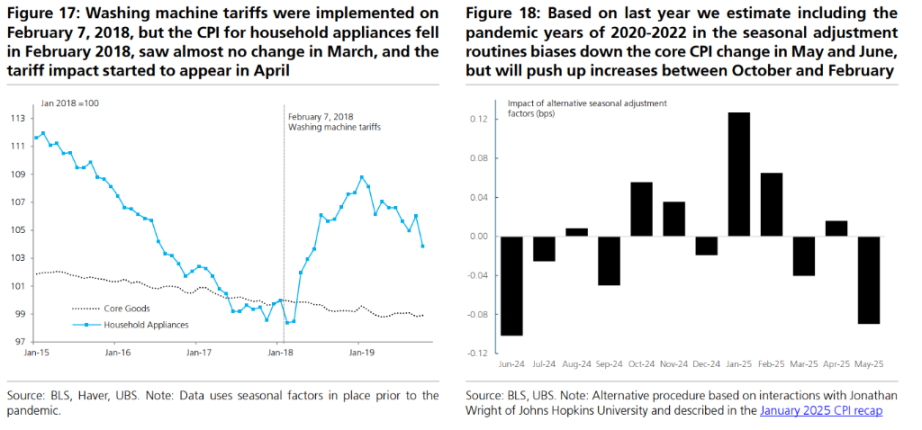
Despite large-scale U.S. tariffs that have effectively raised PCE prices by 1.1%, this effect has not yet clearly shown up in official CPI and PCE data.
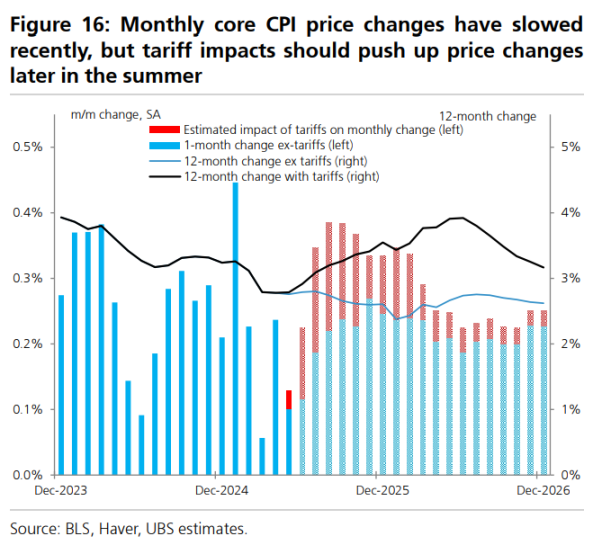
UBS attributes this lag to four main factors: shipment-date exemptions, corporate inventory buffers, slow price pass-through in intermediate and capital goods, and the CPI’s bimonthly sampling methodology.
UBS expects the significant impact of tariffs on headline inflation indicators to become visible only in the July CPI data (to be released in August).
The firm notes that during Trump 1.0, the 20% tariff on washing machines in 2018–2019 took 2–3 months to register clearly in CPI data. The current 10% broad-based tariffs are among the most inflationary, and their timing of impact is expected to be similar.
Question 4: How are global exporters responding to U.S. tariffs?
The report suggests that first-quarter and April/May data may reflect some front-loading ahead of tariffs, indicating that a stable state—where higher prices lead to reduced volumes—has not yet been reached.
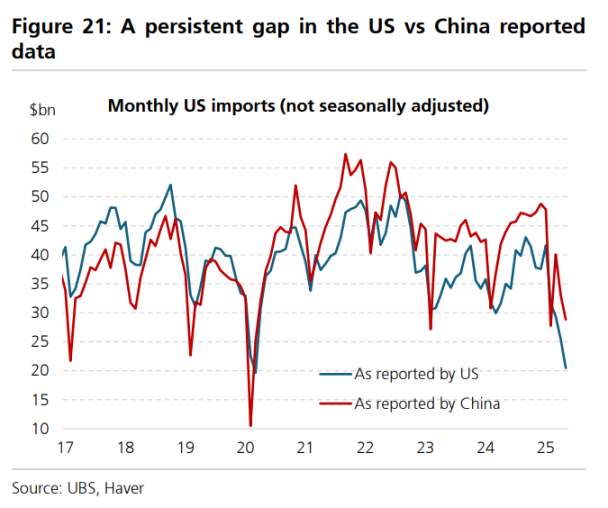
There remains a persistent discrepancy between U.S. and Chinese trade reports, as well as divergence between container shipping data and official trade figures.
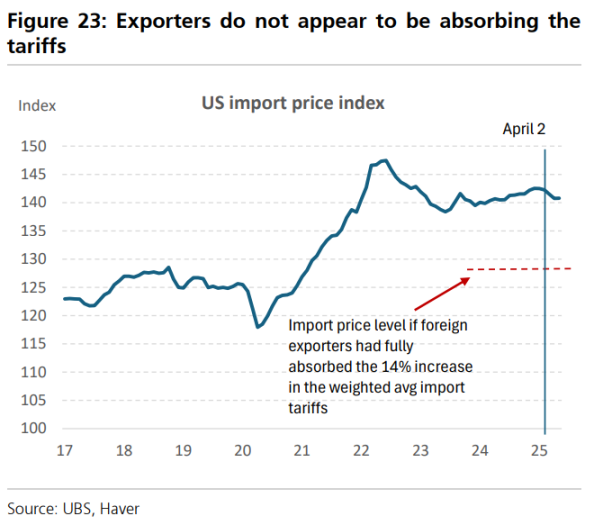
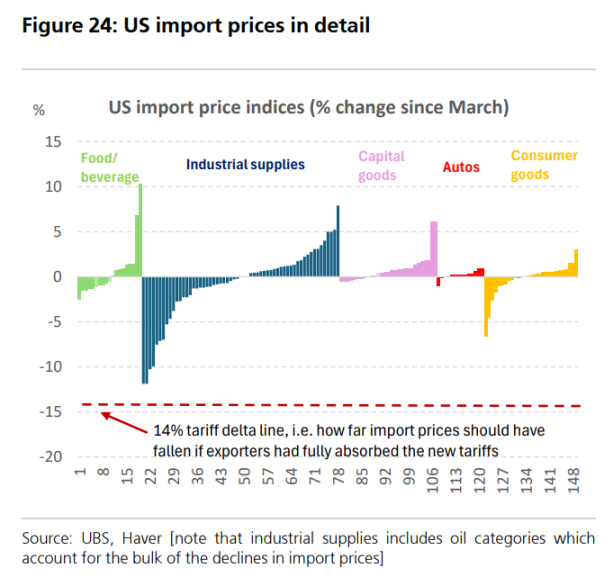
However, there is little evidence that foreign exporters are absorbing tariffs by lowering export prices. U.S. import prices fell only 0.5% in April and were flat in May, suggesting minimal price reductions by foreign exporters.
UBS believes foreign exporters may indeed be absorbing the impact of dollar depreciation on their profits, meaning U.S. importers are bearing the brunt of tariff costs. There is also no clear sign of rerouting yet, though it may still be too early.
Question 5: Is the U.S. fiscal outlook pushing up global yields?
Currently, the vast majority of changes in the U.S. budget deficit stem from the extension of the 2017 tax cuts, which was widely anticipated following the election.
UBS is highly concerned about the long-term supply of Treasuries, but historically, demand fluctuations tend to be much larger than supply fluctuations.
If concerns over economic slowdown continue to rise, domestic demand for Treasuries should increase enough to easily absorb the additional supply.
UBS believes the floor for 10-year Treasury yields should be around 2.75%, even under extremely stressed conditions.
Question 6: What is the evidence of capital outflows from the U.S.?
The idea that foreign investors are reducing exposure to U.S. assets has spread widely among market participants.
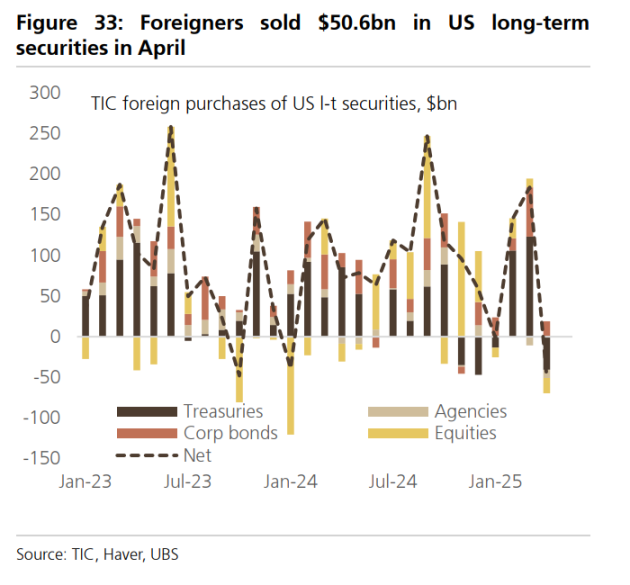
UBS says April TIC data provides evidence of a sell-off in U.S. assets, but it's unclear whether this rotation continued beyond April. Data shows foreign investors net sold $50.6 billion in U.S. long-term securities, including $18.8 billion in equities and $40.8 billion in Treasuries.
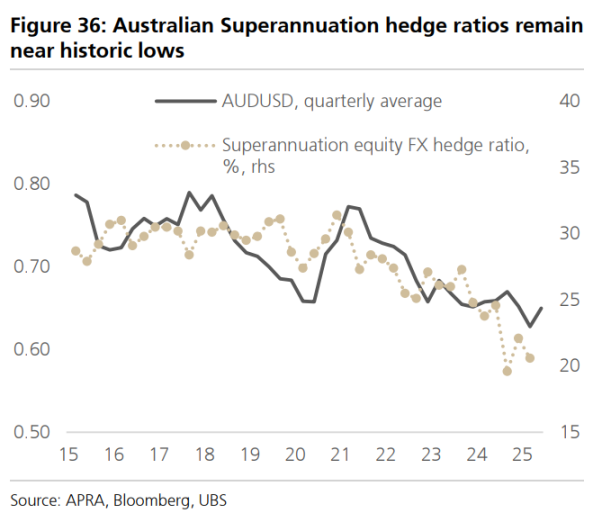
UBS believes continued dollar depreciation may reflect global investors increasing their FX hedging ratios on U.S. assets. FX hedging data from Australian and Canadian pension funds show current ratios remain near historical lows, leaving room for further increases.
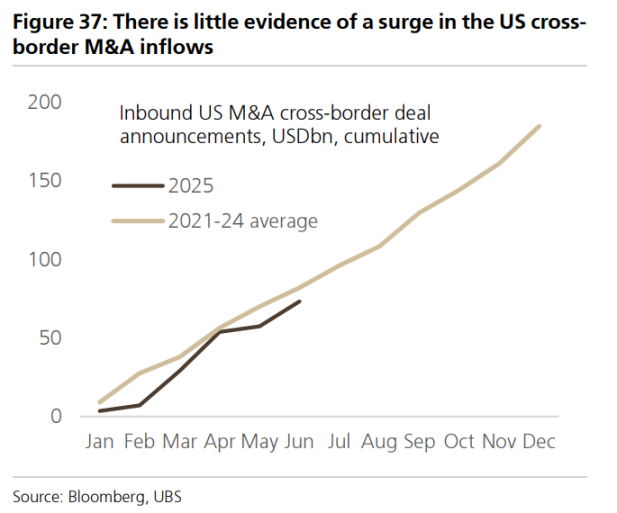
UBS adds that so far, merger and acquisition announcement data provide no clear evidence supporting federal claims of over $10 trillion in FDI investment commitments flowing into the U.S.
Question 7: How “exceptional” is the U.S. stock market compared to Europe?
When global GDP slows, the U.S. typically outperforms—but this time, the slowdown is centered in the U.S., while the eurozone has surprisingly performed better. Yet this has not fully reflected in market performance.
Areas where the U.S. underperforms the eurozone abnormally: valuations (U.S. is unusually expensive relative to EU), fiscal conditions, and household excess savings:
The sector-adjusted P/E ratio of U.S. equities is 25% higher than that of Europe, versus a historical average premium of just 7%.
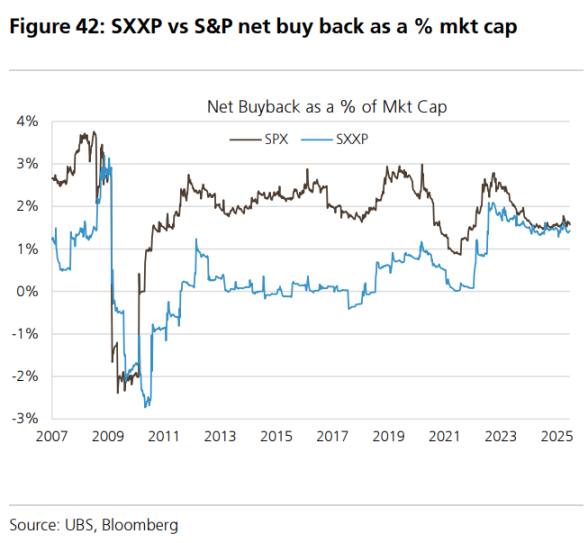
Total returns (dividends plus buybacks) in Europe now stand at 4.4%, compared to 2.8% in the U.S.
Both fiscal positions and household excess savings are significantly stronger in Europe. Excess savings in Europe amount to about 10% of GDP, versus only 2% in the U.S.
Areas where the U.S. is no longer “exceptional” relative to the eurozone: buyback activity (% of market cap) and GDP growth (slightly below EU in 2026).
Question 8: Does the “Great America Act” help or hurt U.S. growth?
UBS says the act increases deficits before 2026, then shifts to narrowing them, resulting in a total deficit reduction of $400 billion over 10 years.
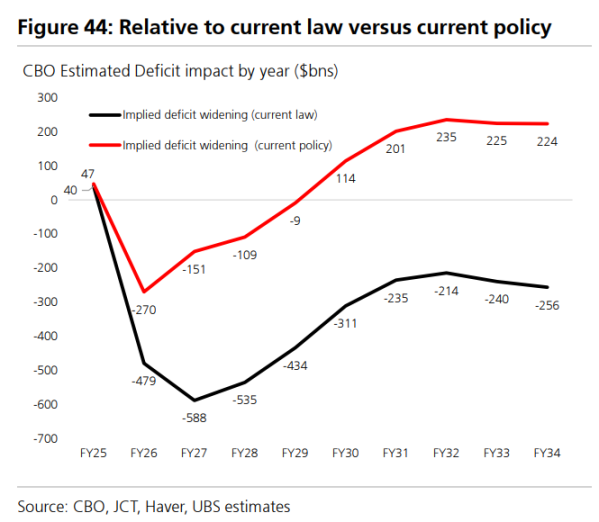
The bank expects the “Great America Act” to add about 45 basis points to growth before 2026, after which fiscal drag will begin to appear.
The act expands business provisions from the 2017 tax reform, including full expensing, R&D tax credits, and deduction changes, with student loan cuts serving as an important near-term funding source.
Question 9: How are central banks responding to global tariff escalation?
The actual impact of tariff shocks differs significantly from initial expectations, mainly reflected in dollar depreciation and the absence of retaliatory measures. This fundamentally alters economic outcomes, including central banks’ policy stances.
For central banks outside the Fed, the current situation is much simpler than the previously feared stagflation scenario. Tariff shocks clearly constitute a negative growth shock—and possibly even a disinflationary shock. Since April 2, developed-market 1-year forward 1-year rates have fallen an average of 30 basis points, and emerging markets by about 50 basis points.
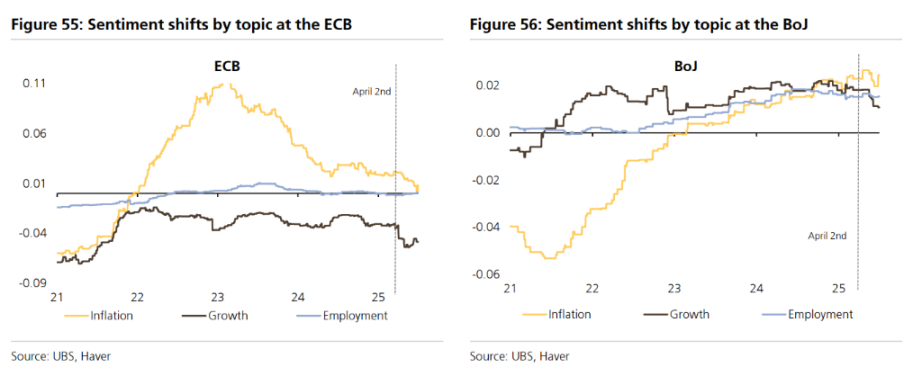
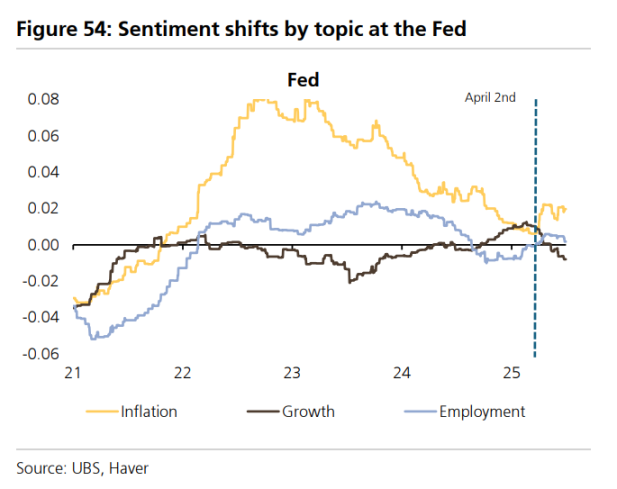
UBS’ deep analytical model shows the ECB among G3 central banks has turned the most dovish in tone, while the Bank of Japan has started expressing growth concerns. The Fed, however, faces a dilemma.
If inflation rises more than unemployment, Fed policy rules suggest rate hikes. But if tariffs represent mainly a one-time price-level shock, the Fed may prioritize addressing higher unemployment. Current signals suggest the Fed leans toward supporting the labor market.
Question 10: How much stimulus has China implemented, and how much more is coming?
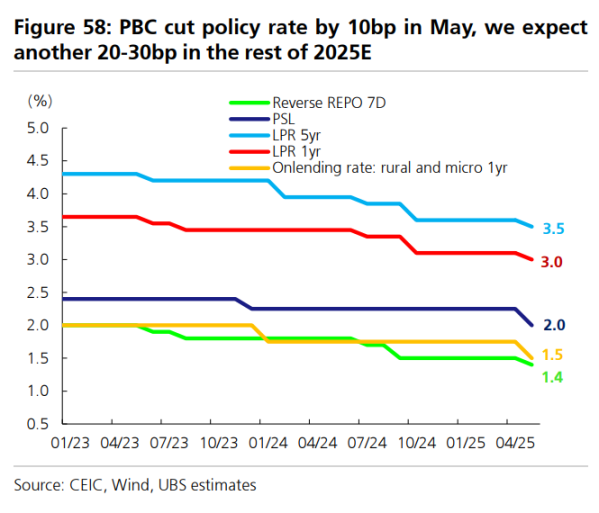
At the March National People’s Congress, China set a GDP growth target of “around 5%” and announced moderate policy stimulus. Broad fiscal deficits are expected to expand by 1.5–2% of GDP, with monetary and credit policy set to “moderately loose.” UBS expects policy rates to be cut by 30–40 basis points.
In terms of implementation, the PBOC cut policy rates by 10 basis points and reserve requirement ratios by 50 basis points in May, and launched new re-lending facilities to support consumption and innovation. Net issuance of government bonds in the first half was strong, driving credit growth to an 8.8% year-on-year pace in June.
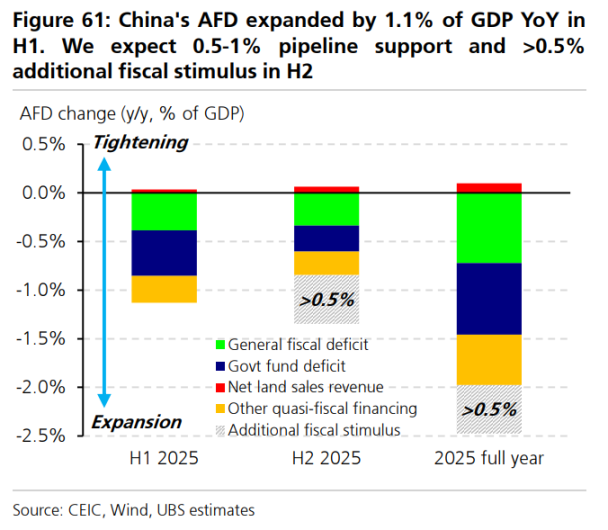
UBS estimates China’s broad fiscal deficit expanded by 1.1% of GDP year-on-year in the first half. It expects the remainder of planned fiscal stimulus (0.5–1% of GDP) to be delivered in the second half, along with potential additional stimulus exceeding 0.5% of GDP, possibly timed for late Q3.
In addition, UBS expects another 20–30 basis point cut in policy rates.
Join TechFlow official community to stay tuned
Telegram:https://t.me/TechFlowDaily
X (Twitter):https://x.com/TechFlowPost
X (Twitter) EN:https://x.com/BlockFlow_News