
On-Chain Data School (7): A Novel BTC Valuation Methodology Co-Developed by ARK (II)
TechFlow Selected TechFlow Selected
On-Chain Data School (7): A Novel BTC Valuation Methodology Co-Developed by ARK (II)
This article will introduce one of the methodology applications for Cointime Price to time the market top.
Author: Mr. Berg
🔸TL;DR
- This is the second article in the Cointime Price series, which will consist of three articles.
- We strongly recommend reading the previous article in this series first!
- This article introduces one application methodology of Cointime Price for identifying market tops.
- Personal model sharing: The Cointime Price Deviation Model.
🟡 Brief Review of Cointime Price
Cointime Price is a concept introduced in Cointime Economics. Through its "time-weighted" design, it provides a more flexible and sensitive assessment of BTC's fair value compared to simple LTH (Long-Term Holder) or STH (Short-Term Holder) metrics.
Additionally, this framework effectively eliminates the influence of long-lost coins from ancient times.
For readers unfamiliar with Cointime Price, we strongly recommend reviewing the previous article before continuing.
🟡 Application Methodology for Identifying Market Tops: The Cointime Price Deviation Model
The Cointime Price Deviation Model is one of the models I personally developed while researching on-chain data. Below, I will explain the design principles behind this model and how we can use it to identify potential market tops.
- Quantify the deviation between the current price and the Cointime Price.
Since the Cointime Price largely represents the true cost basis of BTC holdings—more precisely, the cost basis of "long-term holders" (as longer holding periods have greater weight in influencing Cointime Price)—a significant deviation between the current price and Cointime Price theoretically increases the incentive for long-term holders to take profits and distribute their supply.
I define the deviation ratio (distribution ratio) using the following formula:
Deviation Ratio = (Current Price – Cointime Price) / Current Price
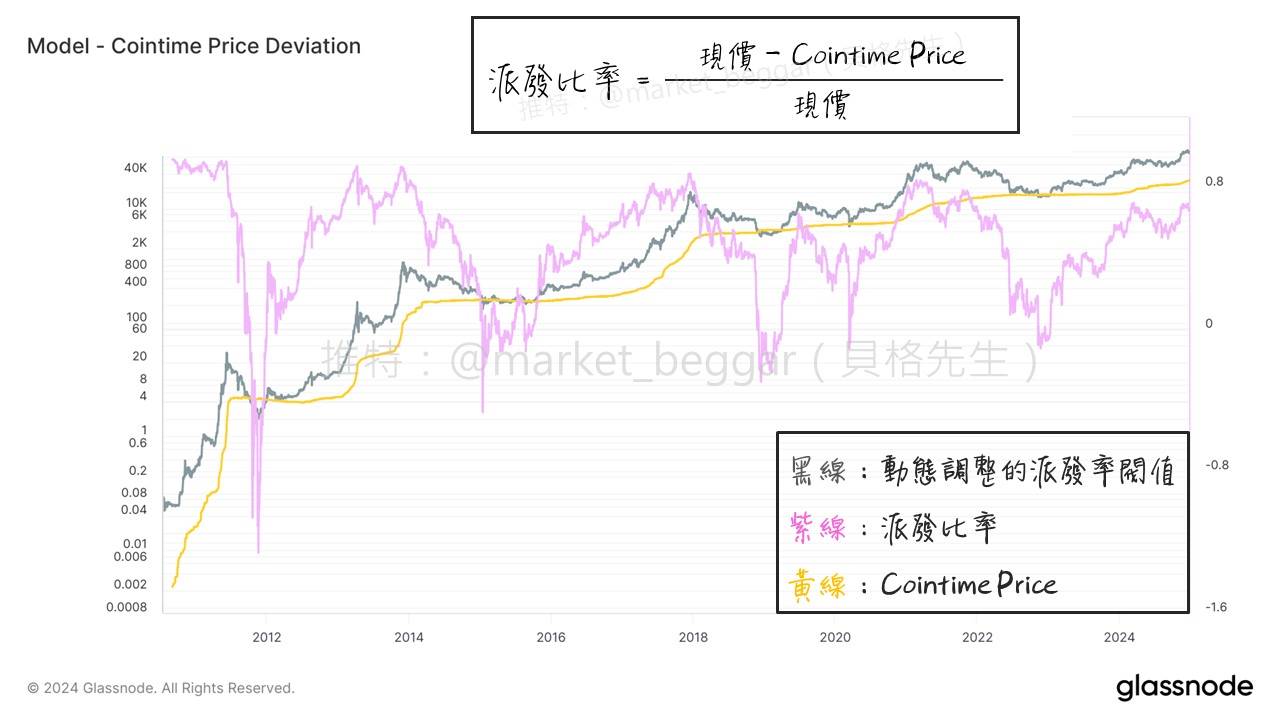
As shown in the chart above, we obtain the distribution ratio (purple line). It becomes evident that peaks in the distribution ratio consistently coincide with market tops.
Given this observation, what exactly constitutes a "high" level?
To address this, I apply a statistical approach to define what qualifies as "high," detailed below.
- Defining Extreme Values in the Cointime Price Deviation
Looking again at the chart above, you’ll notice that defining “high” levels for Deviation isn’t straightforward. The peak deviation values at each bull market top show a slightly declining trend over time. Therefore, setting a fixed numerical threshold would clearly lack rigor.
To solve this, I employ the statistical concept of “standard deviation”:
- Calculate the historical average and standard deviation of the Deviation values.
- Define “high” as “average + n standard deviations,” referred to hereafter as the Threshold.
- Apply a moving average smoothing process to the Deviation values.
- Generate a top signal when the smoothed Deviation value exceeds the Threshold.
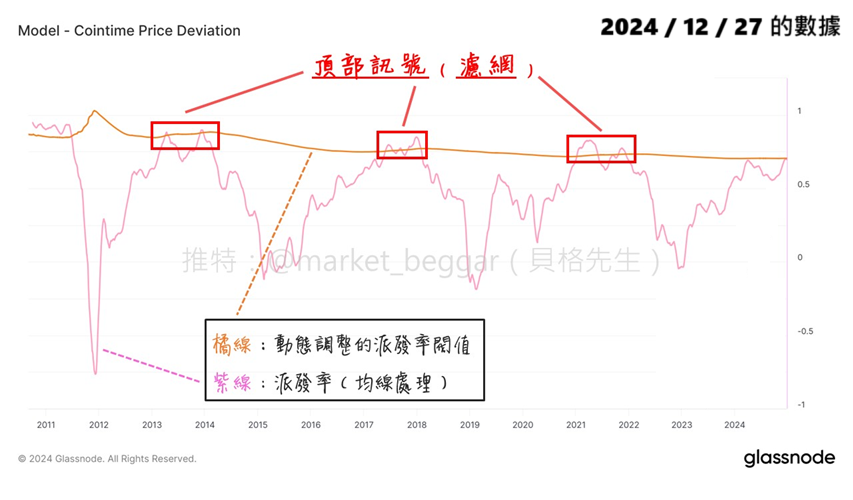
After applying the above processing, we arrive at the chart shown above.
Two additional notes:
- The parameter “n” in “average + n standard deviations” is adjustable. A larger “n” makes the signal condition stricter.
- The moving average smoothing is primarily used to filter out noise.
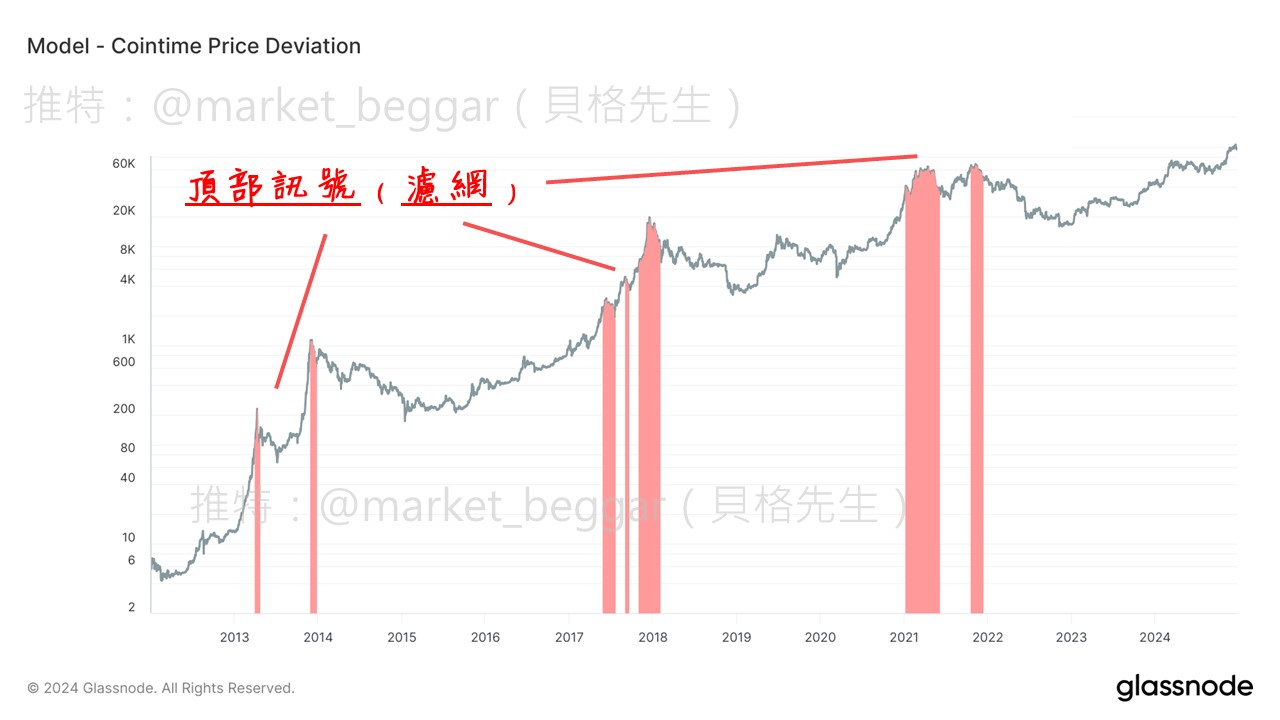
When marking the periods where the purple line (Deviation) exceeds the orange line (Threshold) onto the price chart, we obtain the signals shown in the chart above.
Join TechFlow official community to stay tuned
Telegram:https://t.me/TechFlowDaily
X (Twitter):https://x.com/TechFlowPost
X (Twitter) EN:https://x.com/BlockFlow_News