Wednesday's CPI "cooling ≠ safe," tariff impact peak to emerge in 3–6 months
TechFlow Selected TechFlow Selected
Wednesday's CPI "cooling ≠ safe," tariff impact peak to emerge in 3–6 months
The real test begins with the CPI data for March-April.
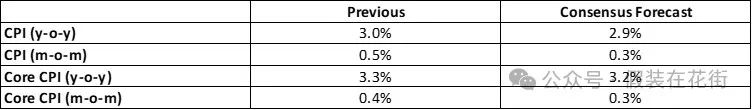
The U.S. February CPI data will be released this Wednesday, with market consensus expecting a slight cooling in inflation.
However, even if the data meets expectations (headline CPI +0.3% MoM, core +0.3% MoM), the annualized inflation rate would still be as high as 3.9%, nearly double the Fed's target—far from a moment to become optimistic.
We need to see monthly increases fall to 0.2% or lower before the market can confidently turn bullish. But caution is warranted due to potential data noise (e.g., energy price fluctuations). If actual data disappoints and comes in higher than expected, markets may face another sharp sell-off.
Secondly, we must pay attention to the lagged impact of tariffs:
-
In early February, the U.S. imposed an additional 10% tariff on Chinese imports, affecting furniture (32% of imports), apparel (26%), and electronics (21%).
-
This is expected to push February’s core goods inflation (excluding used cars) back up to 0.2% (from -0.1% in January), with educational goods seeing the most pronounced effect—prices up 2.8% MoM (vs. 0.1% in January). Some short-term price volatility may stem from inventory hoarding by firms, though such effects are unlikely to persist.
The real risk lies ahead: import data typically lags by 1–2 months. Even if this month’s CPI doesn’t reflect tariff impacts, March and April CPI readings are highly likely to face a second wave of pressure.
Shipping from China to the U.S. takes 25–35 days on average; goods shipped after February 1 won’t arrive until early March. After 1–2 weeks for customs clearance, the added tariff costs will begin flowing into wholesalers’ cost structures by mid-to-late March. Most products currently sold by U.S. retailers are drawn from Q4 2023 inventories—before the new tariffs—while newly procured, tariff-impacted goods will only enter retail channels starting in April.
Therefore, March and April CPI prints will mark the true test.
1. Home goods: wholesale costs rise in March, with retail prices potentially adjusted in April–May (estimated +0.3%–0.5% MoM);
2. Apparel: spring collection costs up 5%–8%, with the apparel component of April CPI likely turning positive MoM;
3. Consumer electronics: smartphones and accessories to rise 3%–5% starting March (e.g., Anker has already announced a price hike for April).
Historical Reference: Lessons from the 2018 Trade War
In July 2018, the U.S. imposed a 25% tariff on $34 billion worth of Chinese goods. The peak impact on CPI typically emerged about two quarters after policy implementation.
-
CPI rose with a 3-month lag: apparel CPI jumped 0.5% MoM in October 2018 (up from 0.1% previously);
-
Peak impact came after a 6-month lag: home furnishings CPI reached 3.2% YoY in January 2019 (up from 1.5% pre-tariff).
Therefore, if the market focuses solely on February’s data and concludes that “the worst is behind us,” it risks serious misjudgment. This concern stems from observing how quickly bond yields have recently declined, as risk-off moves in equities have dampened inflation expectations. Rate markets still price in around two rate cuts this year, suggesting they’ve largely anticipated a benign CPI print. Should the data meet expectations while rate-cut bets remain unchanged, the market would effectively be underestimating the risk of inflation rebounding.
If core goods inflation rebounds to over 0.4% in March (a high-probability scenario), the Fed may be forced to reevaluate its stance that “inflation is under control,” potentially wiping out 2025 rate cut expectations entirely.
Additionally, January’s nonfarm payroll report showed average hourly earnings up 4.3% YoY, reflecting persistently high labor costs in the services sector, which could feed through to further price hikes. Whether this triggers a wage-inflation spiral is another key development to monitor beyond tariffs.
High-frequency indicators to watch:
1. U.S. Import Price Index (to be released March 15): directly reflects tariff pass-through;
2. Retailer earnings call transcripts (e.g., Walmart, Best Buy in April): monitor management commentary on pricing pressures.
Join TechFlow official community to stay tuned
Telegram:https://t.me/TechFlowDaily
X (Twitter):https://x.com/TechFlowPost
X (Twitter) EN:https://x.com/BlockFlow_News