In the early hours of this Thursday, it wasn't the interest rate cut itself that determined the direction of risk assets
TechFlow Selected TechFlow Selected
In the early hours of this Thursday, it wasn't the interest rate cut itself that determined the direction of risk assets
Rate cuts are almost a "given," the real variables lie elsewhere.
By David, TechFlow
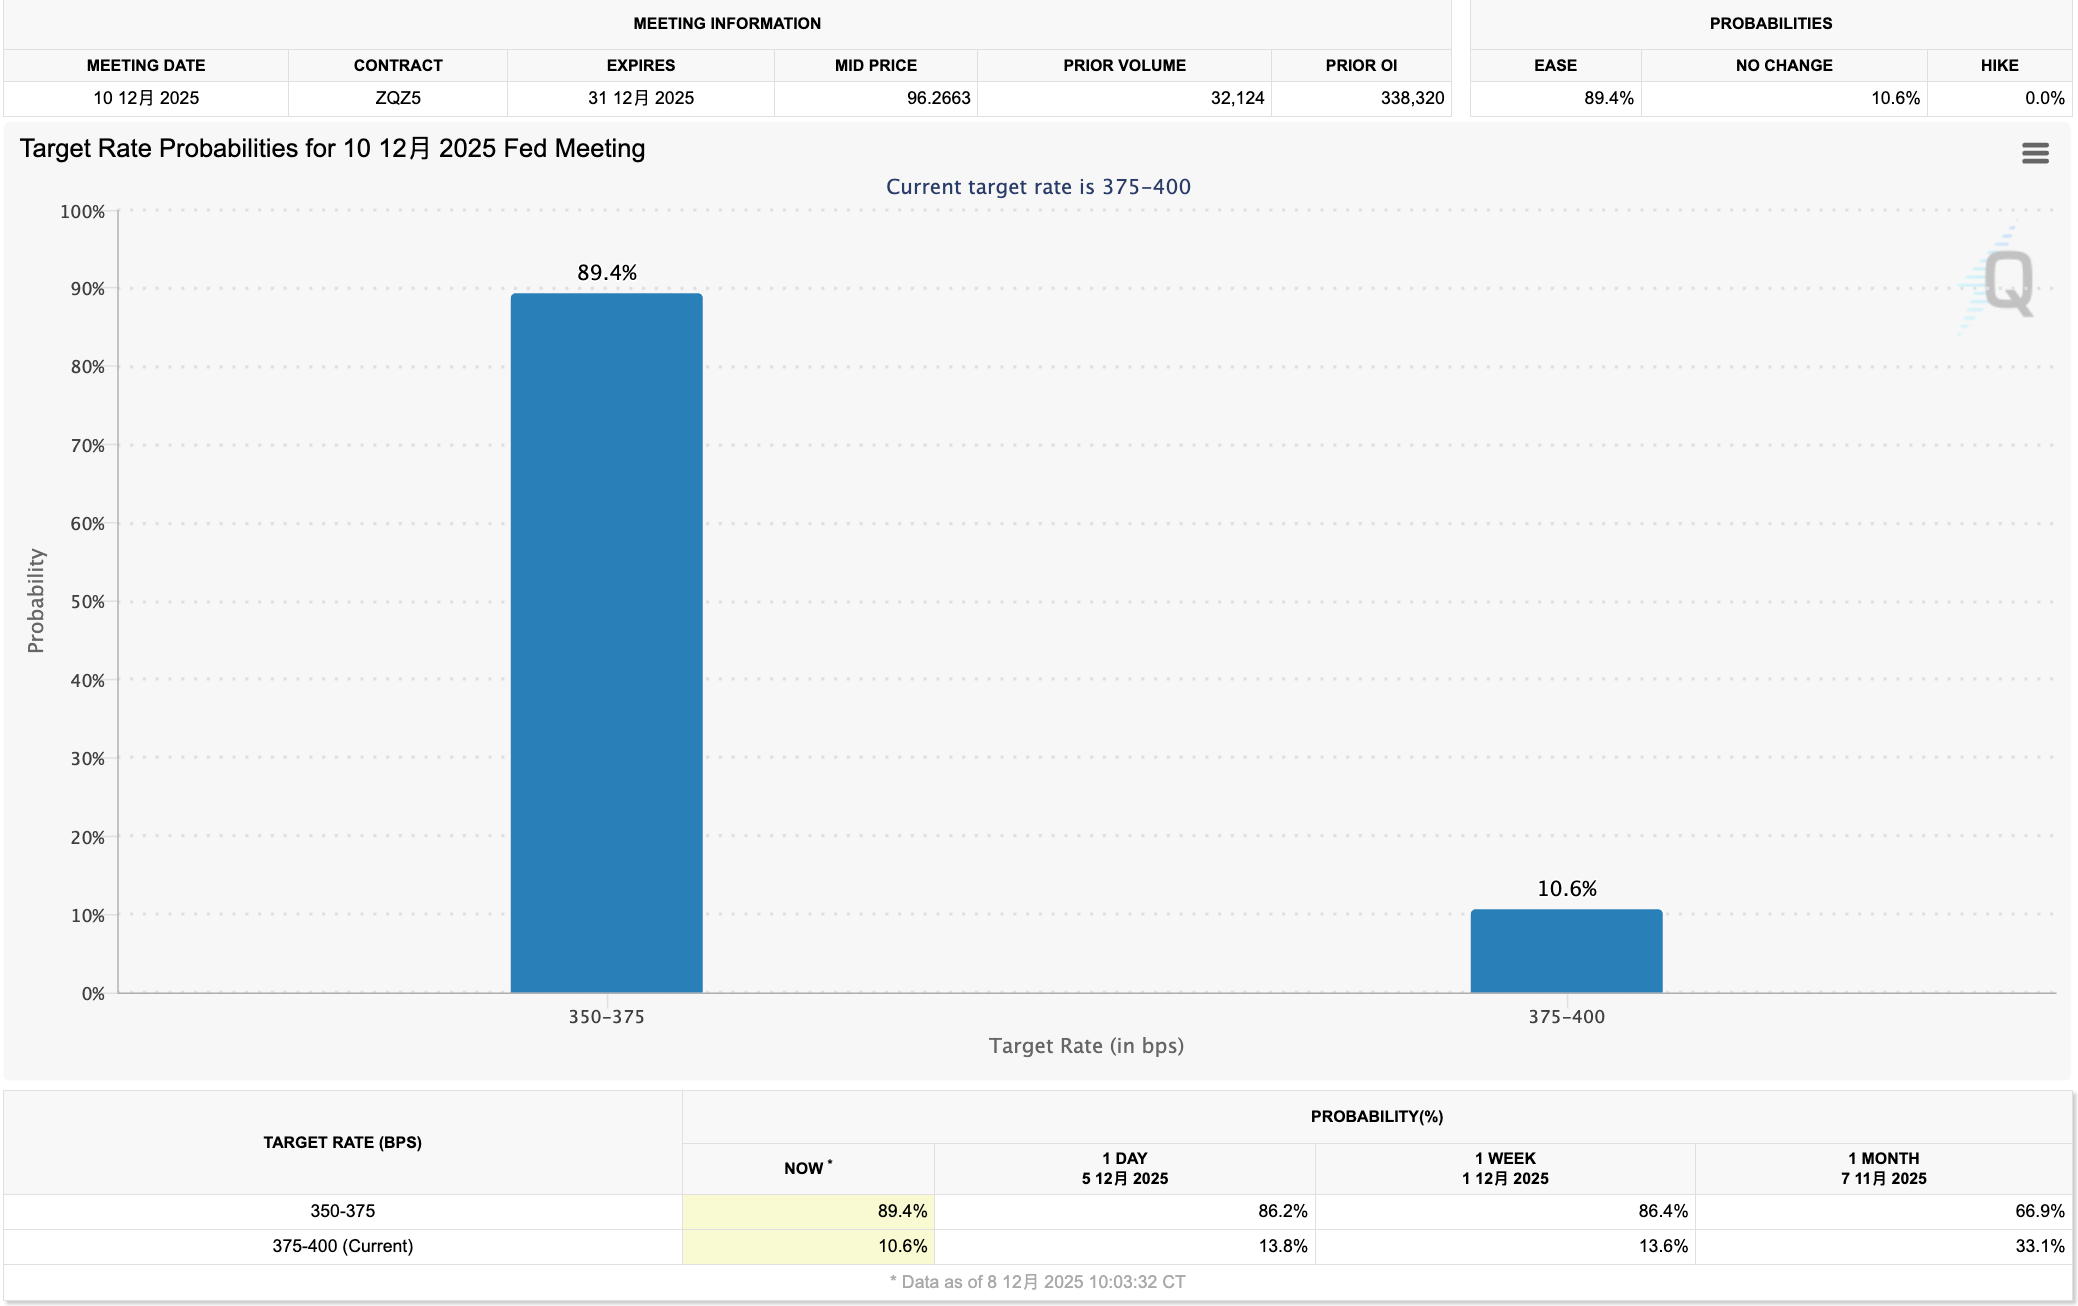
This Thursday (Beijing time), the Federal Reserve will announce its final interest rate decision of the year. Market expectations are highly aligned:
According to CME FedWatch data, there is over an 85% probability of a 25 basis point rate cut.
If implemented, this will mark the third consecutive rate cut since September, bringing the federal funds rate down to the 3.5%-3.75% range.
To crypto investors accustomed to the narrative of "rate cuts = bullish", this sounds like good news.
But the problem is, when everyone expects a rate cut, the cut itself no longer drives the market.
Financial markets are machines of expectation. Prices reflect not "what happened," but "what happened relative to expectations."
An 85% probability means the rate cut has already been largely priced in; unless there's a surprise, the market reaction when the announcement comes early Thursday morning will likely be muted.
So what’s the real variable?
The Fed's stance on next year. A 25-basis-point cut is almost certain, but how long the easing cycle will last and how many more cuts might occur in 2026—these are the factors markets are truly pricing in.
On Thursday morning, the Fed will also release its updated projections for the future path of interest rates. These forecasts often have a bigger impact on markets than the rate decision itself.
But this time, there's an added complication: the Fed itself may not have a clear view.
The reason is that from October 1 to November 12, the U.S. federal government shut down for 43 days. During this period, statistical agencies suspended operations, leading to the cancellation of the October CPI release and the delay of the November CPI to December 18—over a week after this FOMC meeting.
This means Fed officials will be discussing the rate outlook without access to the most recent two months of inflation data.
When policymakers are essentially navigating blind, their guidance becomes more ambiguous—and ambiguity often opens the door to greater market volatility.
Here's this week’s timeline:
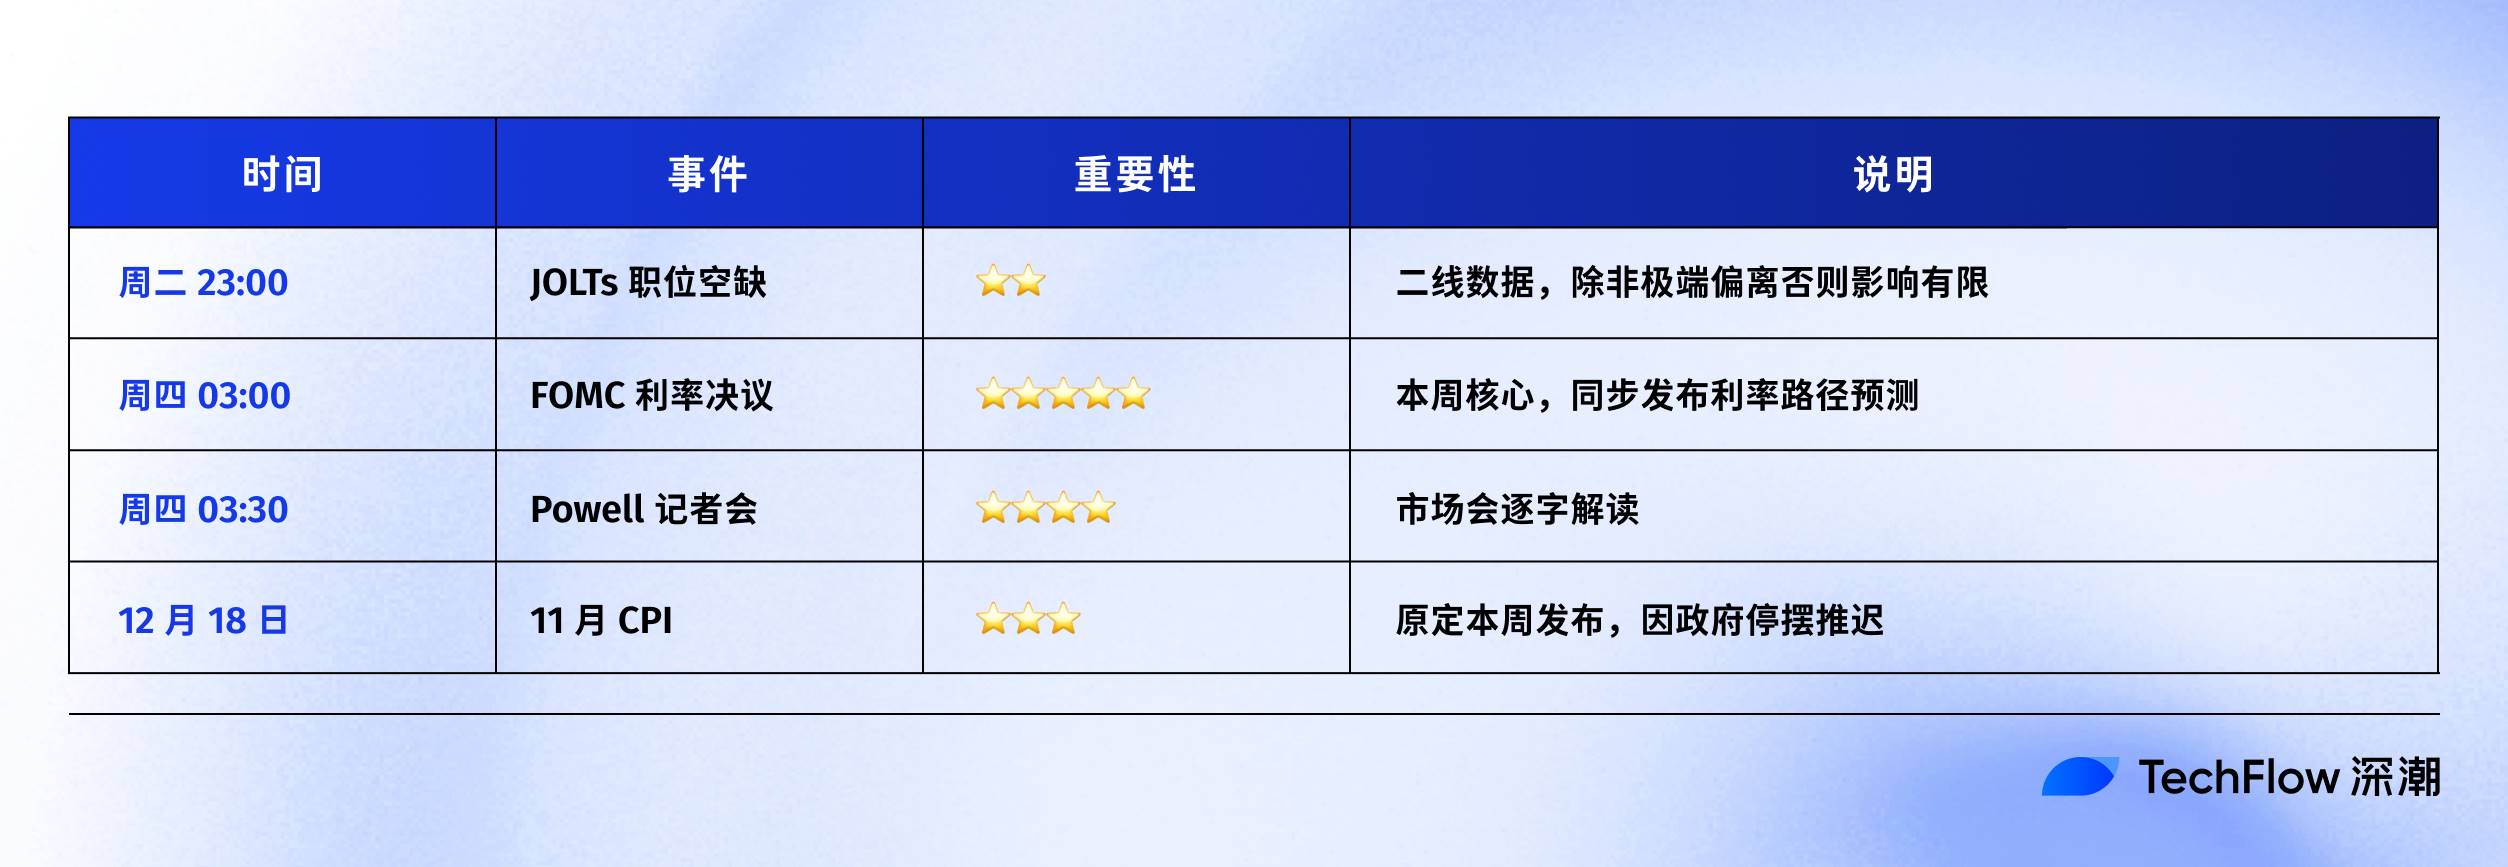
We can analyze what signals the Fed might send and the corresponding market reactions.
Betting on Next Year’s Outlook
After each FOMC meeting, the Fed releases the Summary of Economic Projections (SEP).
It includes a chart showing all Fed members' expectations for future interest rates.
Each member places a dot indicating where they believe the year-end rate should be. Because it looks like a scatter of dots, the market commonly refers to it as the "dot plot." You can find original dot plots on the Federal Reserve website.
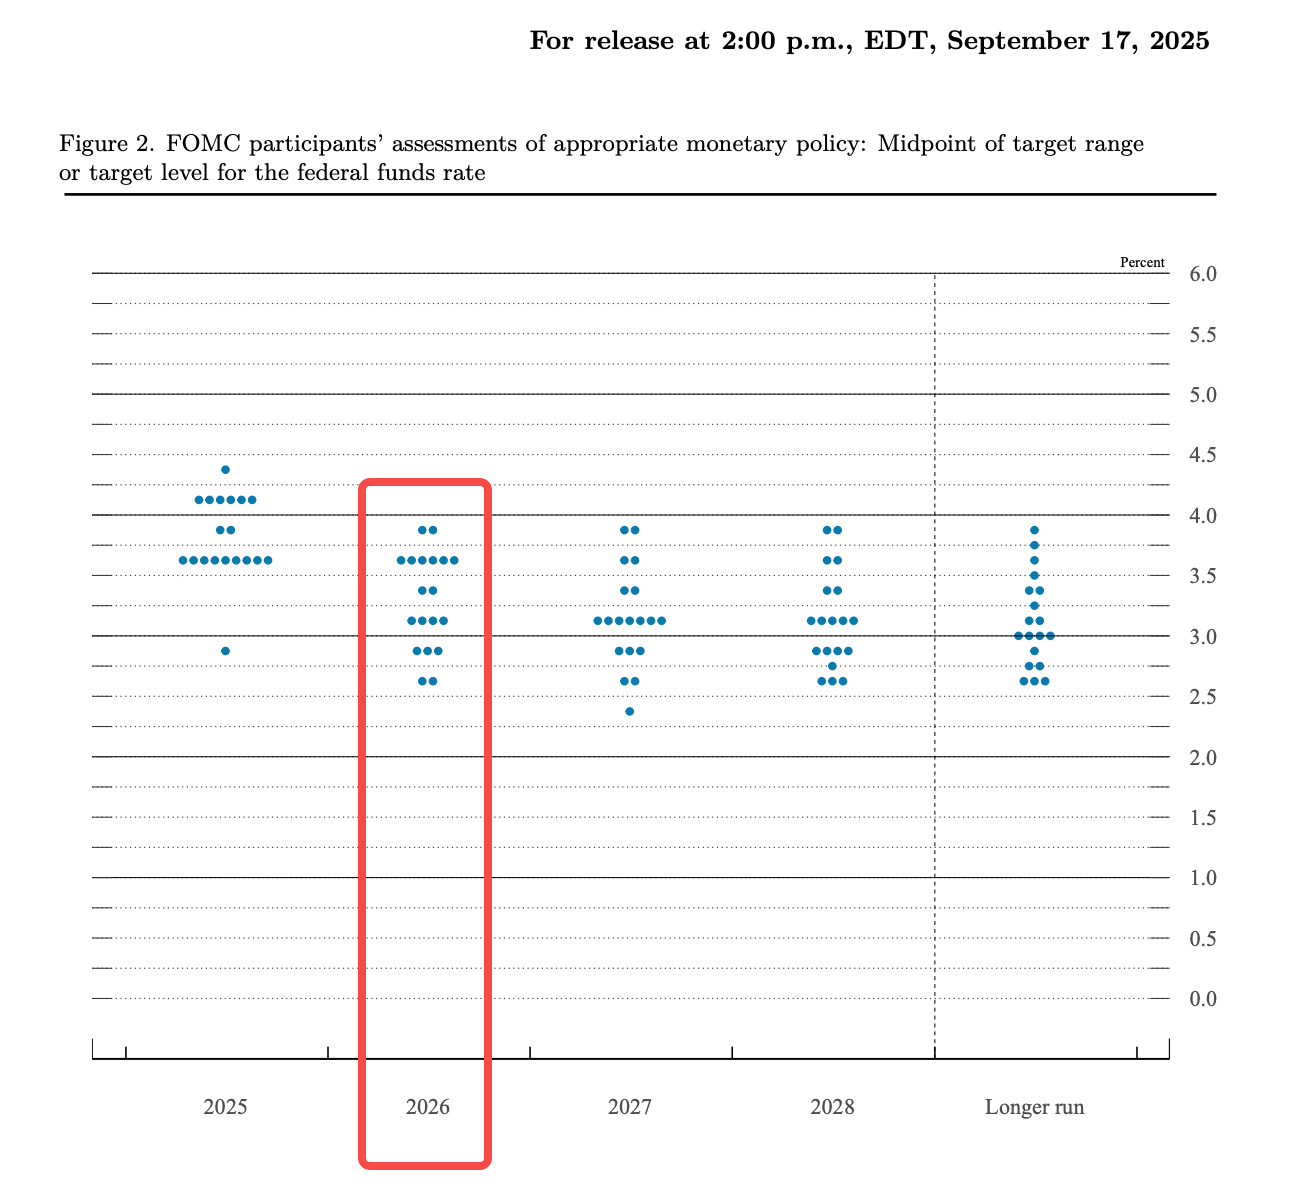
Below is the dot plot released at the FOMC meeting on September 17.
It reveals both divisions and consensus within the Fed. If the dots cluster together, it suggests alignment among members and a clearer policy path;
If they're widely scattered, it indicates internal disagreement and greater uncertainty ahead.
For the crypto market, uncertainty itself is a risk factor. It suppresses risk appetite, making investors more likely to stay on the sidelines rather than enter the market.
From the chart, we see that in the 2025 column, the dots are concentrated in two areas: around 8-9 dots near 3.5%-3.625%, and another 7-8 near 3.75%-4.0%. This shows a split within the committee:
One faction believes there should be one or two more cuts this year, while the other thinks the Fed should pause or cut only once. The median falls around 3.6%, meaning the baseline expectation of the majority is for two more cuts in 2025 (including this week’s).
Looking at 2026, the divergence among Fed members is even wider.
Current rates are at 3.75%-4.00%. If rates fall to around 3.4% by end of next year, that implies only 1-2 cuts. But on the chart, some members expect rates to drop to 2.5% (equivalent to 4-5 cuts), while others believe they should remain at 4.0% (no cuts at all).
Within the same committee, the gap between the most aggressive and most conservative views spans six potential cuts. This is a "highly divided" Fed.
And that division itself is a signal.
If the Fed can't agree internally, the market will vote with its feet. Currently, traders are positioning more aggressively than official guidance suggests. CME FedWatch shows market pricing implies 2-3 rate cuts in 2026, while the median of the official dot plot shows only one.
Thus, this Thursday’s FOMC meeting is, in a way, a "synchronization" moment between the Fed and the market: will the Fed align with market expectations, or stick to its own pace?
Three Scenarios, Three Reactions
Based on current information, there are roughly three possible paths for this FOMC meeting.
-
The most likely scenario is "in line with expectations": a 25bp cut, the dot plot maintains the guidance from the September meeting, and Powell repeatedly emphasizes "data dependence" during the press conference without offering a clear direction.
In this case, the market won’t move much. The cut is already priced in, guidance remains unchanged, and there’s no new trading signal. Crypto markets will likely follow U.S. equities with minor fluctuations before reverting to their prior trend.
This is also the base case expected by most Wall Street institutions; recent reports from Goldman Sachs and Raymond James point in this direction.
-
The second possibility is "dovish tilt": a 25bp cut, but the dot plot shows two or more cuts projected for 2026, and Powell uses softer language, emphasizing labor market risks over inflation risks.
This would mean the Fed is aligning with market expectations, confirming a dovish path. A weaker dollar would boost dollar-denominated assets, and improved liquidity expectations would lift market sentiment. BTC and ETH could rally alongside U.S. stocks, with BTC potentially testing recent highs.
-
The least likely but still possible scenario is "hawkish tilt": despite a 25bp cut, Powell stresses persistent inflation and signals limited room for further easing in 2026; or multiple dissenting votes emerge, indicating internal resistance to continued easing.
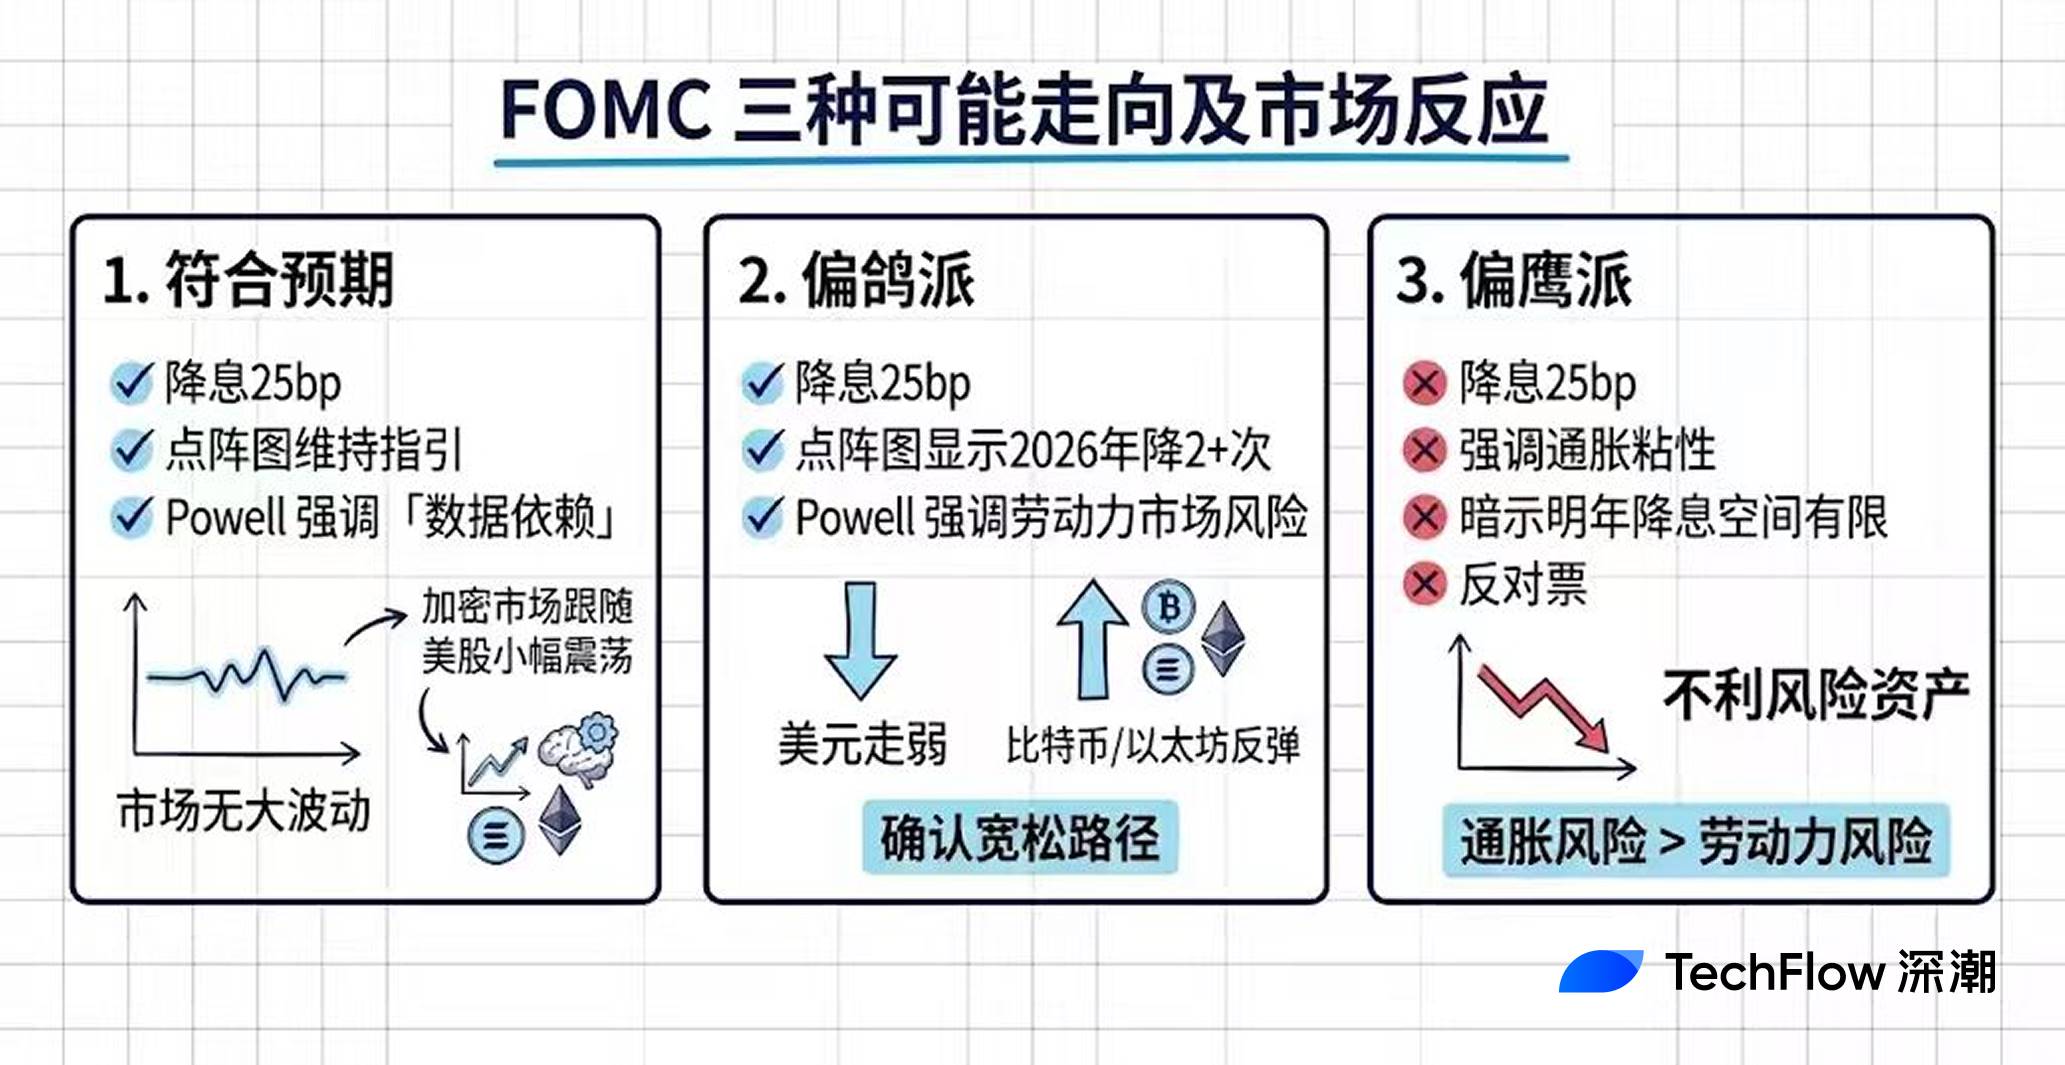
This sends the message: "You’re overestimating the ease." A stronger dollar, tighter liquidity expectations, and pressure on risk assets would follow. The crypto market could face short-term pullbacks, especially high-beta altcoins.
However, if the shift is only in tone rather than actual policy, the downside may be limited and could even present an entry opportunity.
Under normal circumstances, the Fed adjusts the dot plot based on the latest data. But this time, due to the government shutdown, two months of CPI data are missing, forcing decisions based on incomplete information.
This creates ripple effects. First, the dot plot’s reliability is diminished; with members uncertain themselves, the dots may be even more scattered.
Second, the weight of Powell’s press conference increases—markets will scrutinize every word for directional clues. If the dot plot and Powell’s tone contradict each other, confusion rises and volatility could amplify.
For crypto investors, this means Thursday’s market action could be harder to predict than usual.
Rather than betting on direction, focus on volatility itself. When uncertainty rises, managing position size becomes more important than predicting price moves.
Tonight’s JOLTs Data Isn’t as Important as You Think
So far we’ve discussed Thursday’s FOMC, but tonight (Beijing time, Tuesday at 23:00) another data point is scheduled: JOLTs.
Social media sometimes overstates its importance, calling it something like "quietly shaping liquidity trends." But truthfully, JOLTs carries relatively low weight among macro indicators. If you’re short on time, focusing on Thursday’s FOMC is sufficient;
If you want more context on the labor market, keep reading.
JOLTs stands for Job Openings and Labor Turnover Survey. Published monthly by the U.S. Bureau of Labor Statistics (BLS), it tracks how many jobs are open, how many people are hired, and how many leave their jobs.
The most watched figure is "job openings": higher numbers suggest strong hiring demand and a tight labor market.
At its peak in 2022, this number exceeded 12 million, signaling fierce competition for workers, rapid wage growth, and Fed concerns about inflationary pressure. Now, it has fallen to around 7.2 million, close to pre-pandemic normal levels.
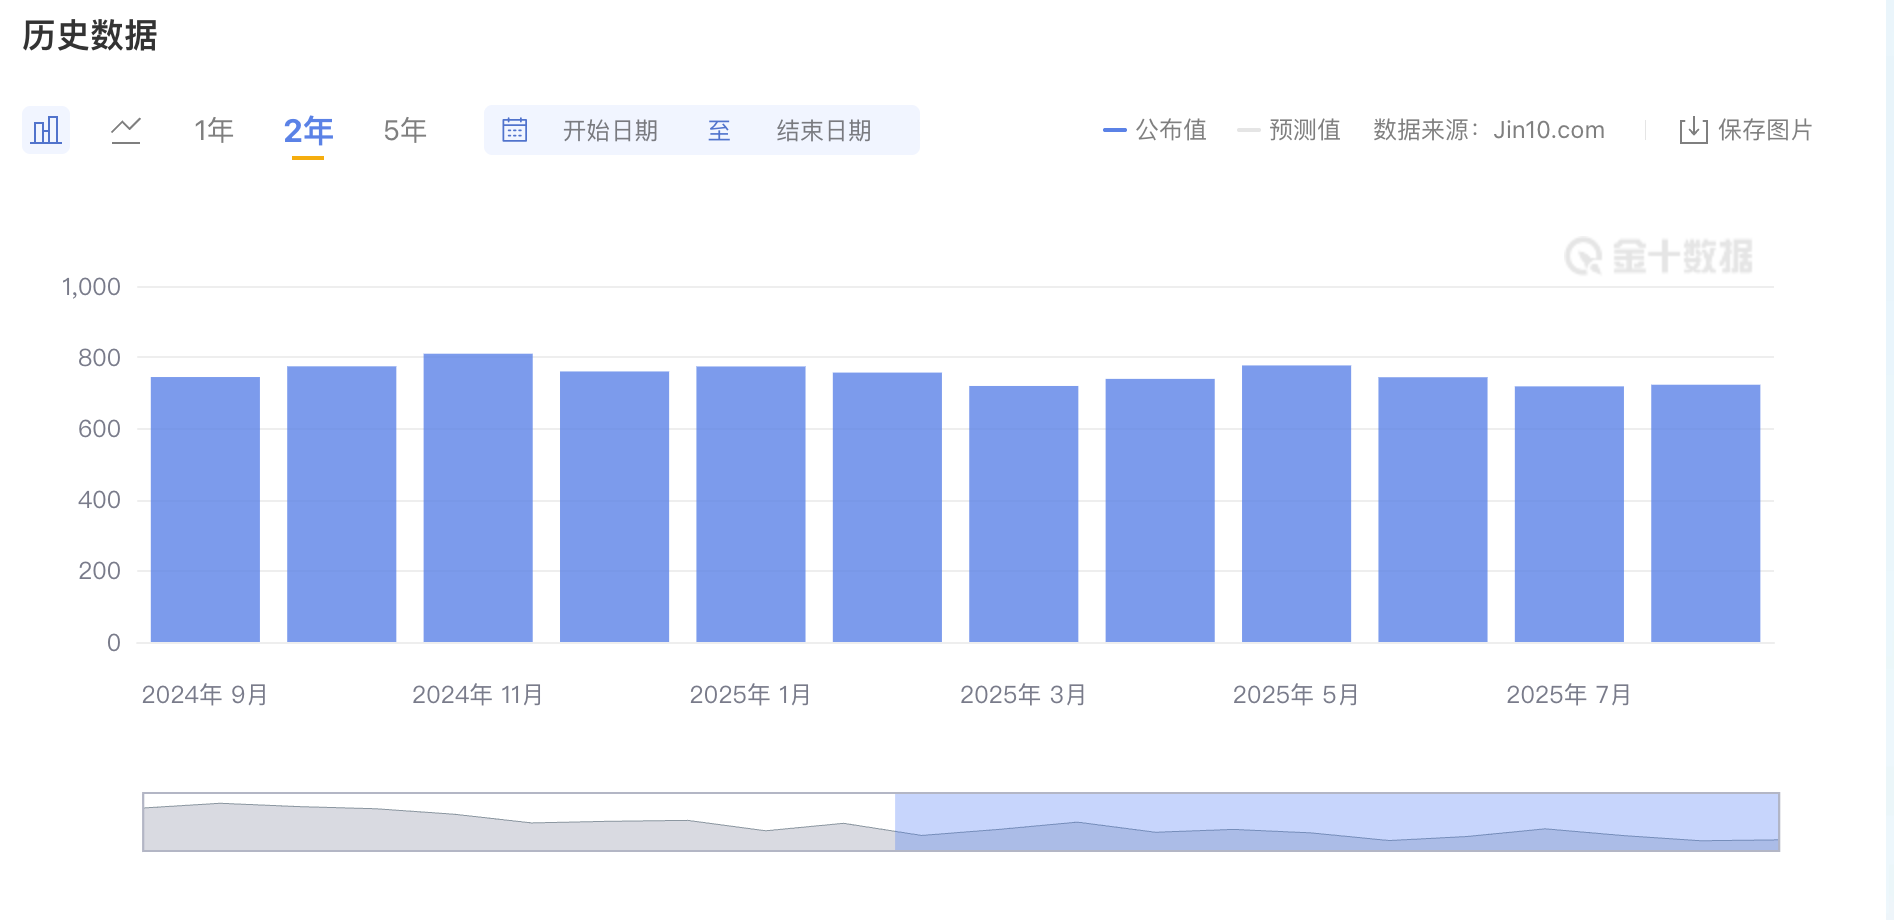
Image source: Jinshi Data
Why is this indicator possibly overrated?
First, JOLTs is a lagging indicator. Tonight’s release covers October data—but we’re already in December. Markets prefer timelier data, such as weekly initial jobless claims or the monthly nonfarm payrolls report.
Second, an expected job openings figure around 7.1 million isn’t considered "overheated." Analysts have noted that the ratio of job openings to unemployed persons fell below 1.0 in August, meaning there are now fewer vacancies than job seekers.
This is completely different from 2022, when one job seeker faced two open positions. The narrative of an "overheated" labor market is already outdated.
According to forecasts from LinkUp and Wells Fargo, tonight’s October JOLTs number will likely be around 7.13–7.14 million, not much changed from the previous 7.2 million.
If the data meets expectations, the market will barely react. It simply confirms the existing story of a gradually cooling labor market, without altering anyone’s Fed expectations.
Tonight’s data is more of an appetizer before the main course on Thursday morning.
What Will Happen to My BTC?
The previous sections focused on macro data, but you probably care more about one thing: how do these factors affect your BTC and ETH holdings?
Short answer: they do, but not as simply as "rate cut = price up."
Fed rate decisions influence crypto through several channels.
First, the U.S. dollar. Rate cuts reduce returns on dollar-denominated assets, prompting capital to seek alternatives. When the dollar weakens, dollar-priced assets—including BTC—tend to perform better.
Second, liquidity. In a low-rate environment, borrowing costs are lower, increasing available capital, some of which flows into risk assets. The 2020–2021 bull run was largely fueled by the Fed’s unlimited quantitative easing.
Third, risk appetite. When the Fed signals dovishness, investors become more willing to take risks, shifting money from bonds and money market funds into stocks and cryptocurrencies. Conversely, hawkish signals trigger capital flight into safe havens.
Together, these form the transmission chain: Fed policy → dollar/liquidity → risk appetite → crypto assets.
Theoretically, BTC today holds two popular identities: "digital gold" or "risk asset."
If it's digital gold, it should behave like physical gold—rising during market panic and negatively correlated with equities. If it's a risk asset, it should move with the Nasdaq, performing well during periods of loose liquidity.
In practice, over recent years BTC has behaved more like the latter.
According to CME research, BTC’s correlation with the Nasdaq 100 rose from near zero in 2020 to around 0.4, sometimes exceeding 0.7. The Kobeissi Letter recently noted that BTC’s 30-day correlation reached 0.8—the highest since 2022.
But a curious shift has emerged lately. According to CoinDesk, BTC’s correlation with the Nasdaq has dropped to -0.43 over the past 20 days, showing a clear negative correlation.
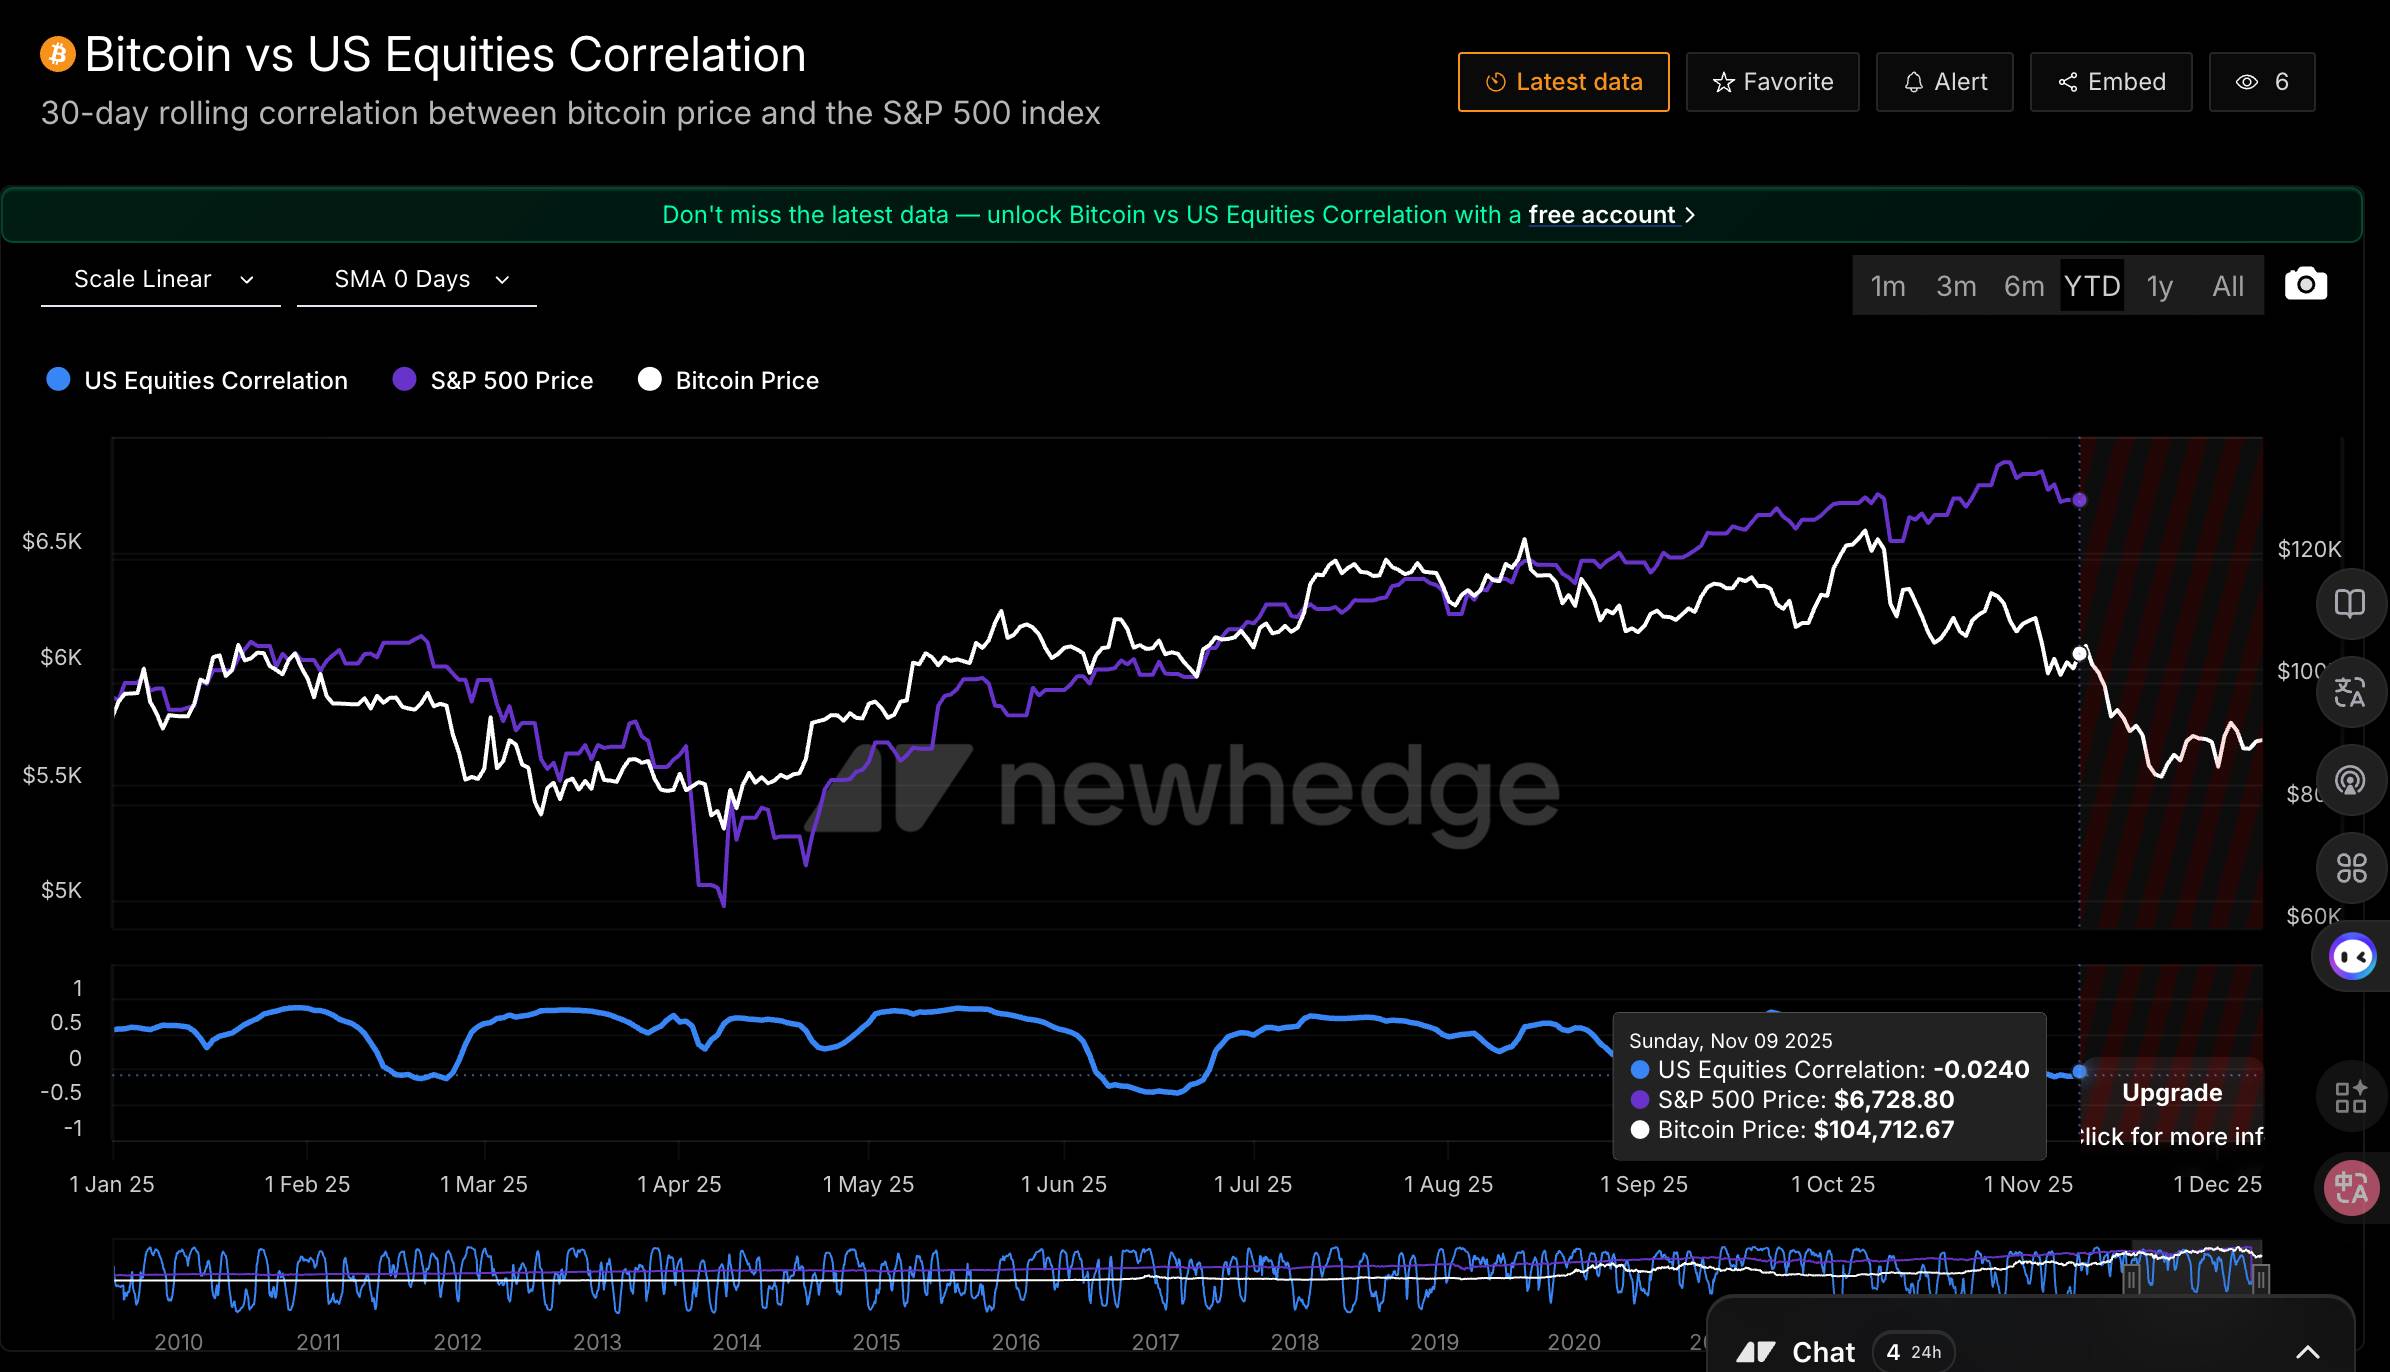
Data source: https://newhedge.io/
The Nasdaq is just 2% from its all-time high, while BTC has fallen 27% from its October peak.
Market maker Wintermute offers an explanation: BTC currently shows "negative skew"—it drops more when stocks fall, but reacts weakly when stocks rise. In their words, BTC "only exhibits high beta in the wrong direction."
What does this mean?
If the FOMC delivers a dovish signal and stocks rally, BTC may not rebound in sync. But if the Fed turns hawkish and stocks fall, BTC could drop even harder. This is an asymmetric risk structure.
Summary
After all this, here’s a framework for ongoing monitoring.
What to watch this week (December 9–12)?
The core event is Thursday’s FOMC. Focus on three things: whether the dot plot changes, particularly the median rate expectation for 2026; whether Powell’s press conference leans dovish or hawkish; and whether there are multiple dissenting votes.
What to watch mid-December?
The delayed November CPI will be released on December 18. If inflation rebounds, markets may reprice 2026 rate cut expectations, challenging the narrative of continued Fed easing.
What to watch in Q1 2026?
First, leadership changes at the Fed. Powell’s term ends in May 2026.
Second, the ongoing impact of Trump-era policies. If tariff policies expand further, they could sustain higher inflation expectations, limiting the Fed’s room to ease.
Additionally, monitor whether the labor market deteriorates faster. Rising layoffs could force the Fed to accelerate rate cuts, triggering a different scenario altogether.
Join TechFlow official community to stay tuned
Telegram:https://t.me/TechFlowDaily
X (Twitter):https://x.com/TechFlowPost
X (Twitter) EN:https://x.com/BlockFlow_News