Another plunge? Liquidation data underestimated, market risks far exceed imagination
TechFlow Selected TechFlow Selected
Another plunge? Liquidation data underestimated, market risks far exceed imagination
Clearing data disclosed by CEXs is often significantly lower than the actual clearing activities that occur.
Author: Three Sigma
Compiled by: TechFlow

Traders get liquidated, billions of dollars vanish overnight. But what if the actual scale of liquidations is 19 times higher than reported? We dug into the data and found the situation is far worse than you might imagine.
1. Liquidation
Today, the barrier to entry for trading has become lower than ever, allowing ordinary people to participate easily. Whether through flashy courses offered by so-called "mentors" or as an alternative to traditional jobs, trading seems to offer an ideal lifestyle: work from home with just a computer and potentially earn substantial income.
But reality is far more complex. If trading were truly that easy, everyone would be winning. In fact, most who attempt it end up losing money—or getting wiped out. So what causes these losses? The answer often points to one word every trader fears: liquidation.
Liquidation is a core mechanism in leveraged trading. When a trader's collateral or margin becomes insufficient to cover losses from open positions, exchanges automatically step in to close those positions, preventing further losses for both traders and platforms.
Depending on the severity of the margin shortfall and the platform’s risk management system, liquidations typically fall into two categories:
-
Partial liquidation: Only part of the trader’s position is reduced, while the remainder stays active in the market. This reduces risk while allowing continued market participation.
-
Full liquidation: All positions are closed immediately, completely eliminating the trader’s exposure. This is more common in high-leverage trading, where even minor price movements can wipe out a trader’s entire collateral.
Main Causes of Liquidation
Liquidations usually stem from an imbalance between risk and margin. Below are key factors leading to liquidation:
-
Leverage: Leverage allows traders to control larger positions with less capital, but it also amplifies risk. The higher the leverage, the smaller the price movement needed to trigger liquidation. For example, at 50x leverage, just a 2% price move can wipe out all collateral. Thus, risk management is critical in leveraged trading.
-
Maintenance Margin: Each exchange sets a minimum margin requirement. Traders must maintain this level to keep their positions open. Maintenance margin acts as a "safety buffer." When losses cause margin to drop below this threshold, the exchange forces liquidation to prevent deeper losses. Failure to monitor these requirements can quickly lead to forced liquidation.
-
Market Volatility: Sharp price swings are the biggest enemy of high-leverage traders. Volatility rapidly erodes margin, leaving little time for reaction. Additionally, during high volatility, "cascading liquidations" often occur: one liquidation triggers a chain reaction, pushing prices further against open positions and worsening losses.

Market Squeeze
One of the most dramatic and rapid triggers of liquidation is the "squeeze." This occurs when sharp price movements force traders on the wrong side of the market to exit their positions. Squeezes are typically driven by high leverage and low liquidity, creating a snowball effect that accelerates price changes and intensifies market volatility.
When prices rise sharply, short sellers face immense pressure as their collateral becomes inadequate. To avoid greater losses, they must buy back assets to close positions—this buying further drives prices up. This cycle often escalates into a cascade of liquidations: one trader’s forced exit pushes prices higher, triggering more liquidations.
Conversely, when prices drop suddenly, long-position holders face similar risks. As collateral value shrinks, they’re forced to sell to meet margin requirements. This selling exacerbates the downward trend. Increased selling pressure pushes prices lower, triggering more liquidations and ultimately forming a "downward spiral."
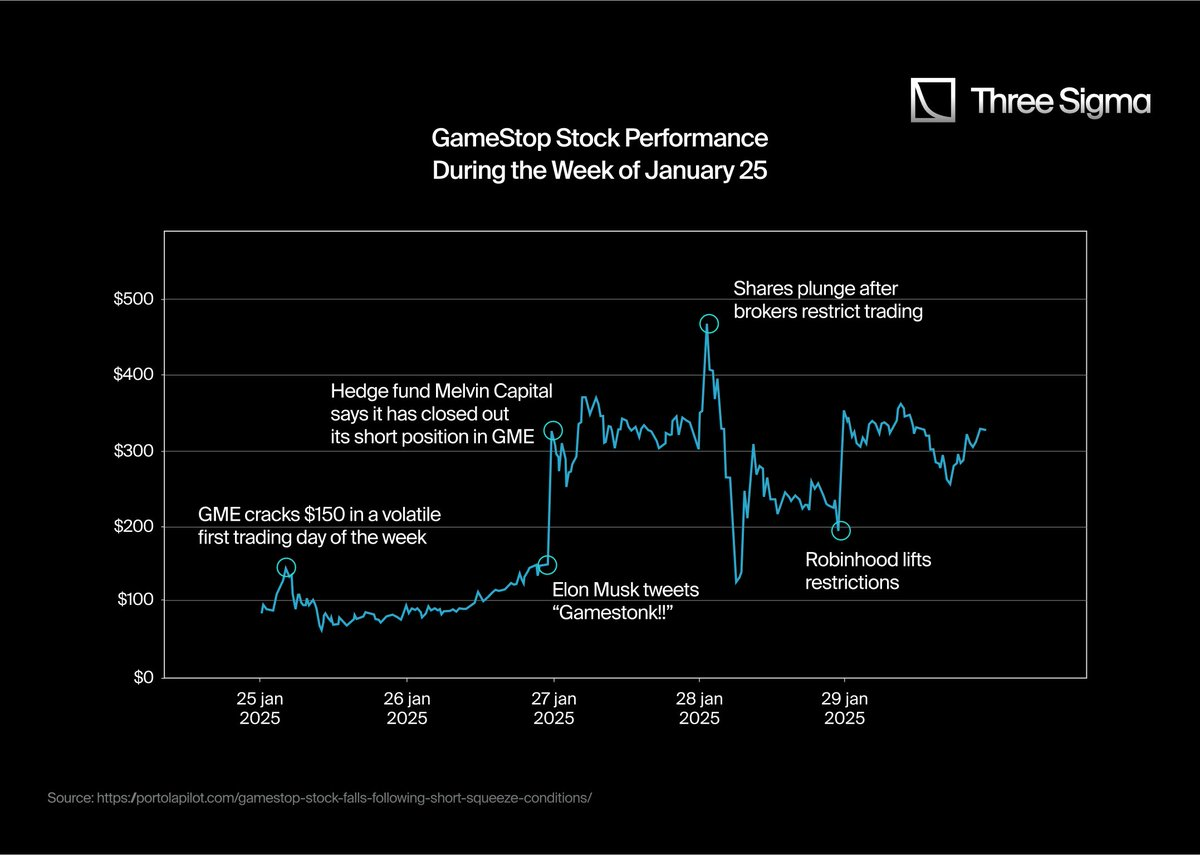
A notable example is GameStop’s short squeeze in early 2021. Retail traders from Reddit’s WallStreetBets community coordinated massive buying, unexpectedly driving the stock price up. As prices surged, short sellers had to buy back shares at higher prices to cover their positions, further fueling the rally.
This feedback loop culminated in a historic event: GameStop’s stock price soared from around $20 in early January 2021 to an intraday high of $483 by month-end. The squeeze caused institutional investors to suffer billions in short-position losses.
2. API and Liquidation
In crypto market history, several major liquidation events have occurred. Yet the most striking are often "long squeezes"—liquidations triggered during price declines. These events tend to be larger in scale and have deeper impacts on traders and markets.
Below are some of the largest liquidation events in cryptocurrency history:
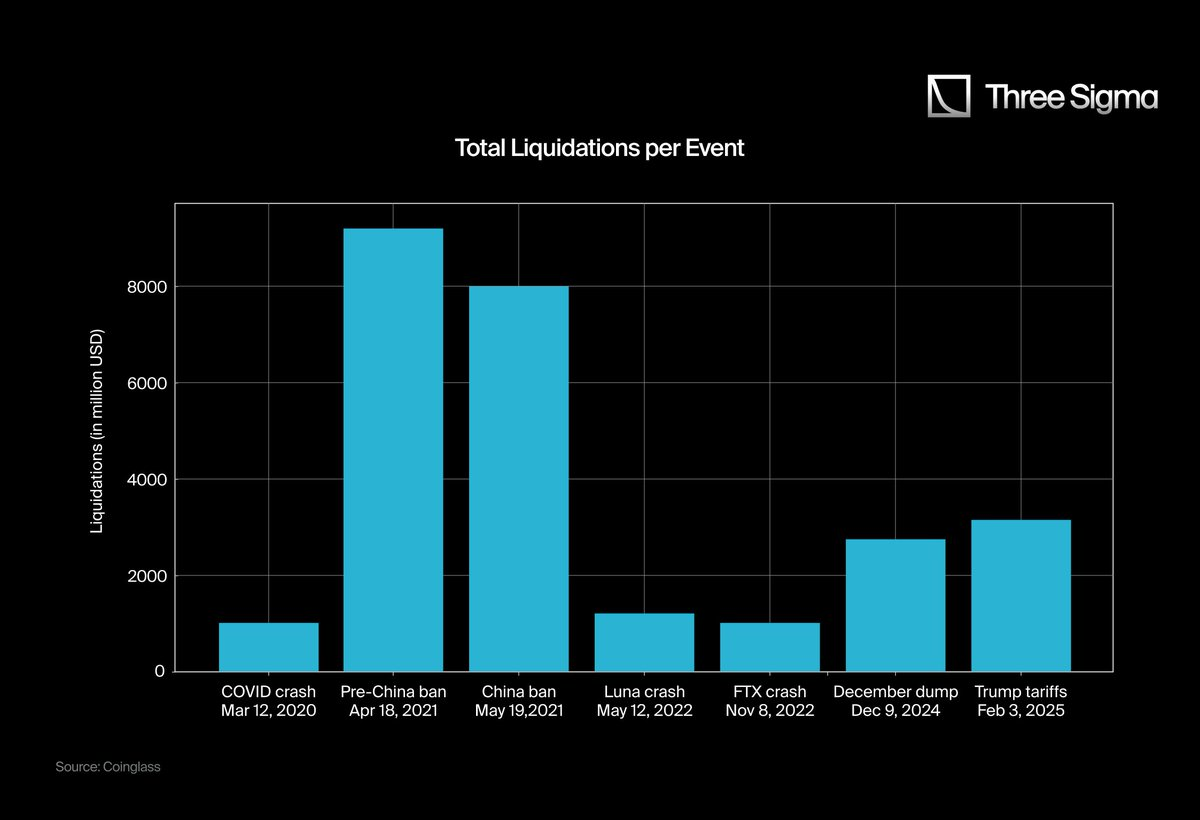
Have you noticed something unusual? Does the impact of FTX’s collapse or Luna’s crash seem much greater than recent liquidation events? Your intuition is correct.
The perception that recent liquidation events are more severe than FTX or Luna collapses stems from three core reasons:
2.1 Market Cap Growth vs. Scale of Liquidations
In March 2020, the total market cap of the cryptocurrency market peaked at $266 billion. By 2025, it had surged to a record high of $3.71 trillion. To accurately assess liquidation scale, we need to examine the liquidation-to-market-cap ratio rather than just absolute liquidation amounts. Relying solely on raw figures may make recent liquidations appear larger than they truly are relative to market size.
While charts help visualize the overall scale and impact of liquidations, they still contain data biases—leading us to the next critical issue.
2.2 Data Limitations of CEX WebSocket APIs
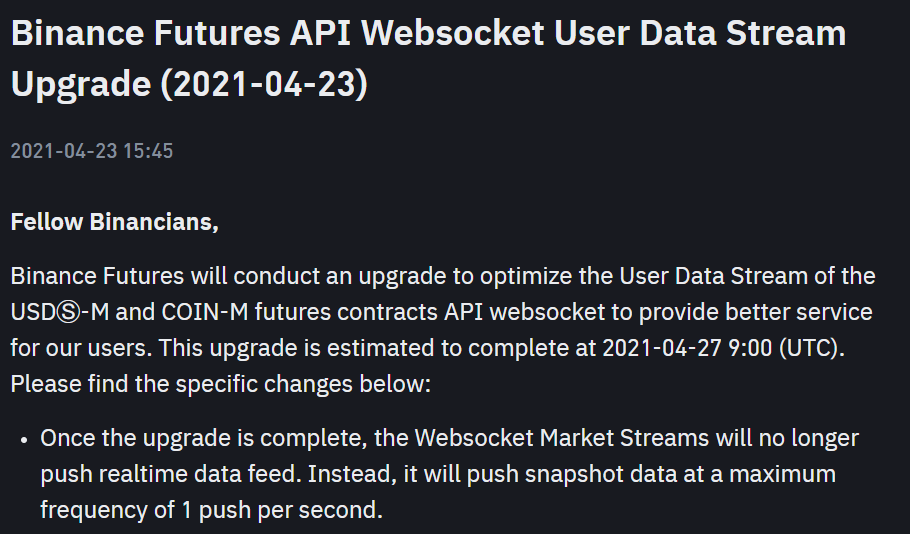
Prior to Q2 2021, most centralized exchanges (CEXs) provided detailed liquidation data via their APIs, recording and reporting every single liquidation. However, starting in 2021, many exchanges began limiting this data—now, regardless of how many liquidations actually occur, the API reports at most one per second.
This artificial cap significantly reduced transparency, making post-2021 liquidation data appear lower than pre-2021 levels—even though market activity increased substantially. As a result, the true scale and impact of liquidations have been underestimated.
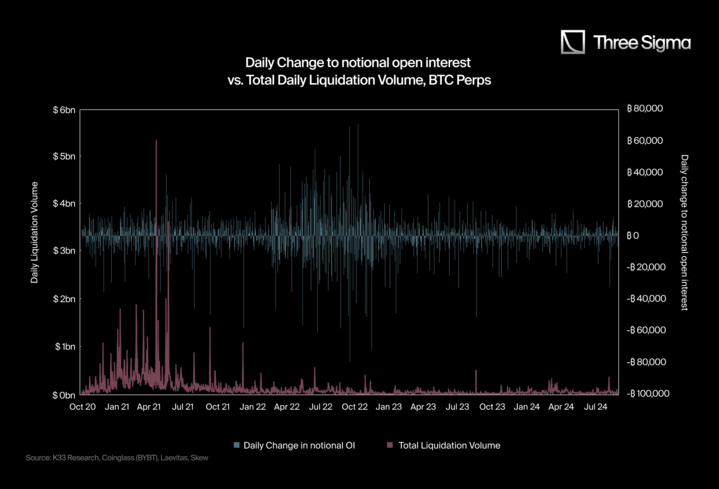
@K33Research clearly illustrated this issue with two charts:
-
The first chart shows a sharp decline in reported liquidation counts after the API change, despite the market cap growing significantly after 2021. Liquidation frequency remained abnormally low.
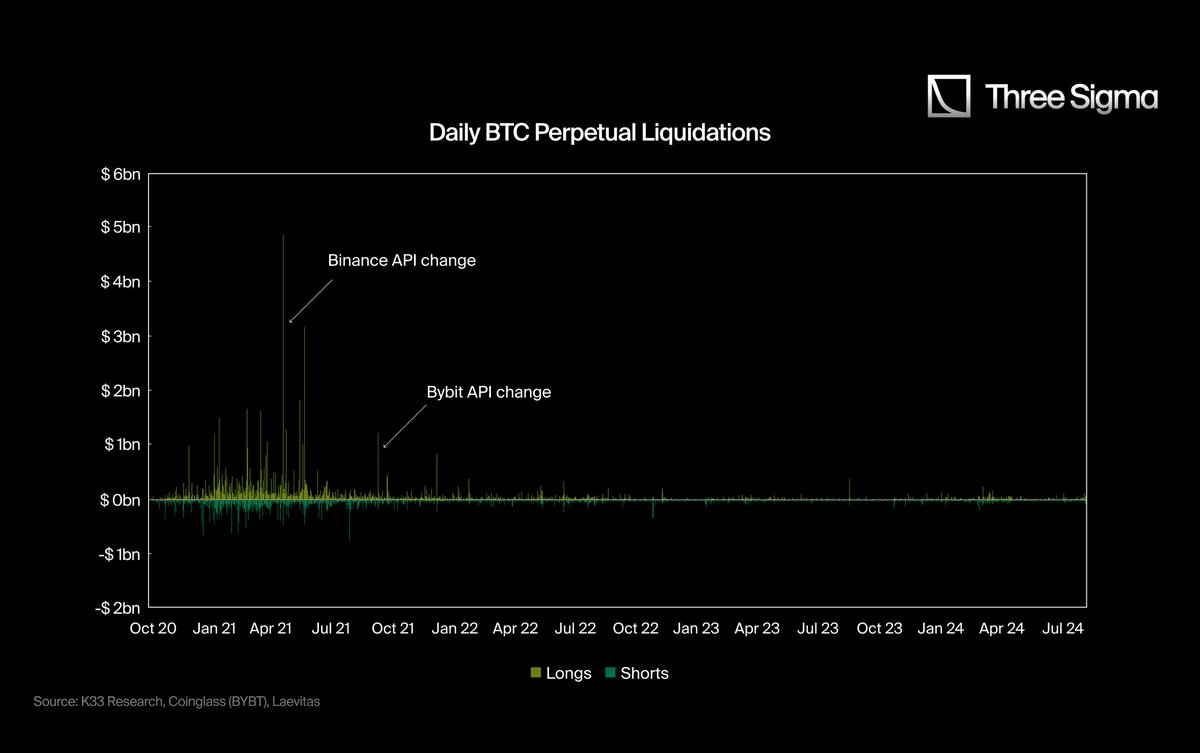
-
The second chart compares total liquidations with daily changes in notional open interest (OI). Typically, large swings in OI trigger massive liquidations. Yet from Q2 2021 onward, even days with extreme OI fluctuations show no corresponding spike in reported liquidations.
Officially, exchanges cited reasons such as “ensuring a fair trading environment” (Bybit, September 2021) and “optimizing user data streams” (Binance, April 2021). However, critics argue this may be a public relations strategy to suppress panic (FUD) and retain exclusive control over real-time data within exchanges.

Hyperliquid: A Trusted Transparent Trading Platform
Hyperliquid is the first perpetuals DEX built on a Layer 1 blockchain, achieving trading volumes comparable to centralized exchanges (CEXs). Unlike traditional CEXs, Hyperliquid provides fully transparent and unrestricted liquidation data—publicly accessible in real time.
This transparency creates a stark contrast: while CEX reporting mechanisms artificially cap liquidation data, Hyperliquid offers complete, uncapped visibility. This divergence has caused overall reported liquidation volumes to rise significantly due to Hyperliquid’s influence.
This transparency profoundly impacts the trading ecosystem. Traditional CEXs often selectively disclose or aggregate liquidation data, making real-time market analysis difficult. In contrast, Hyperliquid’s on-chain liquidation data ensures every liquidation is publicly visible, providing traders with more accurate and comprehensive insights into leveraged trading.
For traders, this means clearer visibility into market conditions—such as identifying potential squeeze opportunities, monitoring risk levels, or gauging market sentiment. Researchers and analysts also benefit from unfiltered on-chain data, gaining deeper insights into market volatility, risk behavior, and the market’s response to liquidations.
Unrestricted data access promotes a fairer, more efficient trading environment, ensuring equal information access for all market participants.
By setting a new standard for transparency in perpetual contract trading, Hyperliquid challenges CEX opacity and significantly enhances the reliability of liquidation data, enabling traders to operate with greater trust and deeper market insight.
3. Real Liquidation Data and the Hyperliquid Ratio
3.1 Calculating the Hyperliquid Ratio
Hyperliquid’s transparency and rich metrics allow us to clearly observe real market dynamics. However, CEX derivatives trading, constrained by API limitations, fails to reflect actual conditions. Despite CEXs having far higher open interest (OI) and trading volume than decentralized exchanges (DEXs), their reported liquidation data remains suspiciously low. This discrepancy is evident in charts and further confirms the limitations of CEX reporting.
Thanks to Hyperliquid’s transparency, we now have a verifiable and accurate dataset to measure the extent of bias in CEX liquidation reporting.
Traditional media often cites liquidation figures based on restricted APIs that fail to capture the full scope of liquidation activity—resulting in incomplete numbers. In contrast, Hyperliquid’s unrestricted on-chain reporting provides transparent, comprehensive records of all liquidations, proving that actual CEX liquidation activity likely far exceeds disclosed levels.
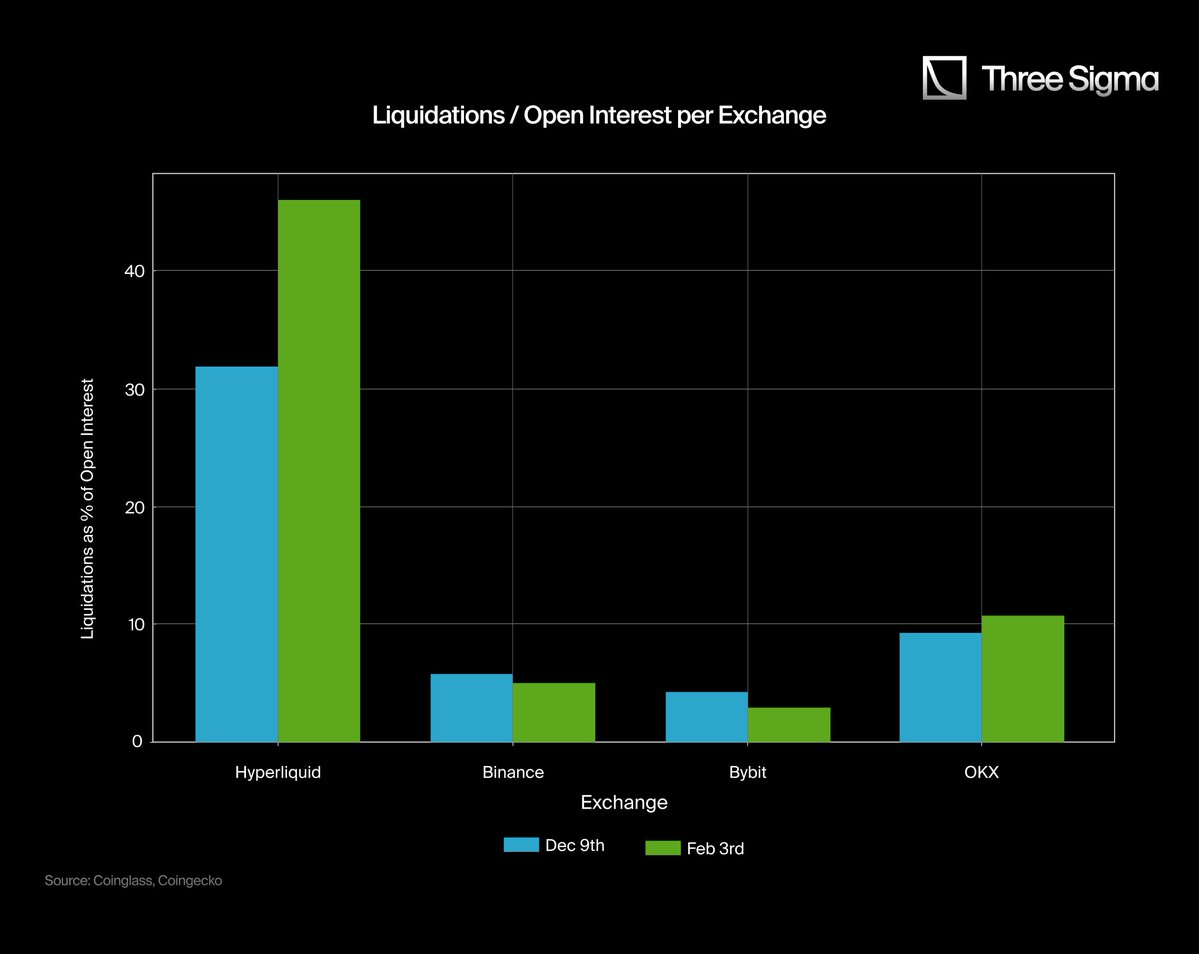
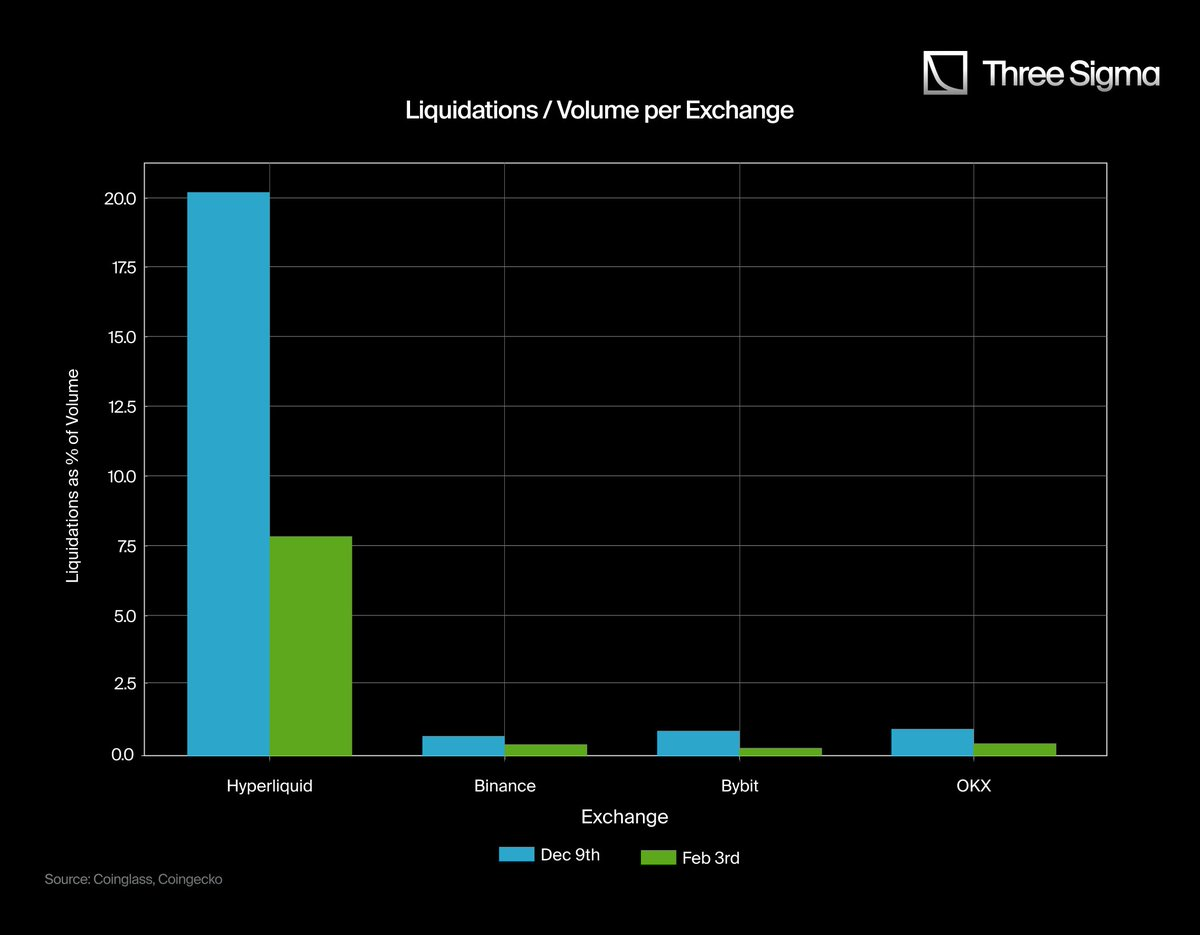
The two charts clearly show a significant gap between Hyperliquid and CEX liquidation data, highlighting a core flaw in current reporting. On major CEXs like Binance, Bybit, and OKX, OI and trading volume dwarf Hyperliquid’s—but their liquidation ratios are disproportionately low. This glaring contradiction suggests underreporting or data suppression on CEXs, as the reported figures don’t align with their extensive leveraged trading activity.
In the left chart, Hyperliquid’s liquidation-to-OI ratio is significantly higher than CEXs, whose ratios remain anomalously low despite massive derivatives markets. Similarly, in the right chart, CEXs’ liquidation-to-volume ratios are nearly negligible—clearly inconsistent with their high-leverage trading environments.
These charts demonstrate that Hyperliquid offers a more accurate and transparent view of liquidations. Unlike CEXs, which restrict public access to full liquidation data, Hyperliquid’s on-chain reporting ensures every liquidation is fully recorded and publicly verifiable, reflecting real market activity.
Notably, the "low values" in Binance, Bybit, and OKX charts do not indicate fewer liquidations—they reflect poor transparency and potential statistical flaws in CEX reporting.
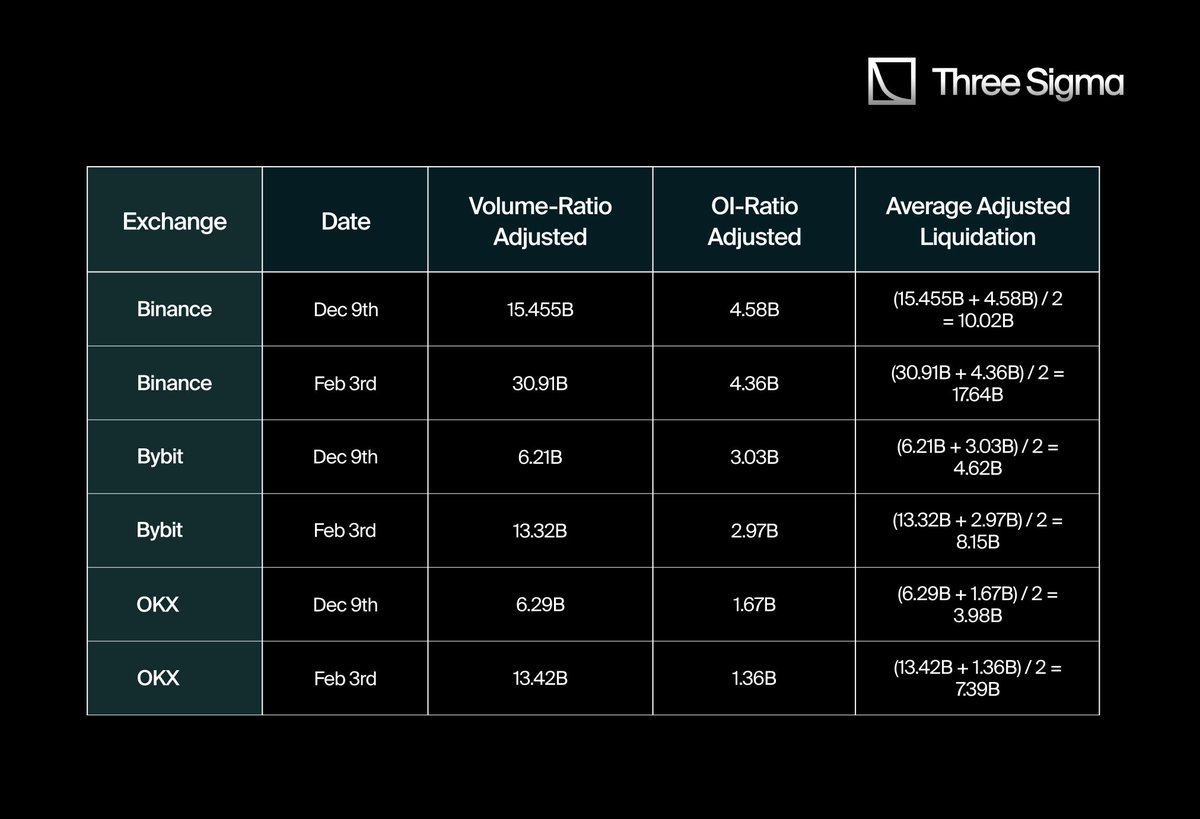
3.2 Adjusting CEX Liquidation Data Using the Hyperliquid Ratio
To estimate the "true" liquidation figures for CEXs, we use Hyperliquid’s liquidation-to-volume and liquidation-to-open-interest (OI) ratios as benchmarks. We then compare these ratios with CEX-reported liquidation data on two specific dates (December 9 and February 3) to calculate an adjustment factor.
Calculation of Hyperliquid Ratios and Adjustment of CEX Data
-
Liquidations / OI Ratio
-
Dec 9: 1.07B / 3.37B ≈ 0.3175
-
Feb 3: 1.42B / 3.08B ≈ 0.461
-
Average ≈ 0.389 (38.9%)
-
-
Liquidations / Volume Ratio
-
Dec 9: 1.07B / 5.30B ≈ 0.2021
-
Feb 3: 1.42B / 18.0B ≈ 0.0789
-
Average ≈ 0.14 (14%)
-
We use 38.9% and 14% as reference points to estimate liquidation scales across other exchanges, assuming they follow similar ratios to Hyperliquid.
Next, we apply these ratios to Binance, Bybit, and OKX:
For each CEX, we calculate two "adjusted" liquidation values:
-
One based on Hyperliquid’s liquidation-to-volume ratio
-
Another based on Hyperliquid’s liquidation-to-OI ratio.
Finally, we average the two adjusted results for each date to derive a more comprehensive estimate.
Thus, the liquidation amounts reported by CEXs (typically hundreds of millions) are vastly lower than the billions estimated using Hyperliquid-based ratios.
Below is a comparison chart for "reported vs. adjusted liquidations" on Dec 9 and Feb 3. Each exchange’s chart contains two sets of bars: light blue and light green represent reported liquidations; dark blue and dark green represent adjusted values.
The adjusted liquidation values are calculated using the average of Hyperliquid’s liquidation-to-volume and liquidation-to-OI ratios as a benchmark. While this method better reveals potential differences across exchanges, adjustments may still carry some bias due to structural differences—such as varying retail participation or market maker activity. For instance, exchanges with higher retail involvement may report lower liquidations, while others with active market makers may understate liquidation amounts.
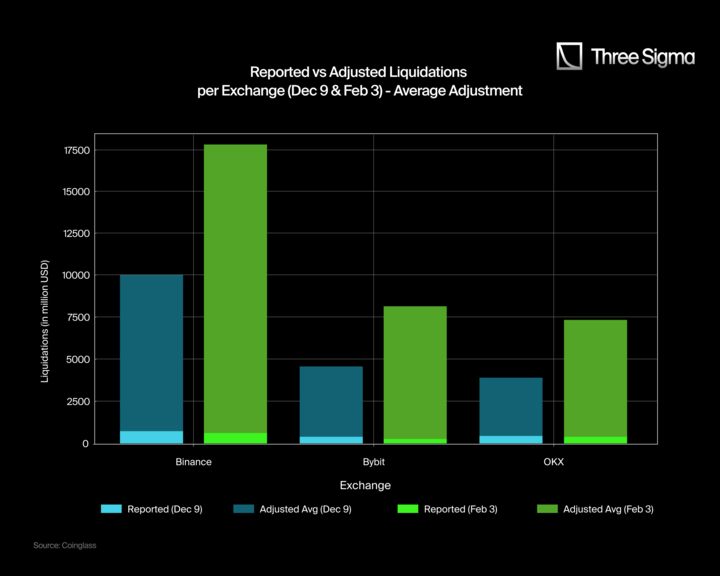
Key Findings
-
Liquidation amounts on Binance, Bybit, and OKX are significantly underestimated: Reported figures (light blue/green) are far below adjusted values (dark blue/green), indicating actual liquidations may be much higher than disclosed.
-
Binance shows particularly large discrepancies: Adjusted data suggest Binance’s actual liquidations on Feb 3 were close to $17,640 million—not the reported $611 million—highlighting a massive data gap. Similarly, on Dec 9, Binance’s liquidations should have been $10,020 million, not $739 million.
-
Bybit and OKX show similar trends: Bybit’s adjusted liquidations on Feb 3 are estimated at $8,150 million vs. reported $247 million; on Dec 9, $4,620 million vs. $370 million. OKX also shows significant gaps: $7,390 million (adjusted) vs. $402 million (reported) on Feb 3; $3,980 million vs. $425 million on Dec 9.
3.3 "True" Estimates for Major Liquidation Events
By comparing Hyperliquid’s liquidation data with reports from major CEXs, we find a huge gap. To quantify this, we collected data from Binance, Bybit, and OKX on Dec 9 and Feb 3, focusing on their liquidation-to-volume and liquidation-to-OI ratios.
To more accurately estimate true liquidation scale, we first computed Hyperliquid’s average liquidation ratios and used them as benchmarks for CEX data. Instead of using a simple average, we applied a weighted average based on each exchange’s trading volume share on specific dates—providing a more holistic view of market-wide liquidation activity.
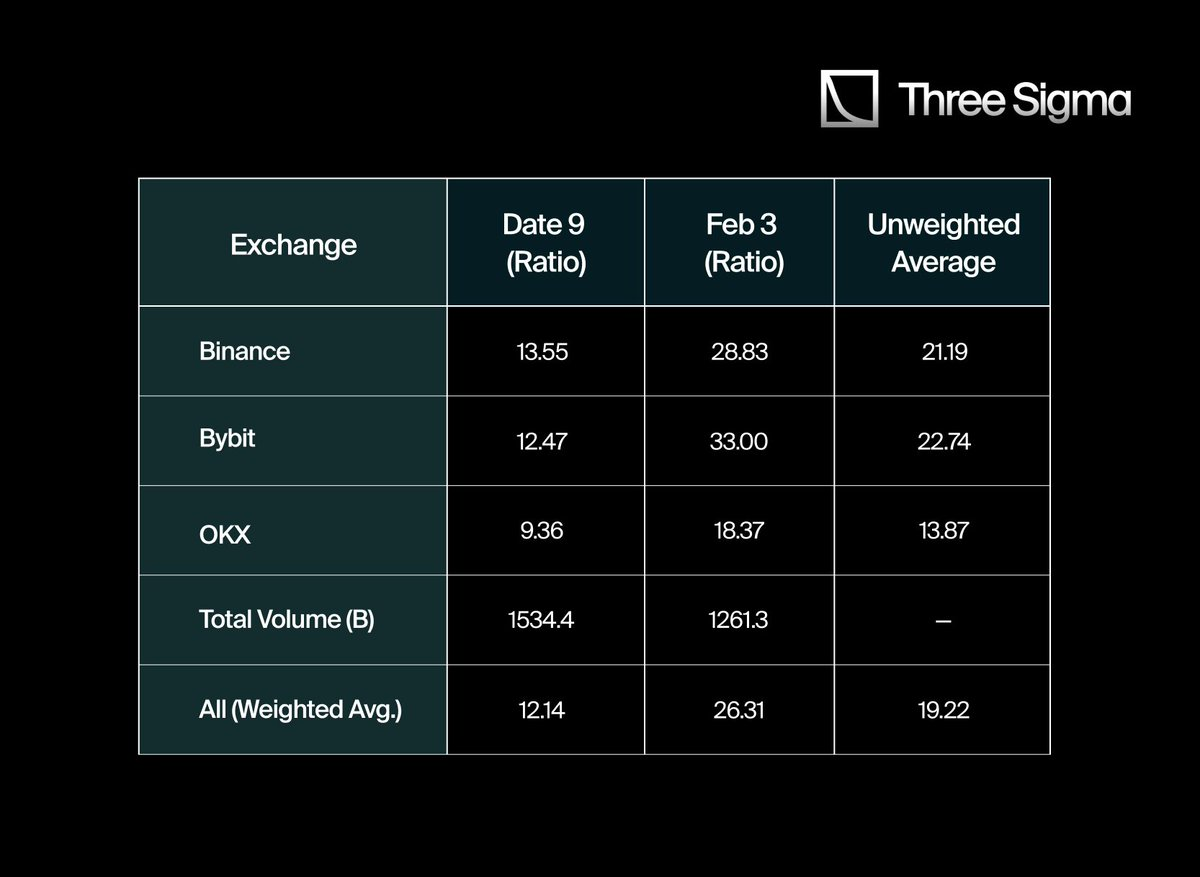
Initial calculations showed liquidation multipliers of 21.19 for Binance, 22.74 for Bybit, and 13.87 for OKX. A simple average gives a global multiplier of 19.27x. After adjusting for volume-weighted differences, the more accurate weighted average is 19.22x.
This means actual liquidation volumes on CEXs may be about 19 times higher than officially reported—or at least far exceed what is publicly disclosed via restricted APIs.
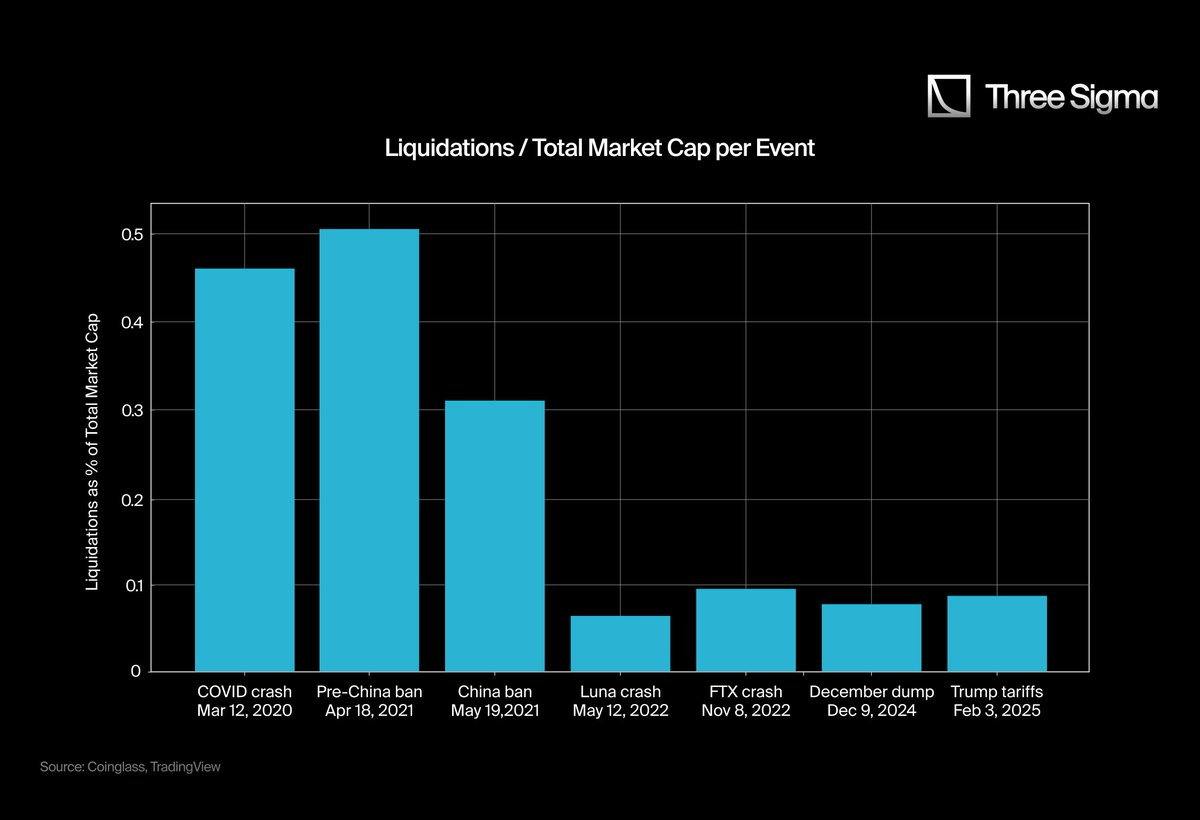
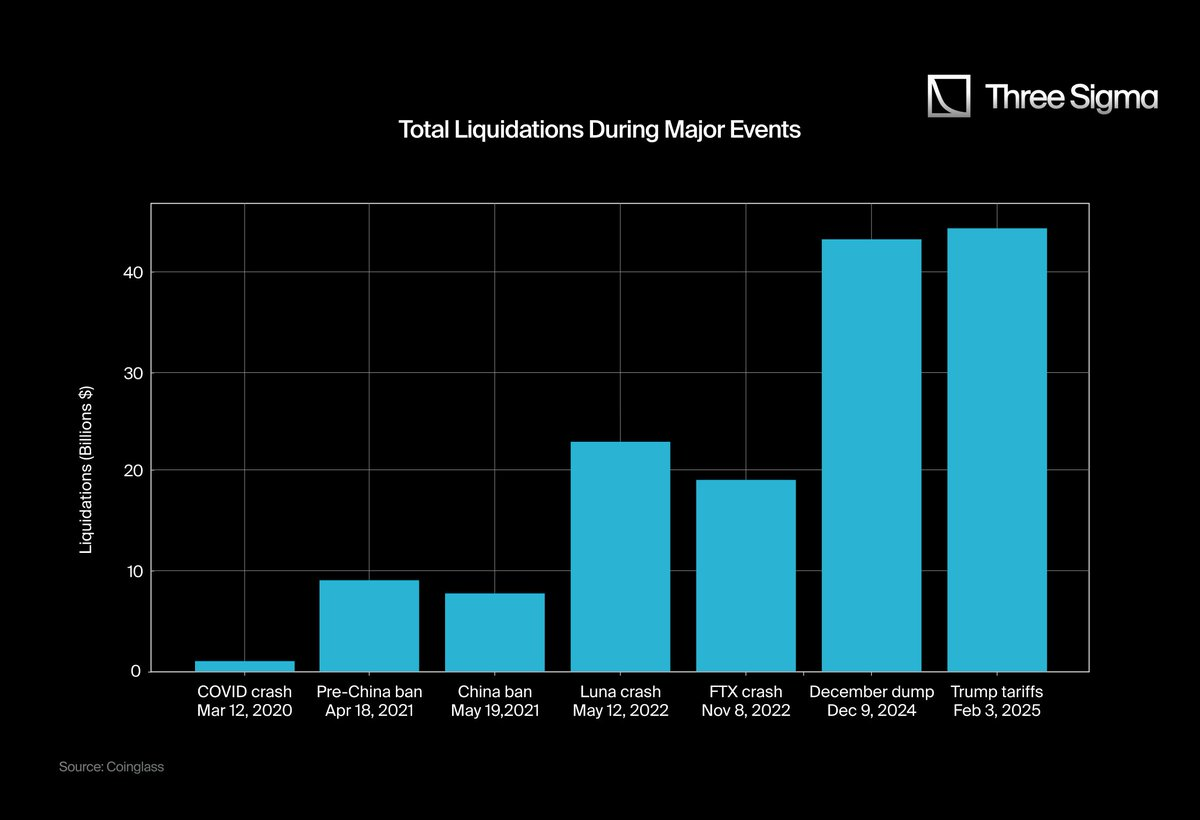
Using this 19.22x multiplier, we analyzed some of the most significant liquidation events in crypto history to estimate their true scale. Had the data been as transparent as Hyperliquid’s, actual liquidation figures would likely align closer to these adjusted values. The table below compares commonly cited figures with adjusted values using the 19.22x multiplier:
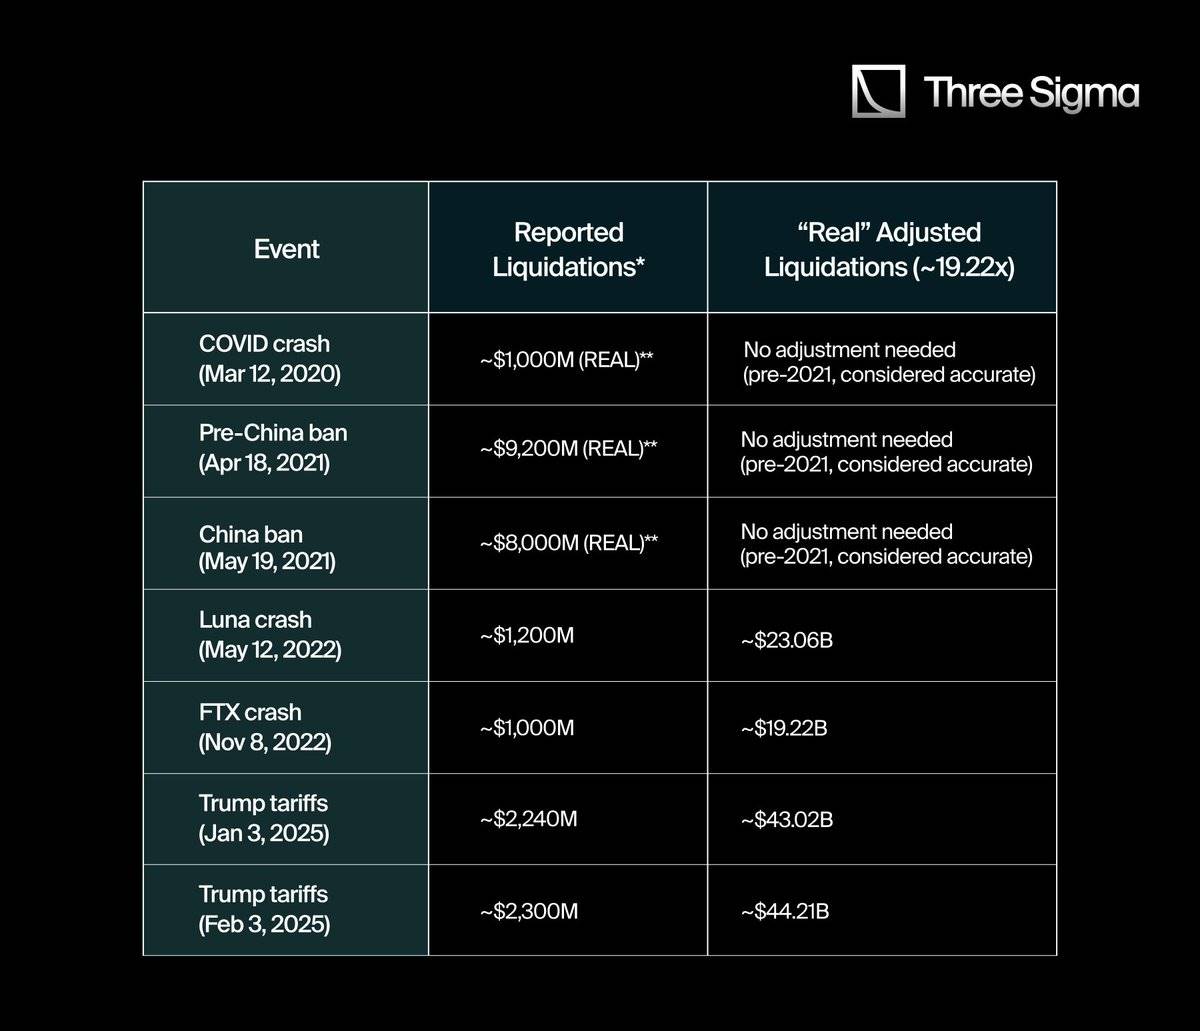
"Reported" refers to figures released via data aggregators, social media, or restricted APIs.
-
Prior to Q2 2021, before API restrictions were implemented, liquidation data was relatively more reliable.
By comparing "true" liquidation data with broader crypto market caps, we gain deeper insight into each event’s market impact. This reveals not only the scale of capital erased in short periods but also the extreme shifts in market sentiment during leveraged unwinds.
In many cases, after adjusting for underreported data, the liquidation-to-market-cap ratio becomes staggering—indicating market participants may have faced far greater systemic risk than apparent on the surface.
Thus, analyzing the liquidation-to-market-cap ratio helps clarify how market psychology and liquidity conditions shift dramatically during extreme volatility.
3.4 Comparing Liquidation Scale with Total Market Cap
To better understand the impact of major liquidation events, we compare their "true" total liquidations with the crypto market cap at the time. The formula: liquidation-to-market-cap ratio = (liquidation amount / market cap) × 100.
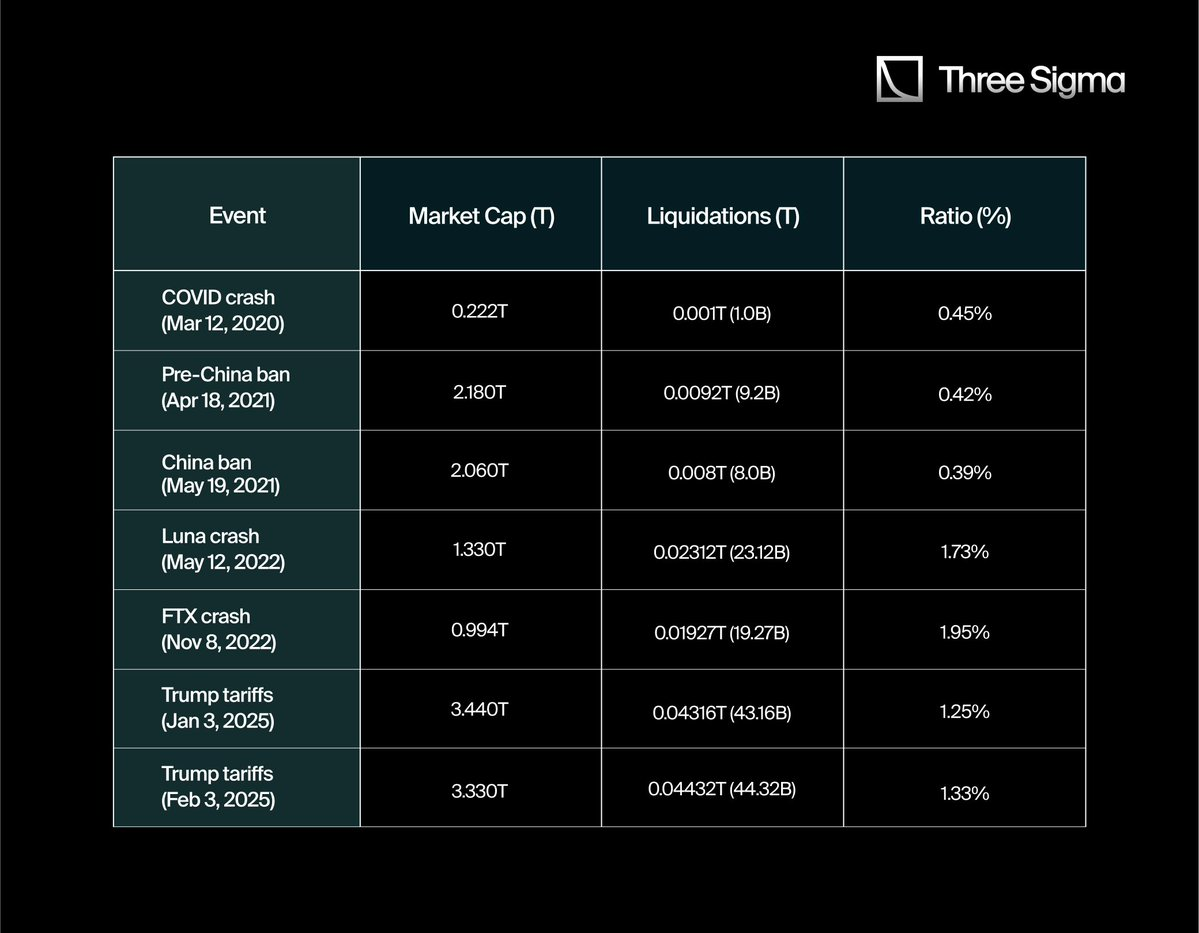
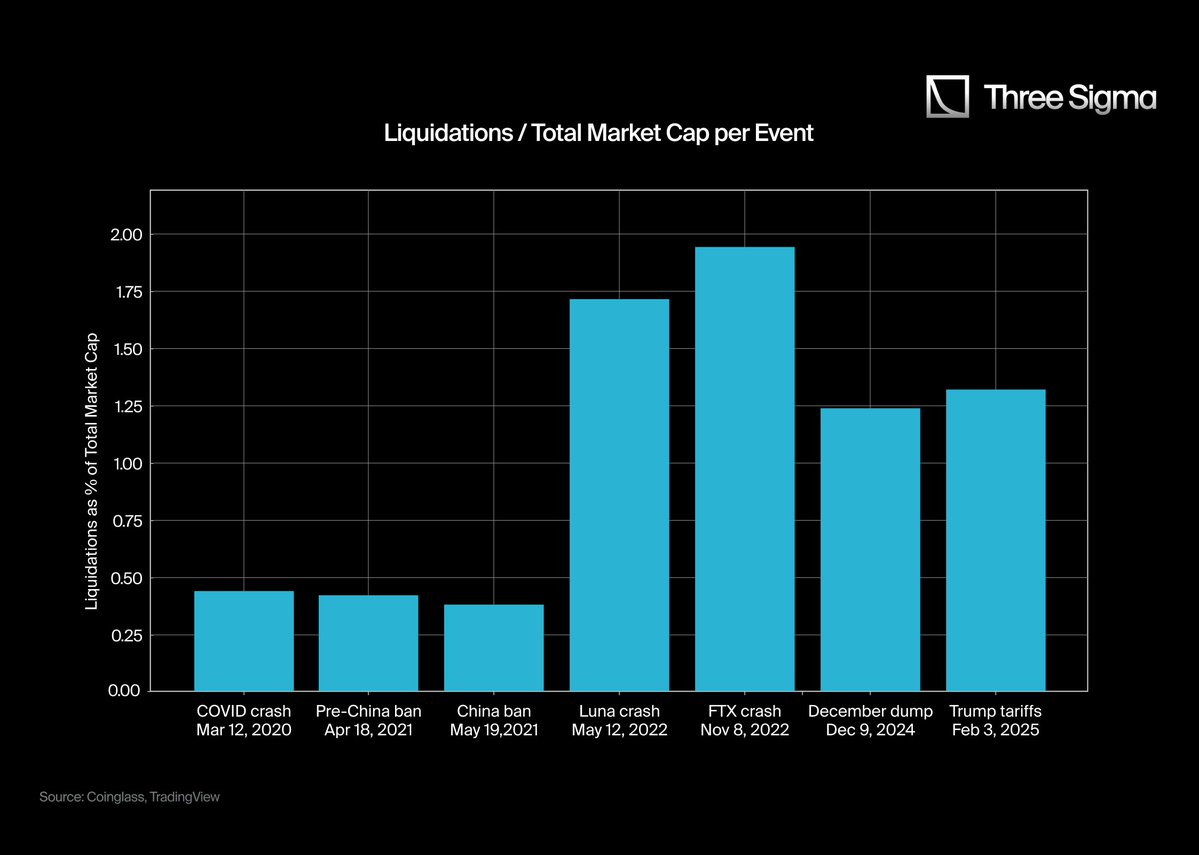
This ratio helps analyze the depth of market shock from each liquidation event. It shows both the scale of capital wiped out in a short time and the intense shifts in market sentiment during deleveraging.
After adjusting for underreported data, the liquidation-to-market-cap ratio becomes even more significant—indicating participants may have faced higher systemic risks than previously realized, risks that weren't fully visible during the events.
Therefore, analyzing this ratio helps us better understand psychological shifts and changes in liquidity conditions during periods of extreme volatility.
4. Conclusion
From the data and comparisons above, a clear trend emerges: liquidation figures reported by CEXs are often far below actual liquidation activity. When adjusted using Hyperliquid’s transparent ratios, events like the Luna and FTX collapses reveal market impacts far exceeding official reports. This supports the view that CEXs may underreport liquidations to reduce market volatility or influence public perception.
This discrepancy is especially evident in historical analysis. For example, the 2020 COVID crash, while massive at the time, appears relatively small today—mainly because leveraged trading was less widespread. As leveraged trading grows, both absolute and relative liquidation scales have risen significantly. Yet due to limitations in official data feeds, traders and analysts may lack full awareness of systemic risks.
Moreover, exchanges often justify restricting real-time liquidation data with claims of "optimizing data flow" or "ensuring fair trading," but these practices may serve broader interests. Underreporting can reduce panic among retail traders and give exchanges proprietary insights into overall market risk exposure.
Nevertheless, industry transparency is gradually improving. For example, Bybit’s Ben recently announced that Bybit has started publishing real liquidation data—a sign of a shift toward greater transparency. More details can be found at this link.
While Bybit’s move may help narrow the gap between reported and actual liquidations, Hyperliquid’s fully on-chain, unrestricted reporting underscores the importance of true transparency. For anyone seeking to understand the complexities of crypto leveraged trading, genuine transparency remains an indispensable tool.
Join TechFlow official community to stay tuned
Telegram:https://t.me/TechFlowDaily
X (Twitter):https://x.com/TechFlowPost
X (Twitter) EN:https://x.com/BlockFlow_News