Grayscale: We are in the middle of a crypto bull market, and the rally could continue beyond 2025
TechFlow Selected TechFlow Selected
Grayscale: We are in the middle of a crypto bull market, and the rally could continue beyond 2025
The market is currently in the mid-phase of a new crypto cycle. As long as fundamentals remain solid, the bull market could extend into 2025 or even longer.
 Navigating Web3 tides with focused insights
Author: Zach Pandl, Michael Zhao
Translation: Luffy, Foresight News
-
Historically, the cryptocurrency market has followed a clear four-year cycle, with prices going through successive phases of rise and decline. Grayscale Research believes investors can monitor various blockchain-based metrics and other indicators to track crypto cycles and inform their risk management decisions.
-
Cryptocurrencies are becoming a more mature asset class: new spot Bitcoin and Ethereum ETFs have broadened market access, while the incoming Trump administration may bring greater regulatory clarity to the crypto industry. For these reasons, cryptocurrency market valuations could surpass previous all-time highs.
-
Grayscale Research believes the current market is in the mid-phase of a new crypto cycle. As long as fundamentals—such as application adoption and macroeconomic conditions—are sound, the bull market could extend into 2025 or beyond.
Like many physical commodities, Bitcoin’s price does not strictly follow a "random walk" model. Instead, Bitcoin exhibits statistical momentum: rallies tend to follow rallies, and declines tend to follow declines. While Bitcoin fluctuates up and down in the short term, over the long run it shows a pronounced cyclical upward trend (Figure 1).

Figure 1: Bitcoin's price oscillates repeatedly but shows an overall upward trend
Each past price cycle had its own unique drivers, and future price movements will not necessarily repeat history exactly. Moreover, as Bitcoin matures and gains broader acceptance among traditional investors—and as the impact of the four-year halving event on supply diminishes—the cyclicality of Bitcoin’s price could be reshaped or even disappear entirely. Nevertheless, studying past cycles still offers investors guidance on Bitcoin’s typical statistical behavior, which can help inform risk management strategies.
Observing Bitcoin's Historical Cycles
Figure 2 shows Bitcoin’s price performance during the uptrend phase of each previous cycle. Prices are indexed to 100 at the cycle low (the start of the uptrend) and tracked through to the peak (the end of the uptrend). Figure 3 presents the same data in tabular form.
Bitcoin’s first historical price cycle was relatively short and highly volatile: the first cycle lasted less than one year, the second about two years. In both cycles, Bitcoin rose more than 500-fold from the lows. The subsequent two cycles each lasted just under three years. From January 2015 to December 2017, Bitcoin increased more than 100-fold; from December 2018 to November 2021, it rose approximately 20-fold.

Figure 2: In the past two market cycles, Bitcoin followed a similar trajectory
After peaking in November 2021, Bitcoin’s price fell to a cyclical low of around $16,000 in November 2022. The current price recovery began then and has now lasted over two years. As shown in Figure 2, the latest rally closely resembles the past two Bitcoin cycles, both of which lasted about three years before reaching their peaks. In terms of magnitude, Bitcoin has risen approximately sixfold so far in this cycle—an impressive return, but notably lower than the returns achieved in the prior four cycles. In summary, while we cannot predict whether future returns will mirror past cycles, Bitcoin’s history suggests that the current bull market still has room to grow in both duration and magnitude.

Figure 3: Four distinct cycles in Bitcoin price history
On-Chain Metrics
In addition to analyzing past price cycles, investors can use various blockchain-based indicators to assess the maturity of a Bitcoin bull market. Common metrics include profitability of Bitcoin buyers, new capital inflows into Bitcoin, and price levels relative to miner revenues.
A particularly popular metric is the ratio of Bitcoin’s Market Value (MV)—circulating supply multiplied by current market price—to its Realized Value (RV), which sums the price at which each Bitcoin last transacted on-chain. This is known as the MVRV ratio and can be interpreted as the degree to which Bitcoin’s market cap exceeds its aggregate cost basis. In each of the past four cycles, the MVRV ratio reached at least (Figure 4). The current MVRV ratio stands at 2.6, suggesting the current cycle may continue for some time. However, the peak MVRV ratios in recent cycles have been declining, so this cycle may never reach a level of 4.
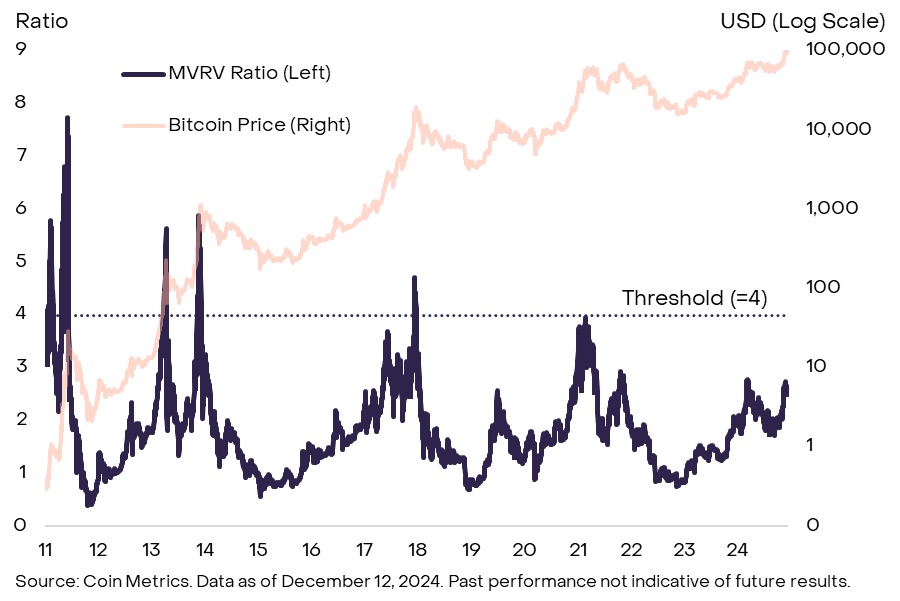
Figure 4: Historical trends in Bitcoin’s MVRV ratio
Some on-chain metrics measure the extent of new capital entering the Bitcoin ecosystem. Experienced crypto investors often refer to this framework as HODL Waves. There are several variations, but Grayscale Research prefers using the ratio of tokens that have moved on-chain in the past year to Bitcoin’s total free-floating supply (Figure 5). In each of the past four cycles, this metric reached at least 60%, meaning that during the uptrend phase, at least 60% of the free float changed hands on-chain within a year. Currently, this figure is around 54%, indicating that we may see more Bitcoin turnover on-chain before prices peak.

Figure 5: Less than 60% of circulating Bitcoin has been active on-chain over the past year
Other cyclical indicators focus on Bitcoin miners—the professional service providers securing the Bitcoin network. One common metric is the Miner Cap (MC)—the dollar value of all Bitcoin held by miners—relative to the so-called "thermocap" (TC), which represents the cumulative value of Bitcoin distributed to miners via block rewards and transaction fees. Typically, when miner assets reach certain valuation thresholds, they may begin taking profits. Historically, when the MC-to-TC (MCTC) ratio exceeded 10, prices subsequently peaked within that cycle (Figure 6). Currently, the MCTC ratio is around 6, suggesting we are still in the middle phase of the current cycle. However, like the MVRV ratio, this indicator’s peak values have declined in recent cycles, so a price peak might occur before the MCTC reaches 10.

Figure 6: The cyclical peak of Bitcoin miner metric MCTC has been declining
There are many other on-chain metrics, and there may be subtle differences when combined with other data sources. Furthermore, these tools only offer a rough comparison of the current Bitcoin uptrend against past ones and do not guarantee that relationships between these metrics and future price returns will remain consistent. That said, collectively, common Bitcoin cycle indicators are still below the levels seen at previous price peaks. This suggests that, assuming strong fundamentals, the current bull market could continue.
Market Indicators Beyond Bitcoin
The cryptocurrency market is more than just Bitcoin; signals from other sectors may also provide insight into the state of the market cycle. We believe these indicators may be especially important over the coming year due to the relative performance between Bitcoin and other crypto assets. In the past two market cycles, Bitcoin dominance—Bitcoin’s share of total crypto market cap—peaked around two years into the bull market (Figure 7). Recently, Bitcoin dominance has begun to decline, coinciding with the point roughly two years into the current cycle. If this trend continues, investors should consider broader metrics to assess whether crypto valuations are approaching cyclical highs.

Figure 7: In the past two cycles, Bitcoin dominance declined in the third year
For example, investors can monitor funding rates—the cost of holding long positions in perpetual futures contracts. When speculative demand for leverage is high, funding rates tend to rise. Thus, aggregate funding rate levels across the market can reflect overall speculative positioning. Figure 8 shows the weighted average funding rate for the 10 largest cryptocurrencies after Bitcoin (i.e., the top “altcoins”). Currently, funding rates are clearly positive, indicating leveraged demand for long positions, although they dropped sharply following last week’s downturn. Moreover, even at current local highs, funding rates remain below earlier 2024 levels and previous cycle peaks. Therefore, we believe current funding rate levels suggest speculation has not yet reached peak levels.

Figure 8: Funding rates indicate moderate speculative activity in altcoins
In contrast, open interest (OI) in altcoin perpetual futures has reached relatively high levels. Prior to a major liquidation event on December 9, altcoin OI across the top three perpetual futures exchanges reached nearly $54 billion (Figure 9). This indicates relatively large speculative positions across the broader market. After the large-scale liquidation, altcoin OI dropped by about $10 billion but remains elevated. High long positions among speculators are often consistent with later stages of a market cycle, making continued monitoring of this indicator important.

Figure 9: Altcoin positions were high before recent liquidations
The Bull Run May Continue
Since Bitcoin’s inception in 2009, the cryptocurrency market has come a long way, and many characteristics of the current crypto bull market differ from those of the past. Most importantly, the U.S. approval of spot Bitcoin and Ethereum ETFs has brought $36.7 billion in net capital inflows and helped integrate crypto assets into broader traditional investment portfolios. Additionally, we believe the recent U.S. election could bring greater regulatory clarity and help secure the permanent place of crypto assets within the world’s largest economy. This is a significant shift compared to the past, when observers repeatedly questioned the long-term viability of the crypto asset class. For these reasons, valuations of Bitcoin and other crypto assets may no longer follow early historical patterns.
At the same time, Bitcoin and many other crypto assets can be viewed as digital commodities, which, like other commodities, may exhibit some degree of price momentum. Therefore, evaluating on-chain metrics and altcoin-related data may assist investors in making informed risk management decisions. Grayscale Research believes that, taken together, current indicators suggest the crypto market is in the mid-stage of a bull market: metrics such as MVRV are well above cycle lows but have not yet reached levels that previously marked market tops. As long as fundamentals—such as application adoption and macroeconomic conditions—remain strong, we believe the crypto bull market could persist into 2025 and beyond.
Join TechFlow official community to stay tuned
Telegram:https://t.me/TechFlowDaily
X (Twitter):https://x.com/TechFlowPost
X (Twitter) EN:https://x.com/BlockFlow_News
 @Grayscale