Coinbase Q3 Earnings Deep Dive: Election Momentum Drives Stock Surge, Base Continues to Lead Layer 2
TechFlow Selected TechFlow Selected
Coinbase Q3 Earnings Deep Dive: Election Momentum Drives Stock Surge, Base Continues to Lead Layer 2
In Base's application ecosystem, the DeFi category stood out, with address activity surging from 143,600 in Q2 2024 to 405,700 in Q3.
Author: insights4.vc
Translation: TechFlow
Between November 5 and 6, Coinbase Global (NASDAQ: COIN) saw its stock price rise 31% due to election results, climbing from $193.96 to $254.31. This report provides an in-depth analysis of Coinbase's current financial condition and performance metrics of its Layer 2 blockchain, Base.
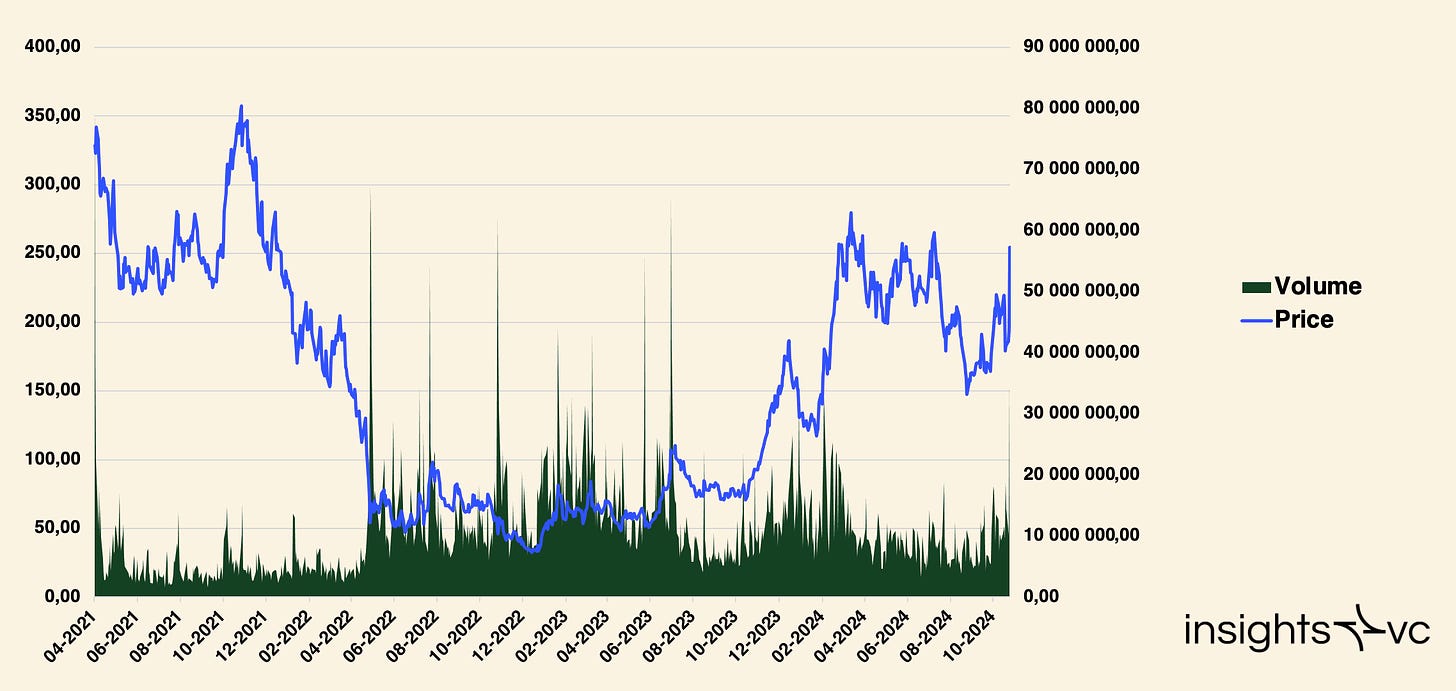
Coinbase (COIN) closing price: $254.31 | Volume: 35.46 million - November 6, 2024
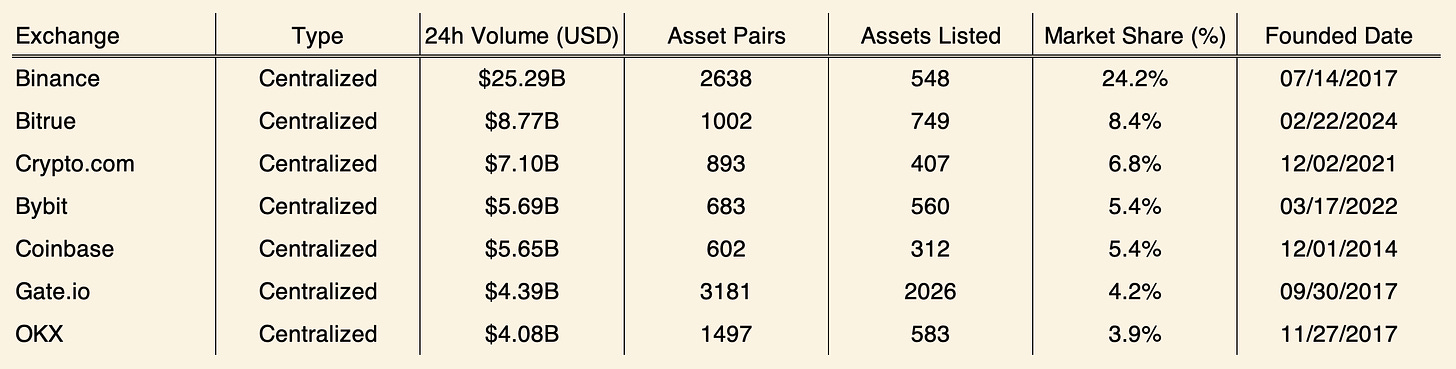
Coinbase competitors: Key metrics overview
Revenue Analysis
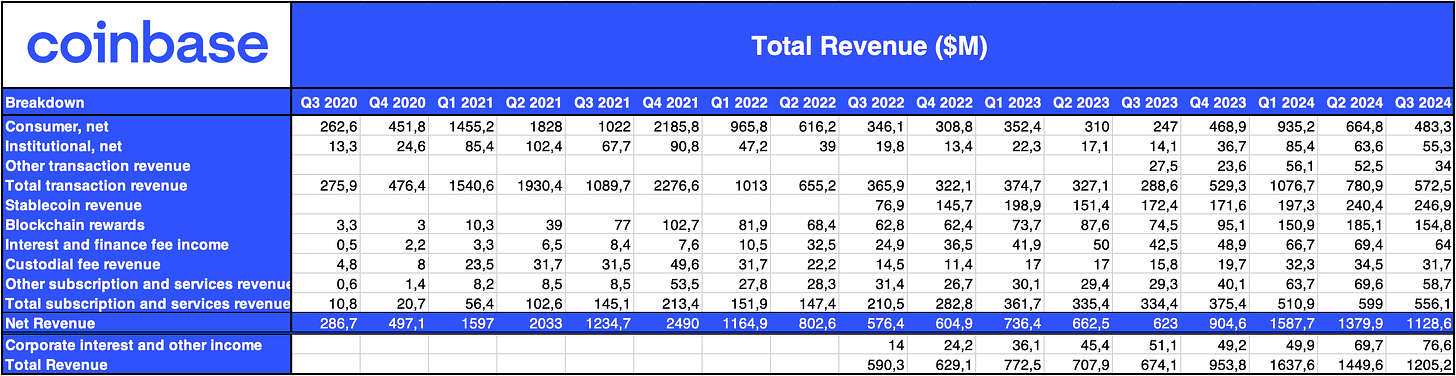
Revenue Breakdown (Q3 2020 – Q3 2024)
Revenue
-
Total Revenue Q3 2024: $1.2052 billion, down from $1.4496 billion in Q2 2024 but up compared to $772.5 million in Q3 2023.
-
Revenue Trend: After peaking in Q4 2021, total revenue has stabilized at a lower level since Q2 2022.
Revenue by Segment
-
Consumer Trading: $483.3 million in Q3 2024, down from $664.8 million in Q2, showing sensitivity to market volatility, yet remains the primary revenue source.
-
Institutional Trading: Slight decline from $63.6 million in Q2 2024 to $55.3 million in Q3, with smaller fluctuations but a low contribution to overall revenue.
-
Blockchain Rewards: $154.8 million in Q3 2024, below Q2’s $185.1 million but year-over-year growth reflects stable income tied to blockchain development.
-
Stablecoin Revenue: $246.9 million, remaining stable across quarters, highlighting Coinbase’s significance in the digital currency space.
-
Interest and Financial Fees: $64 million in Q3, providing a steady income stream despite market shifts.
-
Subscription and Services: $556.1 million in Q3, down from $599 million in Q2, indicating service growth under current market pressures.
Expense Analysis
-
Transaction Expenses: $171.8 million (15% of net revenue), down 10.3% from Q2 2024.
-
Technology and Development: $377.4 million, up 3.6% quarter-over-quarter.
-
Sales and Marketing: $164.8 million, slightly down 0.3%.
-
General and Administrative: $330.4 million, up 3.2%.
-
Other Net Operating Income: -$8.6 million, indicating a net outflow in this category.
-
Total Operating Expenses: $1.0357 billion, down 6.4% from Q2 2024.
Trading Volume and Asset Revenue Contribution
-
Total Trading Volume Q3 2024: $185 billion, lower than $226 billion in Q2 2024 and also below $92 billion in Q3 2023.
-
Consumer Trading: $34 billion, down from $37 billion in Q2 2024.
-
Institutional Trading: $151 billion, below $189 billion in Q2 2024.
Asset Revenue Breakdown
-
Bitcoin: Accounted for 37% of total trading volume, up from 35% in Q2 2024.
-
Ethereum: Trading volume remained stable at around 15%, reflecting consistent market interest.
-
Note: Solana emerged as the third-largest asset over the past two quarters, increasing its share of total trading revenue from 10% to 11%.
-
Other Assets: Dropped to 33% in Q3 2024, reflecting diversification efforts, though focus remains primarily on Bitcoin and Ethereum.
Resource Allocation and Investment Analysis
Liquidity Overview
-
USDC Holdings: $508 million in Q3 2024, slightly below $589 million in Q2 2024. This indicates USDC remains a stable liquidity source; the decrease may reflect strategic redeployment of assets.
-
Company Cash Held at Third-Party Institutions: $92 million, down from $97 million, reflecting minimized exposure to third-party risk.
-
Money Market Funds and Government Bonds: Increased to $6.088 billion, up from $4.068 billion in Q3 2023, signaling a conservative shift toward low-risk, liquid financial instruments amid market volatility.
-
Company Cash: Decreased from a peak of $3.549 billion in Q2 2022 to $1.544 billion, possibly due to strategic investments or operational demands.
-
Total Liquidity Resources: Grew to $8.232 billion in Q3 2024, demonstrating a solid financial foundation and readiness for strategic opportunities or market downturns.
Investment and Financing Activities
-
Operating Cash Flow: $687 million in Q3 2024, reflecting strong cash generation capability and resilience in core operations.
-
Capital Expenditures: Only $19 million, reflecting a conservative approach to fixed costs to maintain financial flexibility.
-
Strategic Investments: Minor outflows, including $14 million in venture investments (details of Coinbase Ventures activities available in Google Sheet), $18 million in crypto investments, and $173 million used for fiat loans and collateral, underscoring cautious risk management.
-
Financing Activities: No new long-term debt issued in Q3 2024, indicating a strategic focus on organic growth and internal liquidity utilization.
Workforce Metrics and Other Data
-
Total Employees Q3 2024: Increased from 3,486 in Q2 2024 to 3,672.
-
Monthly Transacting Users (MTUs): 7.8 million, down 4.9% from Q2 2024 and down 16.4% year-over-year.
-
Website Traffic: Declined from 40.7 million in Q2 2024 to 37.8 million, potentially reflecting waning interest or seasonal changes.
-
Google Trends: Peaked at 74 in September, indicating fluctuating public interest.
-
App Downloads: Fell from 14,189 in August to 8,928 in September, suggesting slowing new user acquisition.
-
Job Postings: Dropped to 818 in October, possibly indicating stabilized hiring or ongoing restructuring.
Financial Ratios
Note: The following interpretations are insights based on current data, not definitive conclusions. Independent review of the data is recommended. Detailed data can be found in the Google Sheet.
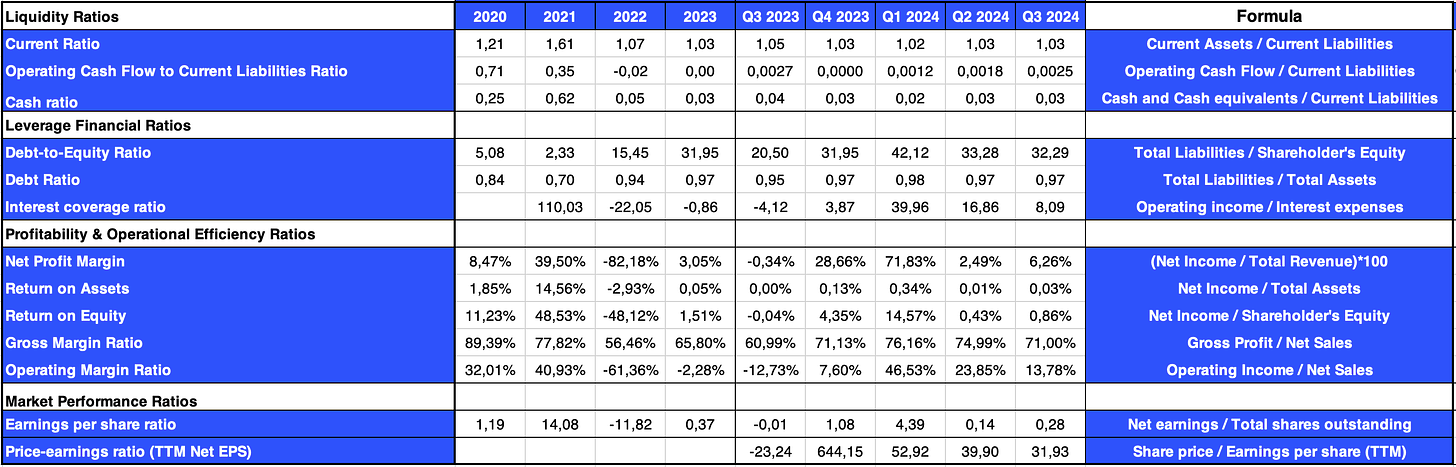
Financial Ratios (2020–2023; Q3 2023–Q3 2024)
Liquidity Analysis
-
Current Ratio (Q3 2024: 1.03): Remains stable, indicating limited coverage of current liabilities by current assets.
-
Operating Cash Flow to Current Liabilities Ratio (Q3 2024: 0.0025): Slight increase, showing partial recovery in cash flow generation capacity.
-
Cash Ratio (Q3 2024: 0.03): Maintained at a low level, emphasizing strict cash management.
Leverage Ratios
-
Debt-to-Equity Ratio (Q3 2024: 32.29): High leverage indicates increased financial risk.
-
Debt Ratio (Q3 2024: 0.97): Liabilities nearly equal assets, showing high reliance on debt financing.
-
Interest Coverage Ratio (Q3 2024: 8.09): Positive value, indicating operating income is sufficient to cover interest expenses, reflecting sound debt servicing ability.
Profitability and Efficiency Ratios
-
Net Profit Margin (Q3 2024: 6.26%): Improved from losses in Q3 2023, showing enhanced net income generation.
-
Return on Assets (ROA) (Q3 2024: 0.03%): Low asset utilization efficiency suggests potential operational inefficiencies.
-
Return on Equity (ROE) (Q3 2024: 0.86%): Slight improvement but still low, indicating suboptimal returns on shareholders’ equity.
-
Gross Margin (Q3 2024: 71.00%): Increased, reflecting effective cost control.
-
Operating Margin (Q3 2024: 13.78%): Markedly improved, indicating better control over operating expenses.
Market Performance Ratios
-
Earnings Per Share (EPS) (Q3 2024: $0.28): Recovered from negative earnings, signaling strengthened profitability.
-
Price-to-Earnings (P/E) Ratio (TTM Net EPS) (Q3 2024: 31.93): A moderate P/E ratio suggests investors hold cautiously optimistic views about future prospects.
Base
For detailed information on the origin and development of Base, please refer to our June newsletter. Led by Jesse Pollak, Base officially launched on July 13, 2023.
Overview
-
Platform Mission: Base is Coinbase’s Layer 2 solution built on Ethereum, aiming to create a global on-chain economy that prioritizes innovation, creativity, and economic freedom, offering developers a secure, low-cost environment for building decentralized applications (dApps).
-
Infrastructure and Governance: Built on the OP Stack for scalability and cost-efficiency. Base has confirmed it will not issue a native token (as stated by CEO Brian Armstrong on December 1, 2023). Base is collaborating with OP Labs on active decentralization governance and research initiatives, including EIP-4844 and the op-geth client, aligning with Coinbase’s vision of gradual decentralization.
-
Ecosystem Development: Base enjoys broad popularity within the developer community, focusing on substantive product innovation rather than relying on token incentives. Internal Coinbase teams use Base to deploy smart contracts, enhancing consumer and institutional product experiences, while promoting broader adoption of on-chain applications through seamless onboarding and intuitive interfaces.
-
Core Products: Positioned as a decentralized “app store,” Base offers developers an open platform featuring Base Names to simplify on-chain identity management and smart wallets that provide users with secure and programmable asset management solutions.
-
Strategic Positioning: Base competes not only within the Layer 2 ecosystem but also against traditional online platforms by delivering on-chain experiences comparable to conventional web applications.
Key Metrics
Within Base’s application activity, the DeFi category stands out, with address activity surging from 143,600 in Q2 2024 to 405,700 in Q3. However, revenue dropped to $7.3 million in Q3, down from $24.2 million in Q2. Stablecoin transfer volume grew significantly, rising from $97.8 billion in Q2 to over $415 billion in Q3, reflecting rising transaction demand. The ratio of new to returning users also shifted: from 107,000 new vs. 278,000 returning in Q2, to 420,000 vs. 450,000 in Q3, and further to 509,000 vs. 827,000 in Q4. Sybil addresses declined to 178,000 in Q4, while non-Sybil addresses reached 1.2 million, compared to 550,000 Sybil and 320,000 non-Sybil addresses in Q3.
As shown in our charts, as of November 7, Base is the leading Layer 2 blockchain. It recently surpassed Arbitrum in Total Value Locked (TVL) and has maintained its position as the top Layer 2 for several months in daily active addresses and daily transactions.
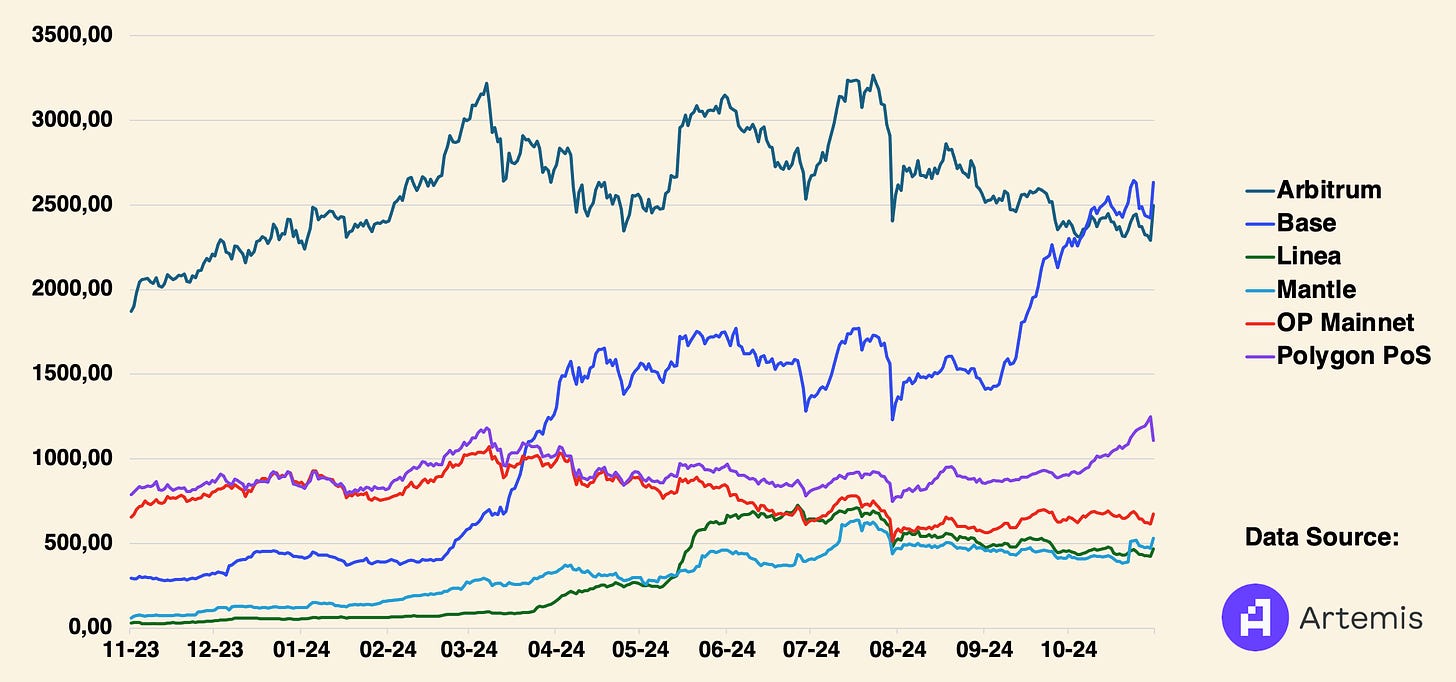
Total Value Locked in Smart Contracts (in millions USD)
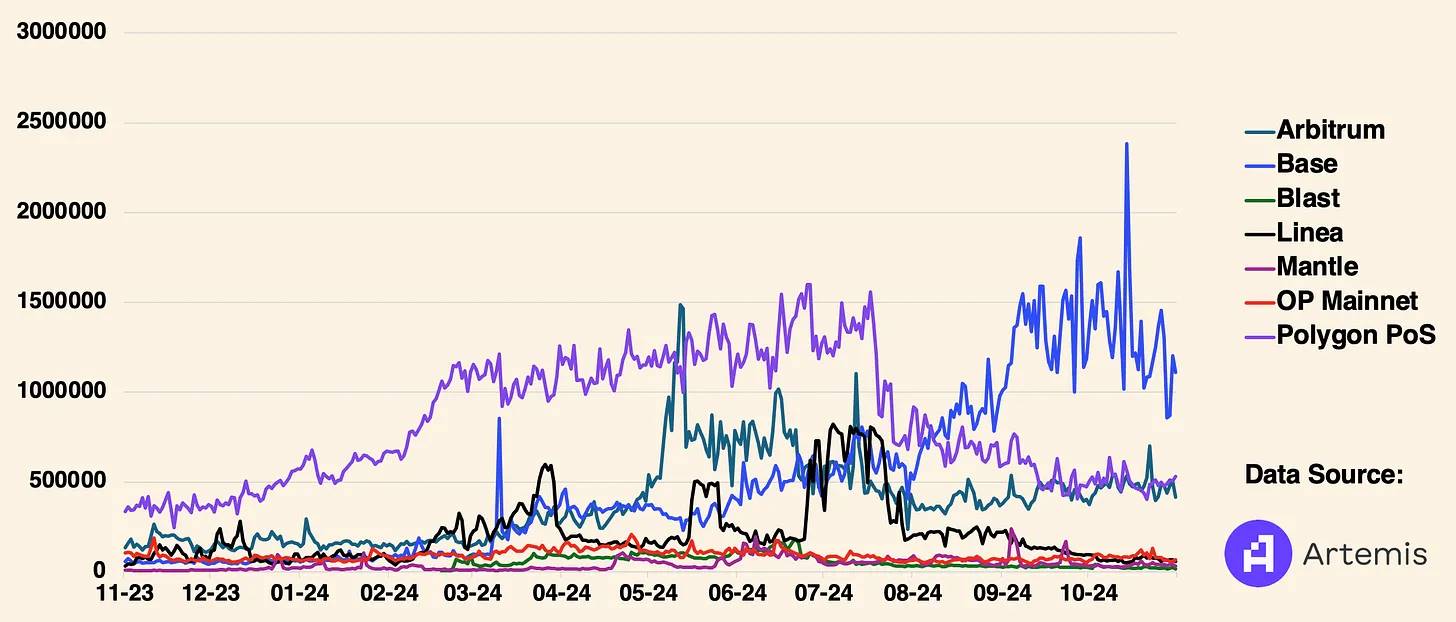
Daily Active Addresses (number of unique on-chain wallets interacting with protocols each day)
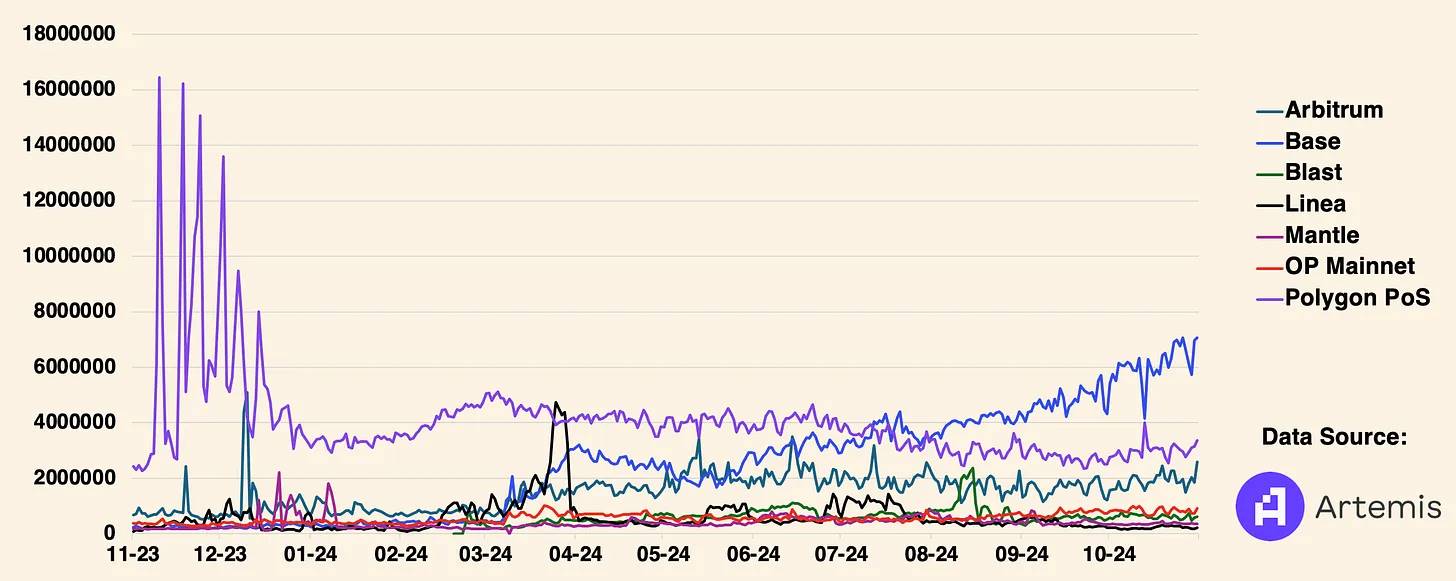
Daily Transactions (number of unique on-chain interactions with protocols)
Join TechFlow official community to stay tuned
Telegram:https://t.me/TechFlowDaily
X (Twitter):https://x.com/TechFlowPost
X (Twitter) EN:https://x.com/BlockFlow_News