Separating Truth from Falsehood: Stop Letting "Daily Active Addresses" Mislead Your Investment Research
TechFlow Selected TechFlow Selected
Separating Truth from Falsehood: Stop Letting "Daily Active Addresses" Mislead Your Investment Research
Rather than focusing on active addresses to study blockchain activity, it's better to examine network fee metrics.
Author: Donovan Choy
Translation: TechFlow
Better Use of Blockchain Metrics
Blockchains generate vast amounts of public data. On Crypto Twitter, people constantly compare blockchain A to blockchain B, and investors, researchers, and key opinion leaders (KOLs) have numerous metrics at their disposal when defending their views. However, misusing these numbers often clouds our understanding of the space.
In today’s 0xResearch article, we’ll explore three such metrics and their associated problems: active addresses, blockchain "profitability," and total value secured.
Active Addresses
"Active addresses" refers to how many active, paying users a protocol has.
The statement “Facebook has three billion monthly active users” is useful—it tells us something meaningful about the social network. Since spammers lack sufficient incentive to flood Facebook, active address counts serve as a decent proxy for assessing the platform's real consumer value.
But in blockchains, where creating new wallets is extremely easy and profit opportunities via airdrops or protocol incentives are obvious, active address counts become far less meaningful.
For example, the chart below shows an apparent fact: Solana had the highest number of daily active addresses over the past month, making it appear highly active.
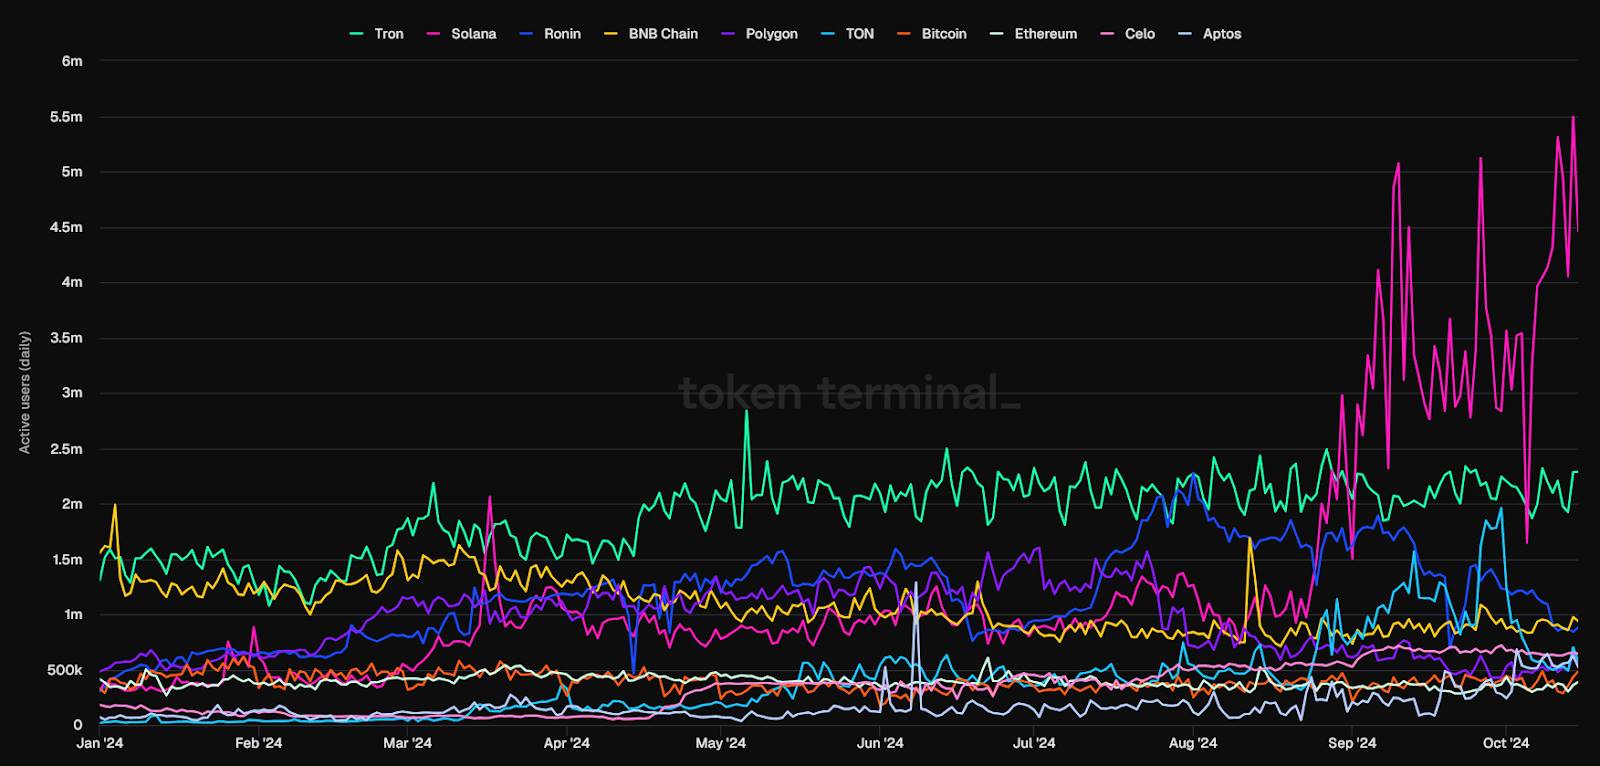
Source: TokenTerminal
Most Solana users trade on decentralized exchanges (DEXs), so we should examine DEX activity more closely. When we drill into Solana’s DEX active addresses, we find that in the past day, most addresses—about 3.4 million out of 4.4 million total—have lifetime trading volumes under $10.
This suggests that due to Solana’s low transaction fees, there may be significant spam or bot activity rather than a large number of “high-quality” users.
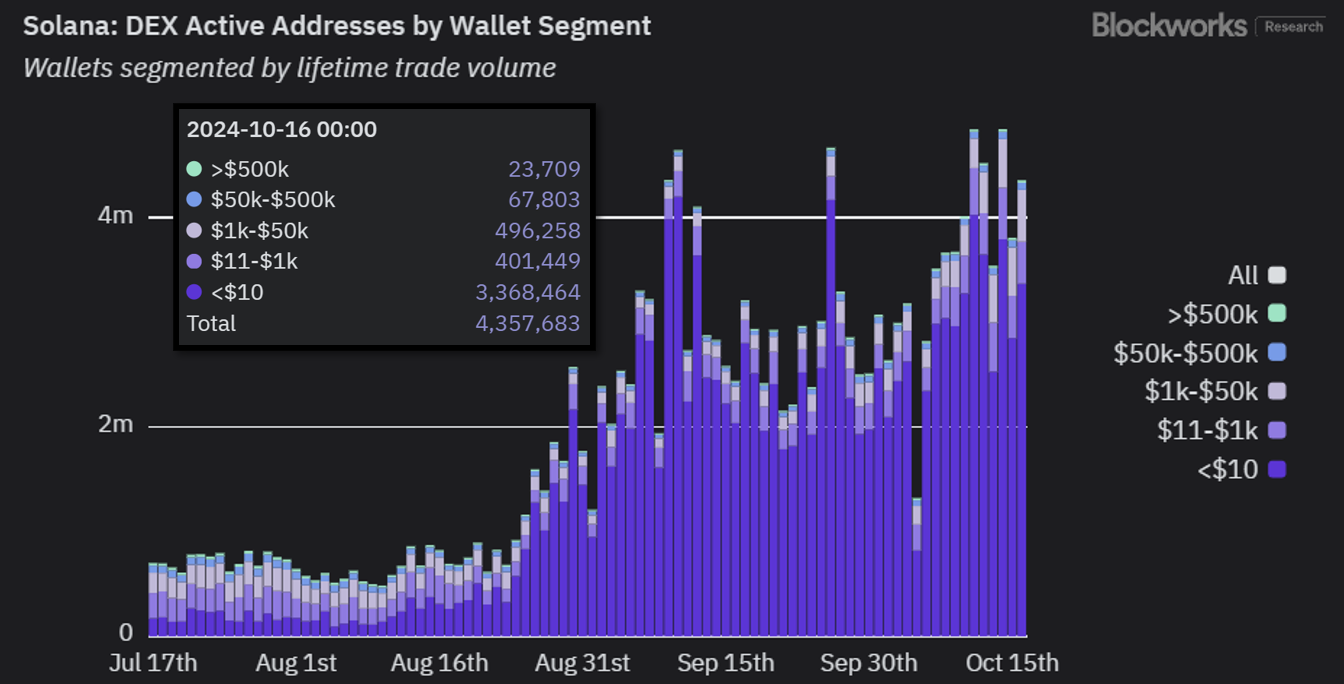
Source: Blockworks Research
Here’s another example I mentioned earlier: Celo L1 (now an L2) saw its daily active addresses sending stablecoins spike to 646,000 in September—surpassing Tron—and drawing attention from Vitalik Buterin and CoinDesk.
Upon deeper analysis, Jack Hackworth, a data analyst at Variant Fund, found that 77% of those Celo addresses transferred less than two cents, primarily because thousands of users were receiving tiny payouts through GoodDollar, a universal basic income protocol. In both cases, active address counts suggested high usage, but closer inspection reveals this claim doesn’t hold up.
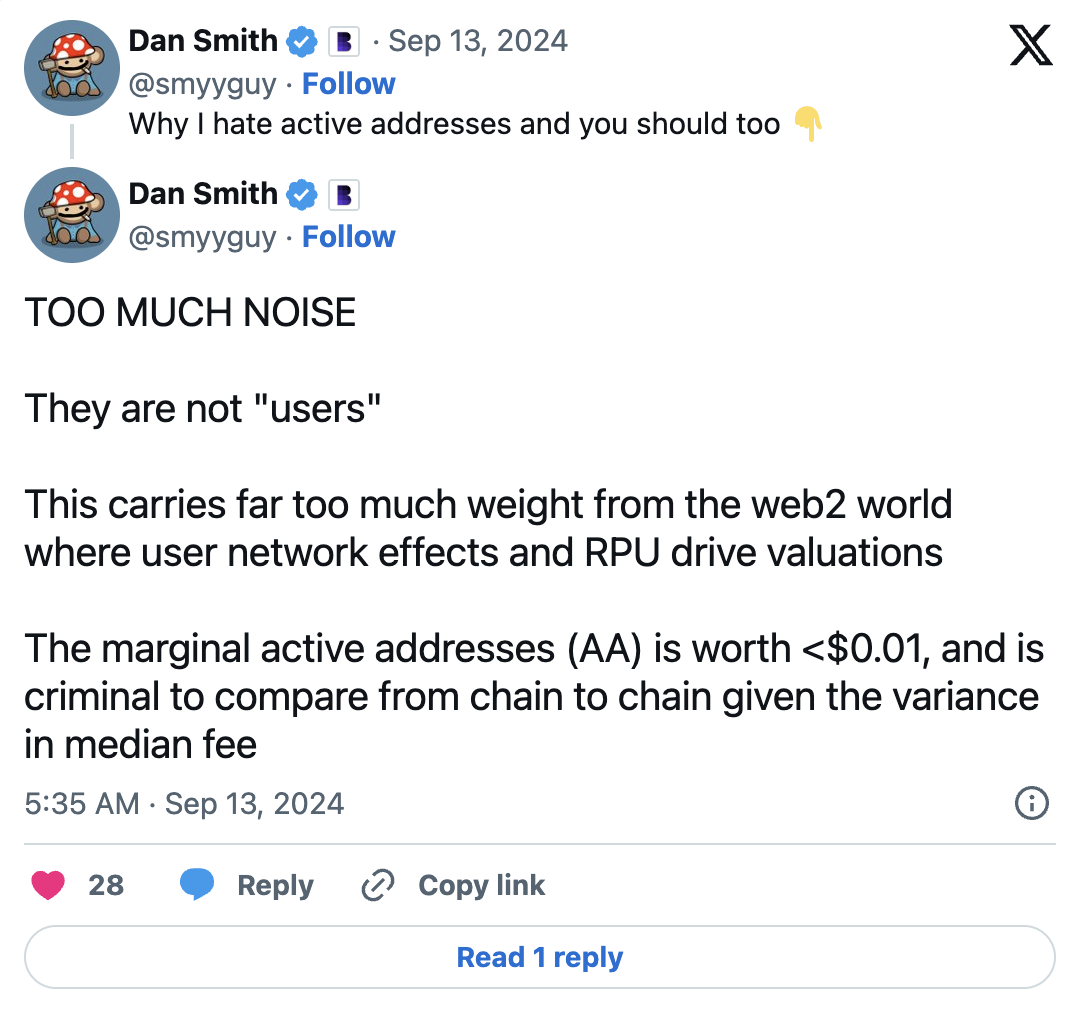
For further reading, see research by Dan Smith, who focuses on the misuse of daily active address metrics.
Blockchain Profitability
Rather than focusing on active addresses, one might instead look at fee metrics to assess blockchain activity. Fees reflect total gas consumption on a protocol, regardless of whether users are “high-quality.”
Fees are commonly used by analysts and investors to determine which blockchains generate the most “revenue.” Then, token issuance paid to validators is treated as a cost, resulting in a measure of blockchain “profitability.”
This is how Token Terminal generates “financial statements” for crypto protocols. For instance, the chart below shows Ethereum L1 accumulating millions of dollars in losses over the past two months.
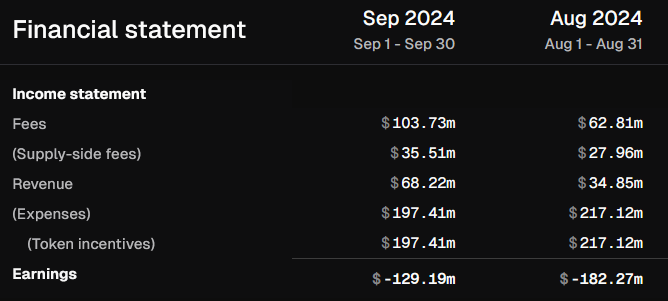
Source: Token Terminal
The only issue is that this calculation overlooks a critical factor: unlike PoW chains like Bitcoin, users on PoS chains can also easily earn rewards from token issuance.
After all, if I can earn 5% staking yield on ETH/SOL via liquid staking platforms like Lido or Jito, why should I care whether the network is “unprofitable”? Thus, treating token issuance as a cost—and concluding “Ethereum is unprofitable”—is problematic.
In the real world, inflation is harmful because when central banks print money, the increased money supply reaches different economic participants at different times, benefiting early recipients before “real” prices adjust—a phenomenon known as the Cantillon Effect.
In PoS blockchain economies, this isn’t the case—the inflation (i.e., token issuance) is distributed simultaneously to all participants. Therefore, no one becomes richer or poorer; everyone’s wealth remains unchanged.
Instead, we could consider using Realized Economic Value (REV) as an alternative metric. REV combines network fees and MEV tips paid to validators, but does not treat token issuance as a cost.
Based on this, we see that Ethereum has actually been profitable over the past two months:
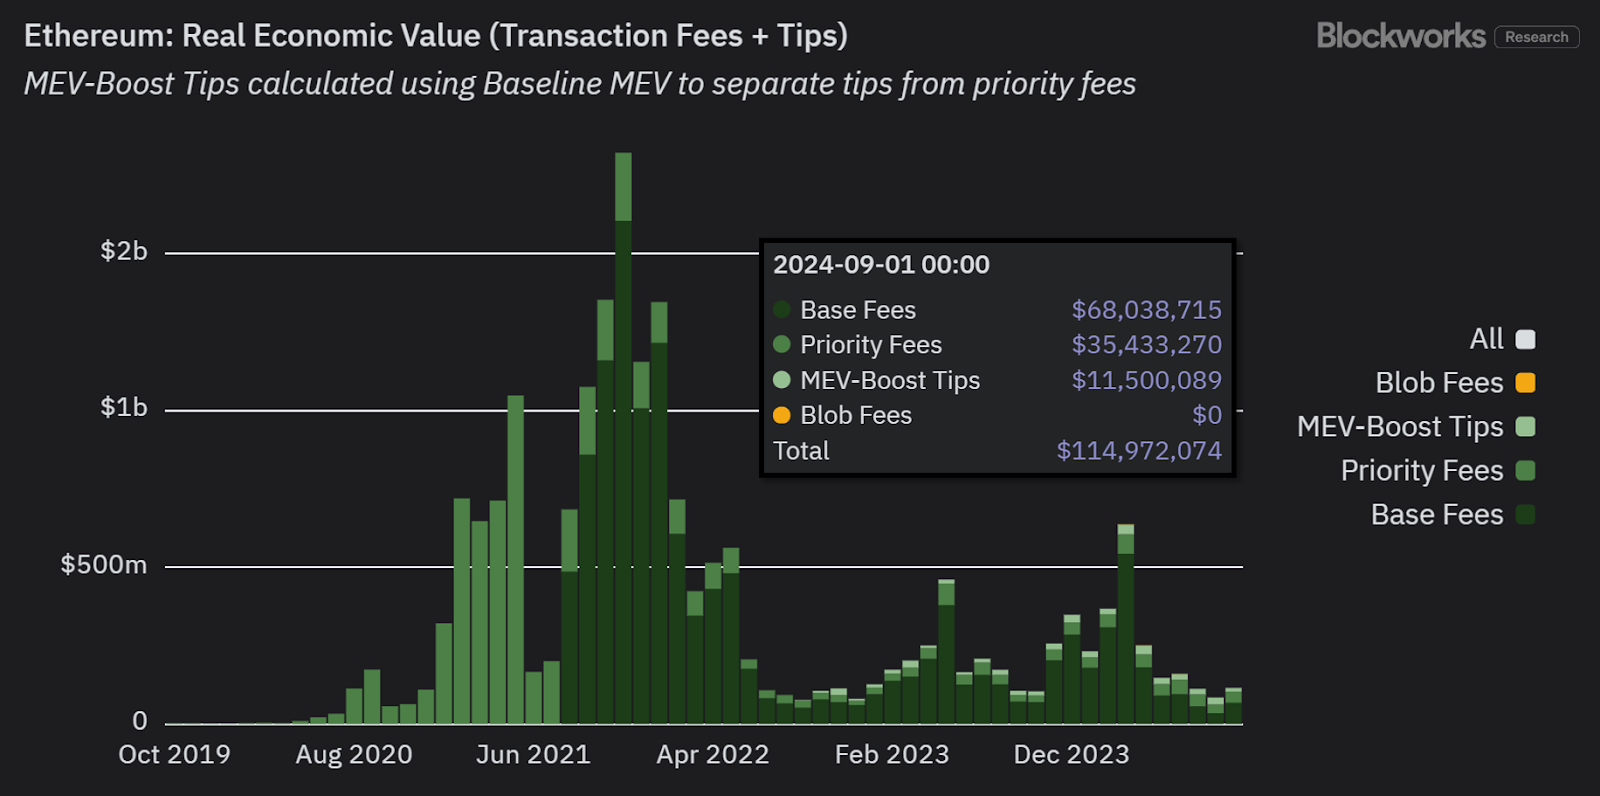
Source: Blockworks Research
REV is arguably a better indicator of true network demand and a more comparable revenue metric to traditional finance (TradFi).
In short, conventional profit-and-loss accounting doesn’t translate directly to blockchains.
To learn more about this complex topic, listen to the recent Bell Curve podcast episode with Jon Charbonneau.
Total Transaction Value (TTV), Not Total Value Secured (TVS)
Oracles are critical infrastructure enabling blockchains to access off-chain data. Without oracles like Chainlink, blockchain economies couldn’t reliably reflect real-world prices.
A common way to compare oracle provider market share is the “Total Value Secured” (TVS) metric, which aggregates all TVL secured by oracles. This is exactly how DefiLlama calculates it:
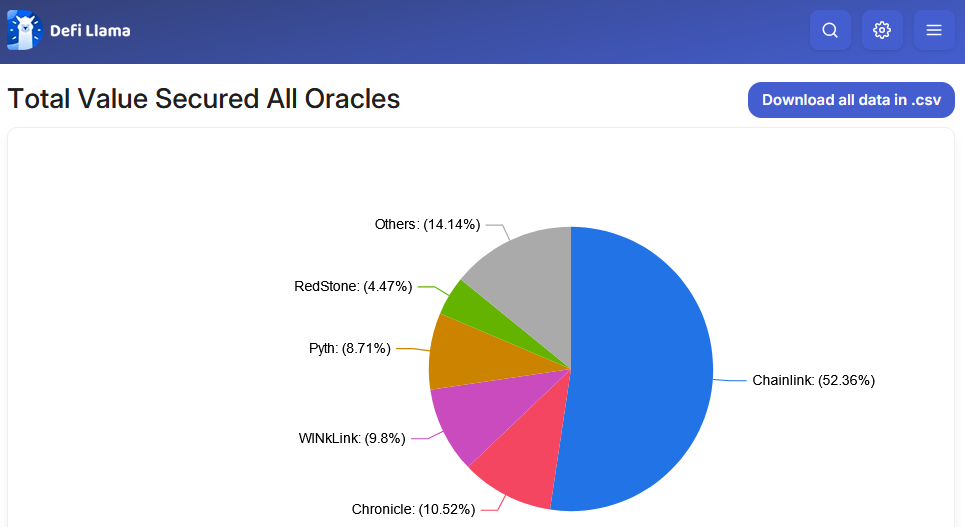
Source: DefiLlama
The problem with TVS is that it obscures the actual activity oracles are securing.
For example, oracles supporting high-frequency products like perpetual futures exchanges constantly “pull” price updates from off-chain sources with sub-second latency.
This contrasts with “push-based” oracles used in lending protocols, which only need to update prices on-chain a few times per day since frequent updates aren’t necessary.
TVS focuses on the total value managed by oracles but ignores the performance intensity of oracle providers.
In other words, it’s like saying a premium steak and a simple salad are both priced at $50 on a menu, so they offer equal value to diners. Clearly, preparing the steak requires significantly more effort than the salad—an important distinction.
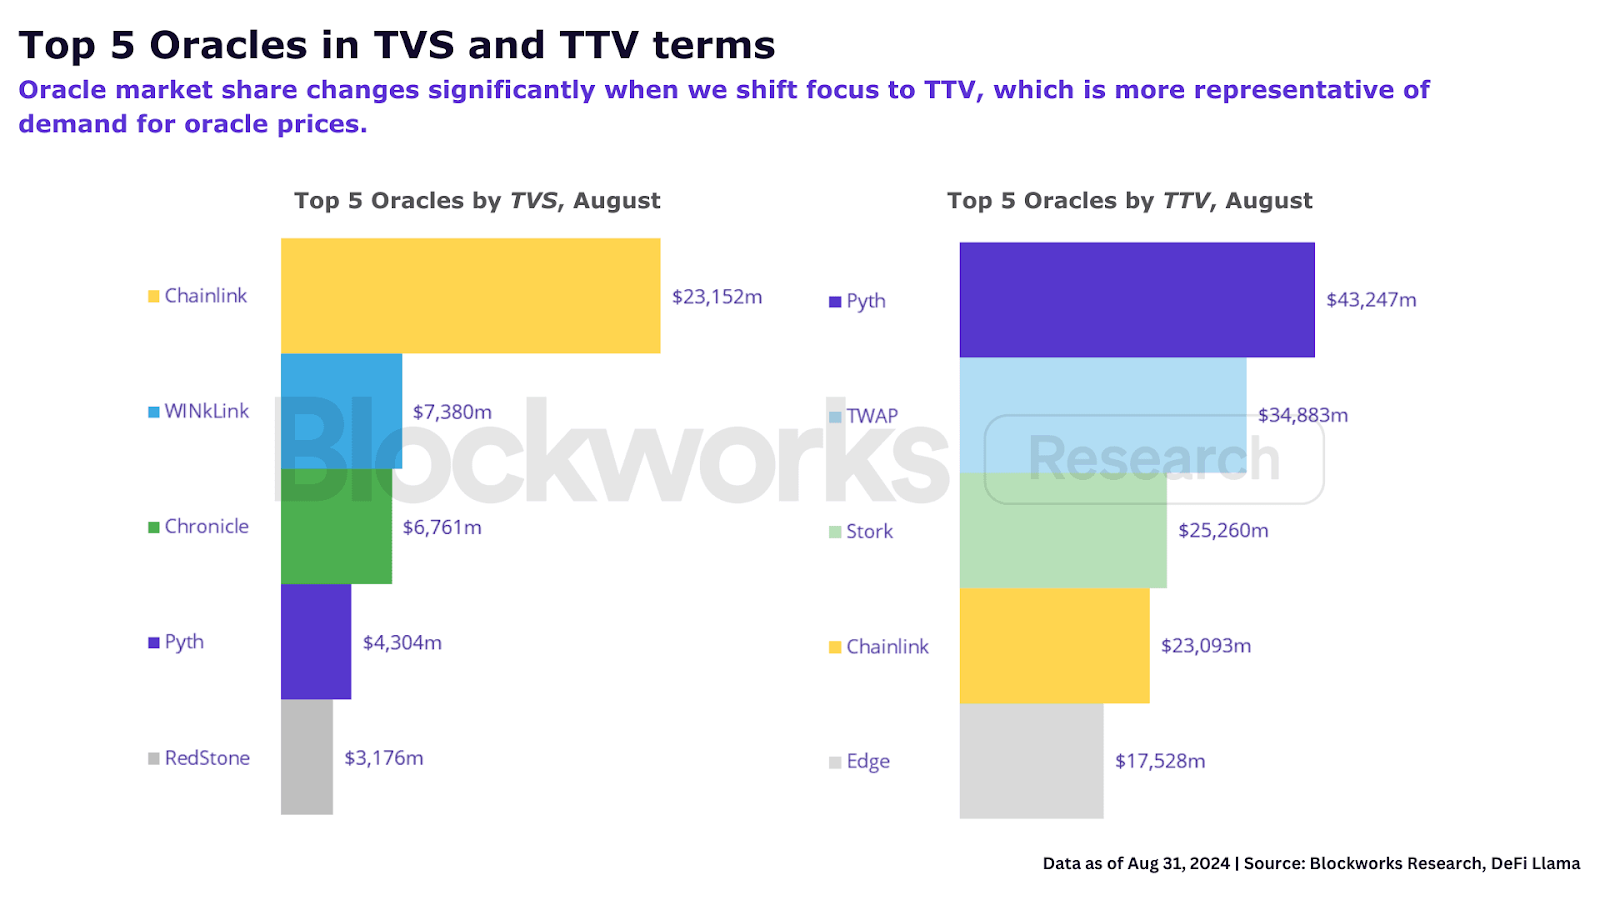
An alternative metric is Total Transaction Value (TTV), which accounts for recurring transaction volume driven by oracle price updates.
TTV excludes low-frequency applications like lending, CDPs, and restaking. As Ryan Connor explains, “Only 2–9% of oracle price updates come from these low-frequency protocols, which is small in the context of crypto given the high volatility of base metrics.”
When oracles are assessed using TTV, market share shifts significantly.
To learn more, refer to Blockworks Research’s report on how TTV better reflects oracle fundamentals.
Join TechFlow official community to stay tuned
Telegram:https://t.me/TechFlowDaily
X (Twitter):https://x.com/TechFlowPost
X (Twitter) EN:https://x.com/BlockFlow_News