Cross-chain Bridge Deep Dive: From the "Router" of On-chain Capital to a New Economic Engine for Value Capture
TechFlow Selected TechFlow Selected
Cross-chain Bridge Deep Dive: From the "Router" of On-chain Capital to a New Economic Engine for Value Capture
Cross-chain bridges appear to generate more revenue per user and per dollar locked than many other protocols.
Author: Joel John
Translation: TechFlow

The killer app for crypto has already arrived—in the form of stablecoins. In 2023, Visa processed nearly $15 trillion in transactions, while stablecoin transaction volume reached approximately $20.8 trillion. Since 2019, stablecoins have moved $221 trillion between wallets.
In recent years, an amount of capital equivalent to global GDP has flowed across blockchains. Over time, this capital has accumulated across different networks. Users switch between protocols in search of better financial opportunities or lower transfer costs. With the emergence of chain abstraction, users may not even realize they are using a cross-chain bridge.
Cross-chain bridges can be thought of as routers for capital. When you access any website on the internet, a complex backend network ensures that the bits and bytes are delivered accurately. A key component of this system is the physical router in your home, which determines how data packets are routed so you receive the information you need as quickly as possible.
Today, cross-chain bridges play a similar role in on-chain capital flows. When a user wants to move from one chain to another, the bridge determines how funds are routed to deliver maximum value or speed.
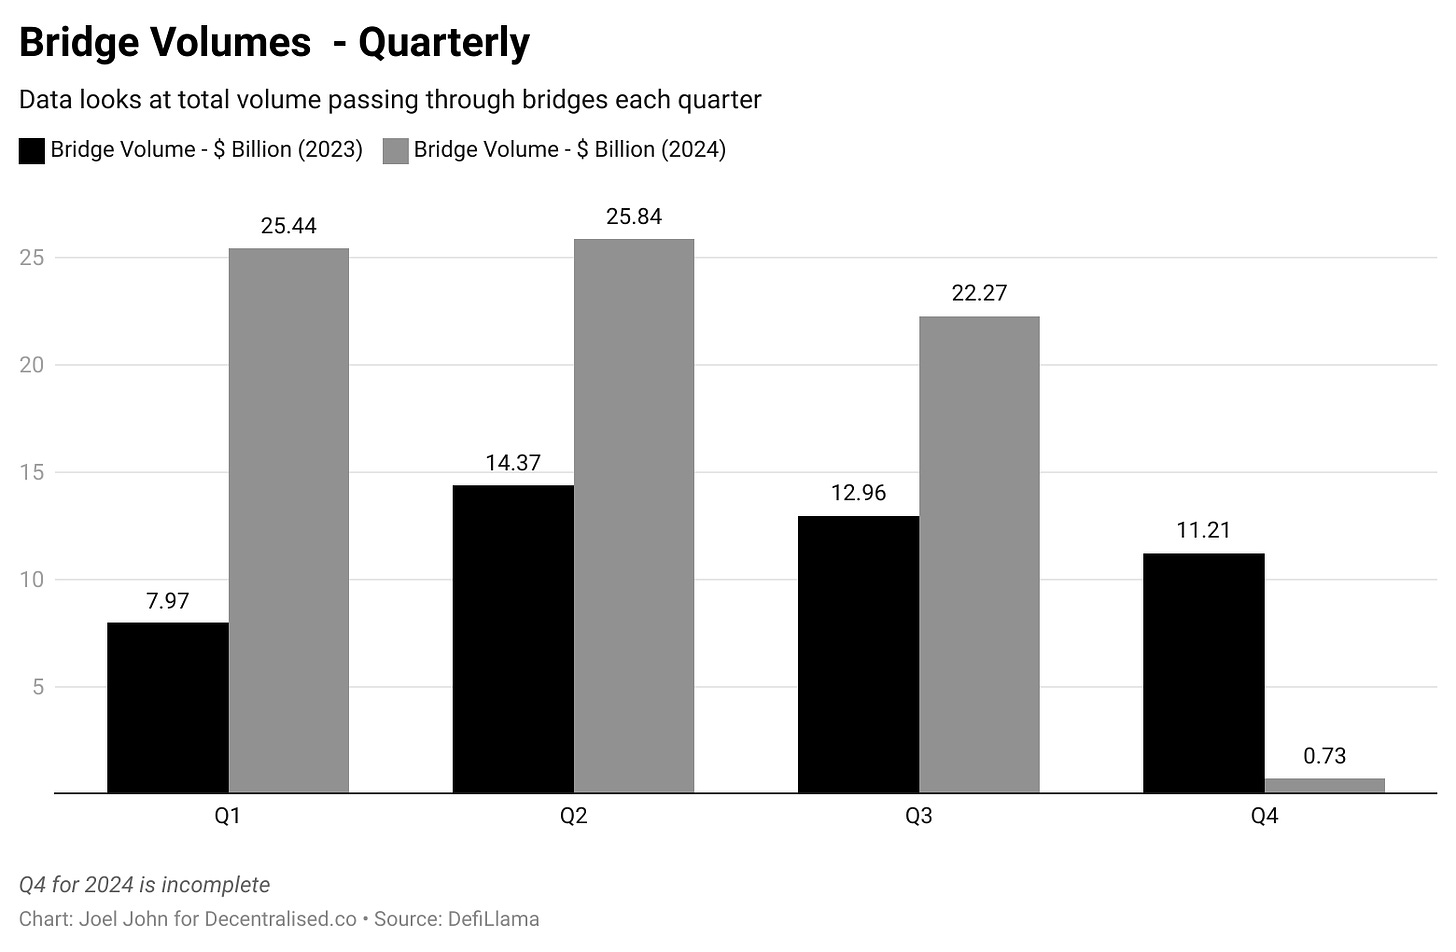
Since 2022, cross-chain bridges have facilitated nearly $222.7 billion in transactions—far less than the volume of stablecoin transfers moving across chains. However, bridges appear to generate higher revenue per user and per dollar locked than many other protocols.
Today’s discussion explores the business models behind cross-chain bridges and collaboratively examines the revenue generated through bridge transactions.
Revenue Breakdown
Since mid-2020, blockchain cross-chain bridges have cumulatively collected nearly $104 million in fees. This figure is somewhat seasonal, as users flock to bridges when new applications emerge or economic opportunities arise. Bridges suffer when there are no yields, meme tokens, or financial instruments available, since users tend to stick with the protocols they know best.
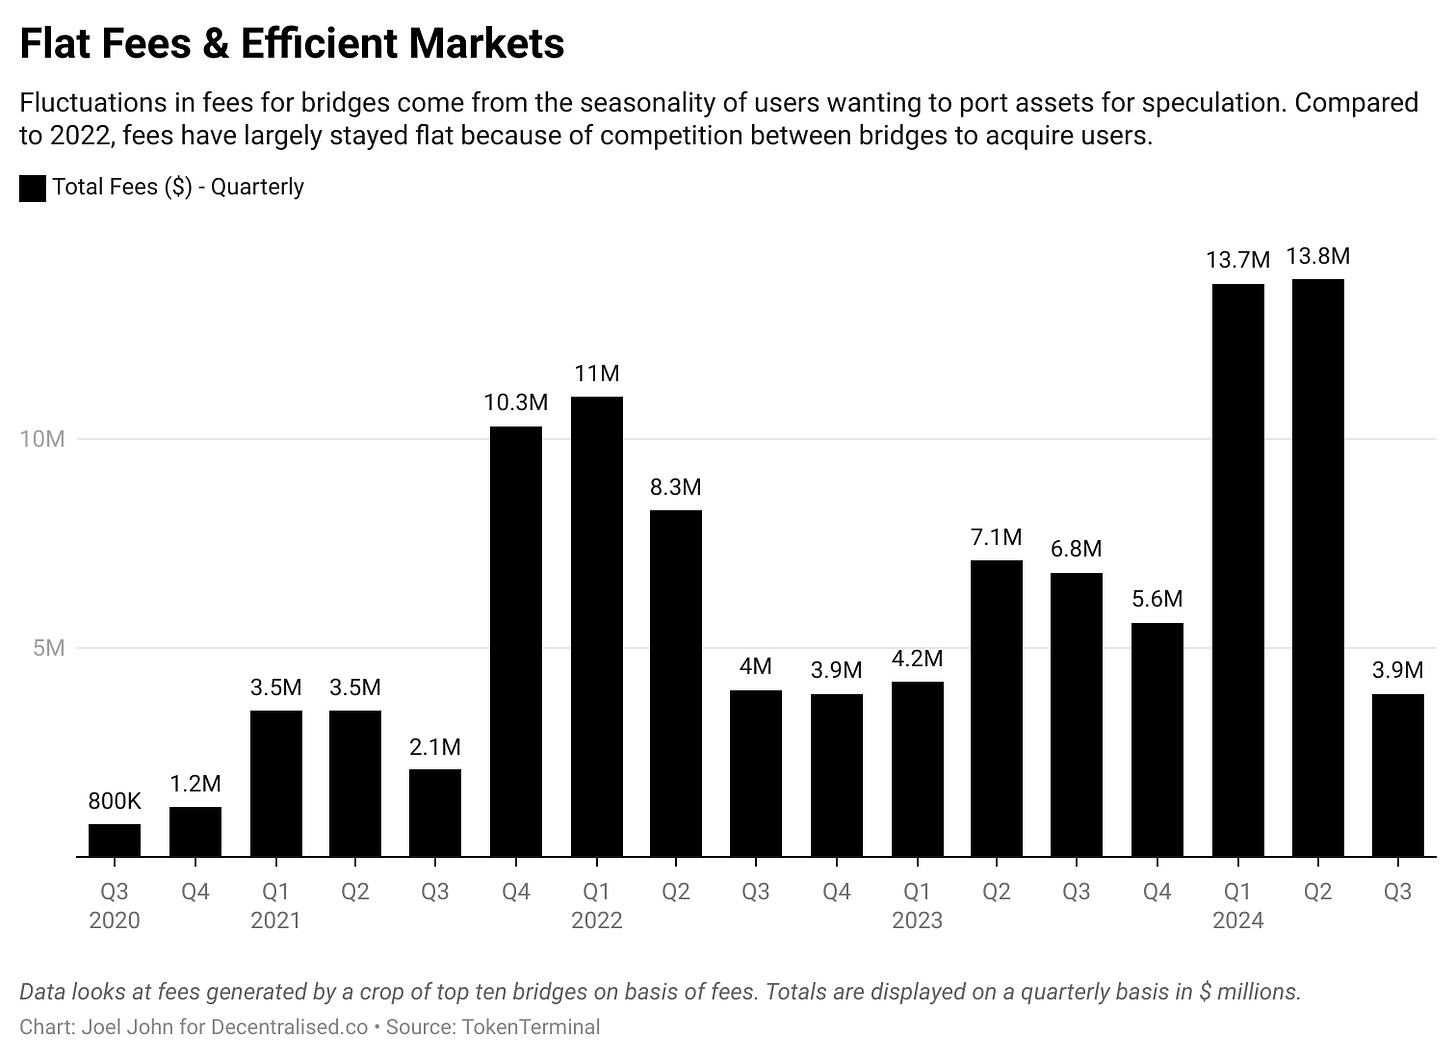
A rather sad (but interesting) comparison is between bridge revenue and platforms like PumpFun, a meme-coin platform. PumpFun has generated $70 million in fees, while cross-chain bridges have generated $13.8 million.
Even as transaction volumes rise, fees remain flat due to ongoing price wars between chains. To understand how such efficiency is achieved, it helps to examine how most cross-chain bridges work. One way to conceptualize them is by drawing an analogy to the Hawala network from a century ago.
Cross-chain bridges resemble Hawala, connecting physically separated locations via cryptographic signatures.
While Hawala is now commonly associated with money laundering, a century ago it was an efficient method for moving funds. For example, in the 1940s, if you wanted to send $1,000 from Dubai to Bangalore—when the UAE still used Indian rupees—you had several options.
You could go through a bank, which might take days and require extensive documentation, or you could visit the gold market and find a merchant. The merchant would take your $1,000 and instruct a counterpart in India to pay an equivalent amount to someone you trust in Bangalore. The money never crossed borders; it simply moved between India and Dubai.
How did this work? Hawala operated on trust, as merchants in the gold market and their Indian counterparts typically had long-standing trade relationships. Instead of transferring cash directly, they might later settle balances through goods like gold. Because these transactions relied on mutual trust, both parties needed confidence in each other's integrity and cooperation.
What does this have to do with cross-chain bridges? Their operational model is quite similar. Suppose you want to move funds from Ethereum to Solana for yield farming instead of sending money from Bangalore to Dubai. Cross-chain bridges like LayerZero facilitate this by passing messages between users, allowing them to borrow tokens on one chain and lend on another.
Imagine instead of locking assets or handing over gold bars, the two traders give you a code redeemable for capital at either location. This code functions as a message-passing mechanism. Bridges like LayerZero use technical components called endpoints—smart contracts deployed across different chains. A smart contract on Solana may not directly understand a transaction on Ethereum, which is where oracles come in. LayerZero uses Google Cloud as a validator for cross-chain transactions. Even at the frontier of Web3, we still rely on Web2 giants to help build better economic systems.
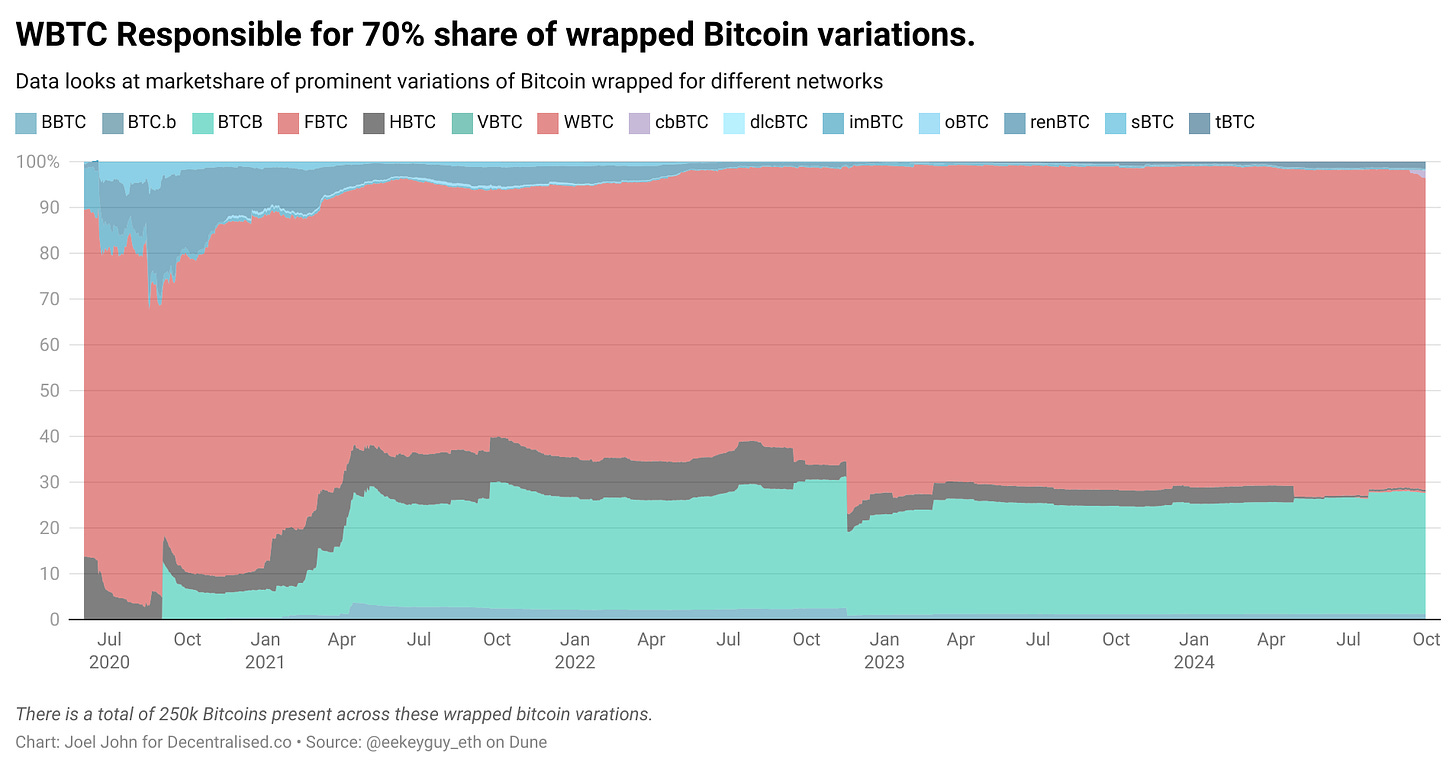
Now imagine the participating traders don’t trust their own ability to interpret the code. After all, not everyone can use Google Cloud to verify transactions. An alternative is asset locking and minting. In this model, if you use Wormhole, you lock your assets in a smart contract on Ethereum and receive a wrapped asset on Solana. It’s like the Hawala merchant giving you a gold bar in India while you deposit dollars in the UAE. An asset is minted in India and handed to you. As long as you return the gold bar, you can speculate with it in India and reclaim your original capital in Dubai. Wrapped assets on different chains are analogous to gold bars—except their value usually remains pegged across both chains.
The image below shows various versions of wrapped Bitcoin today. Many were created during DeFi Summer to generate yield using Bitcoin on Ethereum.
Cross-chain bridges have several key revenue streams:
-
Total Value Locked (TVL)—When users deposit capital, these funds can be used to generate yield. Currently, most bridges do not lend out idle capital but instead charge a small fee per transaction when users transfer capital between chains.
-
Relayer fees—These are small fees charged by third parties (such as Google Cloud in LayerZero) for validating transactions across multiple chains.
-
Liquidity provider fees—Paid to individuals who deposit capital into bridge smart contracts. Suppose you’re running a Hawala network and someone wants to transfer $100 million from one chain to another. You might not have enough capital yourself. Liquidity providers pool funds to enable such transactions. In return, each provider earns a share of the fees generated.
-
Minting fees—Bridges can charge small fees when minting assets. For example, WBTC charges 10 basis points per bitcoin. Among these, the main expenses for bridges involve maintaining relayers and paying liquidity providers. They create value on TVL through transaction fees and asset minting at both ends of a transfer. Some bridges also use incentivized staking models. Suppose you need to send $100 million via Hawala overseas—you might require some form of economic collateral to ensure the counterparty has sufficient funds.
He might gather friends in Dubai to co-invest, proving his capacity to complete the transfer. In exchange, he might even share part of the fee. Structurally, this resembles staking—except instead of dollars, users pool the network’s native token to earn more tokens in return.
So how much revenue can all this generate? What is the value of a dollar or a user within these products?
Economics
The following data may not be perfectly accurate, as not all fees belong to the protocol. Sometimes, fees depend on the protocol used and the assets involved. If a bridge primarily handles low-liquidity long-tail assets, users may face slippage in trades. Therefore, when examining unit economics, I want to clarify that the following does not reflect which bridge is superior. Our focus is on how much value is created across the entire supply chain during a cross-chain event.
A good starting point is to look at transaction volume and fees generated by each protocol over 90 days. These metrics cover data up to August 2024, so the numbers reflect the previous 90-day period. We assume Across has higher volume due to its lower fees.

This gives a rough idea of how much capital flows through bridges in any given quarter and the fees generated during that time. We can use this data to calculate how much fee revenue a bridge generates per dollar passing through its system.
For readability, I calculated the fees incurred when transferring $10,000 across these bridges.
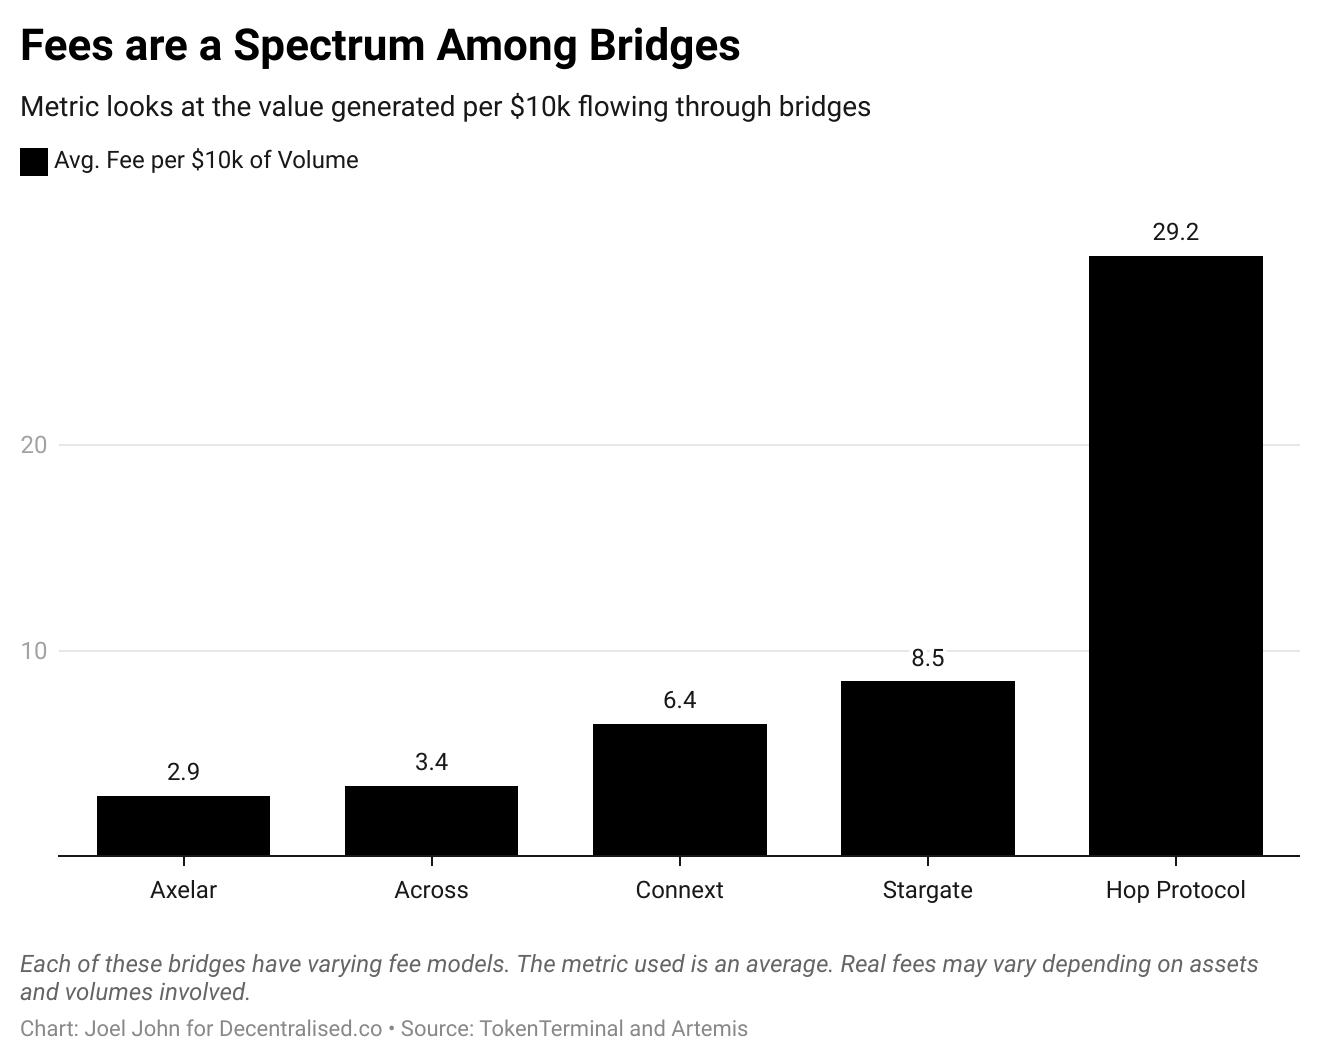
Before proceeding, I want to clarify: this doesn’t mean Hop charges ten times what Axelar does. Rather, in a $10,000 transfer, a bridge like Hop creates $29.20 in value across the entire value chain (e.g., liquidity providers, relayers, etc.). These metrics vary because the nature and types of transfers supported differ.
Interestingly, we can compare the value captured by protocols versus that captured by bridges.
As a benchmark, we examined transfer costs on Ethereum. At the time of writing, Ethereum gas fees during low congestion periods are around $0.0009179, compared to $0.0000193 on Solana. Comparing bridges to L1s is somewhat like comparing routers to computers. Storing files on a computer is far cheaper. But our question is whether, from an investment standpoint, bridges capture more value than L1s.
From this perspective, combining the above metrics, one way to compare them is by looking at the dollar fees captured per transaction by individual bridges versus Ethereum and Solana.
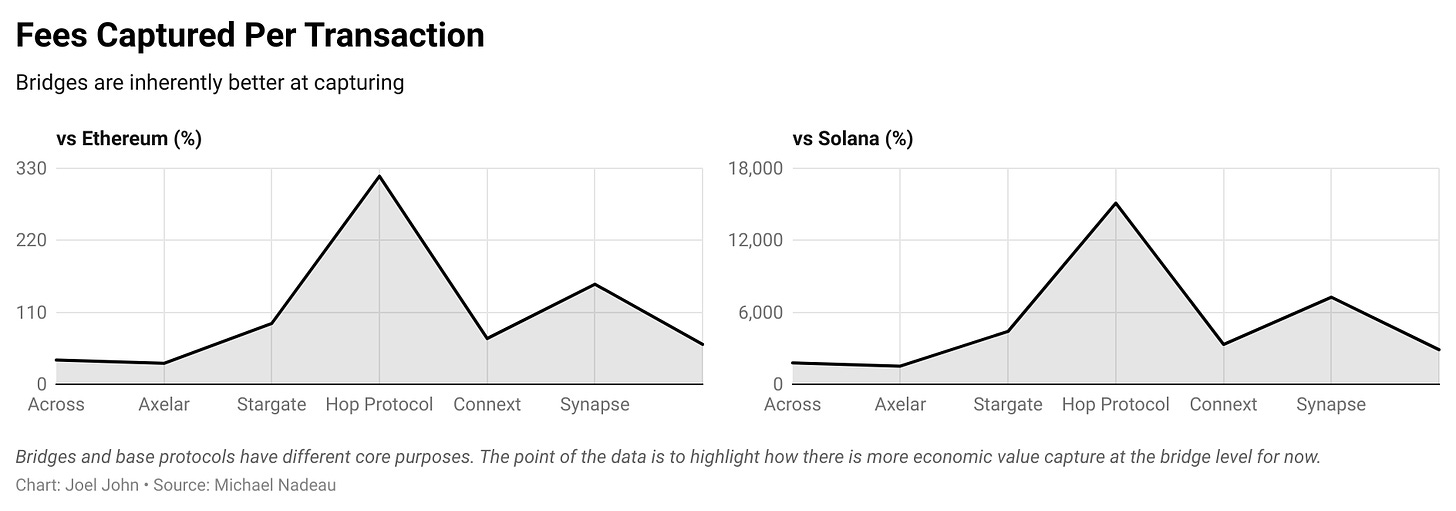
Several bridges capture lower fees than Ethereum because of the gas costs incurred when bridging on Ethereum.
One might argue that Hop captures up to 120 times more value than Solana. But this misses the point, as the two networks have vastly different fee models. What interests us is the difference between economic value capture and valuation, as we’ll soon see.
Among the top seven bridge protocols, five charge lower fees than Ethereum L1. Axelar is the cheapest, charging just 32% of Ethereum’s average fee over the past 90 days. Currently, Hop Protocol and Synapse have higher fees than Ethereum. Compared to Solana, we see that high-throughput L1 settlement fees are orders of magnitude cheaper than current cross-chain bridge protocols.
To further enrich this analysis, we can compare transaction costs on L2s within the EVM ecosystem. For context, Solana’s fees are just 2% of Ethereum’s regular fees. In this comparison, we’ll consider Arbitrum and Base. Since L2s are designed for extremely low fees, we’ll use a different metric to measure economic value—average daily fees per active user.
During the 90-day period covered in our data collection, Arbitrum averaged 581,000 daily users, generating $82,000 in daily fees. Similarly, Base averaged 564,000 daily users and $120,000 in daily fees.
In contrast, bridges have significantly fewer users and lower fees. The highest is Across, with 4,400 users and $12,000 in fees. Thus, we estimate Across generates an average of $2.40 in fees per user per day. This metric can then be compared to Arbitrum or Base to assess per-user economic value.

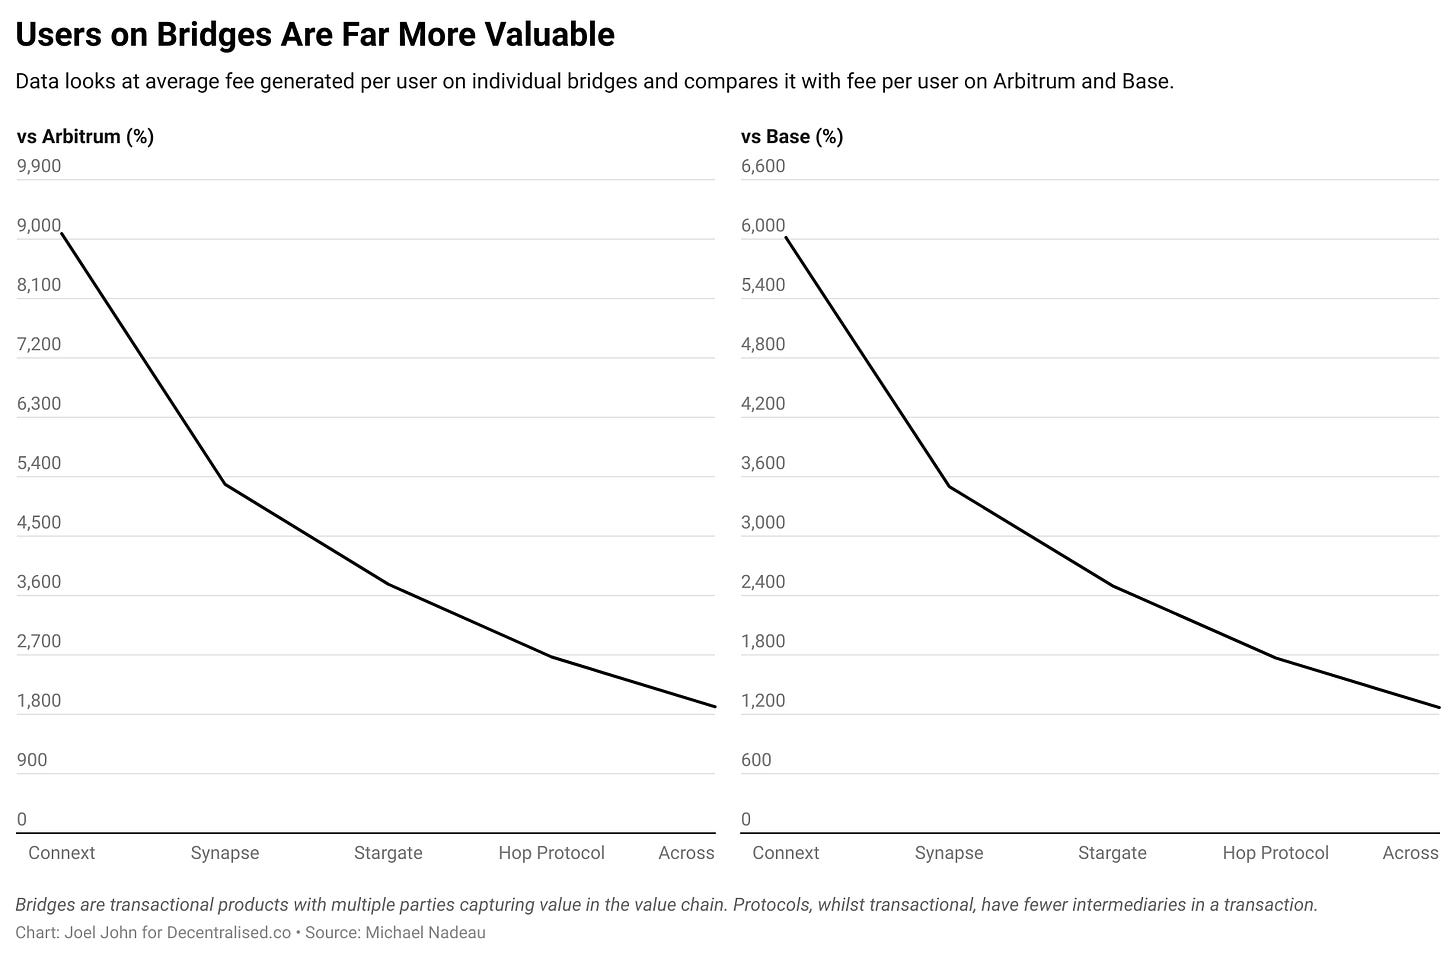
The average user on a bridge is more valuable than the average user on an L2. A Connext user generates 90 times more value than an Arbitrum user. This is admittedly an apples-to-oranges comparison, since bridging on Ethereum incurs relatively high gas fees, but it highlights two clear points.
-
Fund routers like today’s cross-chain bridges may be one of the few product categories in crypto capable of generating meaningful economic value.
-
As long as transaction fees remain prohibitively high, we may not see users migrating to L1s like Ethereum or Bitcoin. Users might instead be onboarded directly to L2s (like Base), with developers absorbing gas costs. Alternatively, users may only shift between low-cost networks.
Another way to compare bridge economics is against decentralized exchanges (DEXs). Functionally, both enable token conversion. DEXs allow swaps between assets, while bridges enable token transfers across blockchains.
The above data covers only Ethereum-based DEXs.
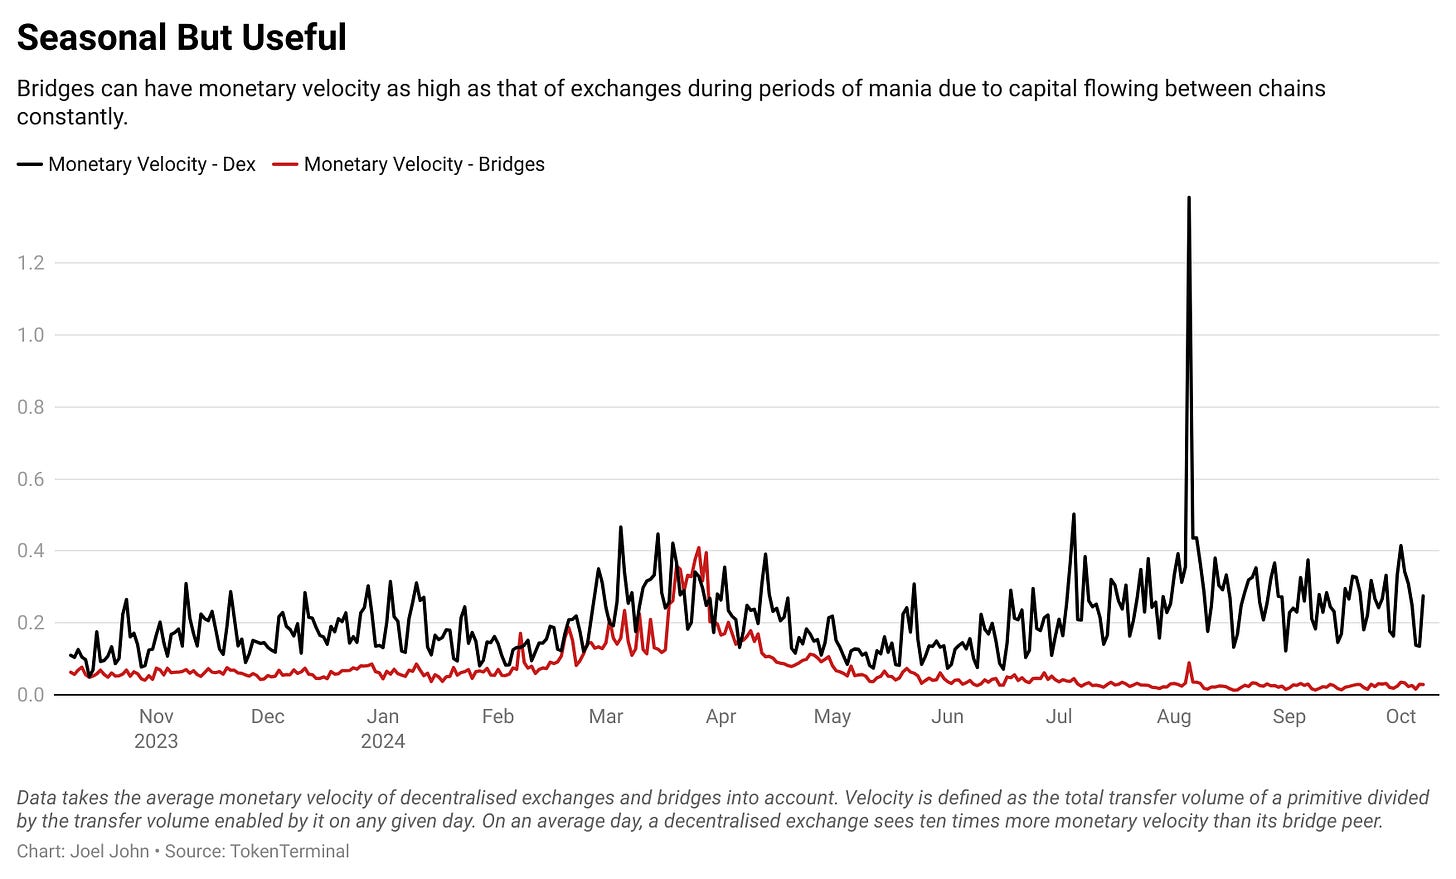
Rather than comparing fees or revenue directly, I focus on velocity of capital—the rate at which capital circulates between smart contracts on bridges or DEXs. To measure this, I divide the daily transfer volume by TVL for both bridges and DEXs.
As expected, DEXs exhibit much higher capital velocity, since users frequently swap assets multiple times per day.
However, interestingly, when excluding large L2-focused bridges (such as native bridges for Arbitrum or Optimism), the velocity gap between bridges and DEXs narrows significantly.
Perhaps in the future, bridges will limit the capital they accept, instead focusing on maximizing returns by increasing capital velocity. That is, if a bridge can cycle capital multiple times per day and pass fees to a small group of capital depositors, it could generate higher yields than most other sources in crypto today.
Such a bridge might maintain more stable TVL than traditional bridges, since expanding deposited capital leads to diminishing returns.
Are Bridges Really Routers?

Source: Wall Street Journal
If you think venture capital rushing into "infrastructure" is a new trend, let’s take a historical detour. In the 2000s, when I was a child, Silicon Valley was obsessed with Cisco. Logically, if internet traffic grows, routers should capture significant value. Like today’s NVIDIA, Cisco was a premium stock because it built the physical infrastructure underpinning the internet.
The stock peaked at $80 on March 24, 2000, and trades at $52 as of this writing. Unlike many dot-com bubble stocks, Cisco never recovered. Writing this amid meme-coin mania, I wonder how much value cross-chain bridges can actually capture. They benefit from network effects, but the market may end up winner-takes-all. The space is increasingly shifting toward intent- and solver-based models, with centralized market makers fulfilling orders behind the scenes.
In the end, most users don’t care about the decentralization level of the bridge they use—they only care about cost and speed.
-
In such a world, early 2020s cross-chain bridges may resemble physical routers—eventually replaced by intent- or solver-based networks akin to the internet’s 3G evolution.
Bridges have matured, and we’re seeing diverse approaches to solving the old problem of cross-chain asset transfers. One major driver of change is chain abstraction, a mechanism enabling seamless asset transfers without users realizing it. Shlok recently experienced this firsthand via Particle Network's universal account.
Another way to drive volume is through product innovation in distribution or positioning. Last night, while researching meme coins, I noticed how IntentX leverages intents to integrate Binance’s perpetual markets into a decentralized exchange product. We’re also seeing chain-specific bridges evolve to make their offerings more competitive.
No matter the approach—it’s clear that, like decentralized exchanges, cross-chain bridges are hubs for large-scale capital movement. As infrastructure, they will continue to exist and evolve. We believe domain-specific bridges (like IntentX) or user-centric bridges (enabled by chain abstraction) will become the primary drivers of growth in this space.
Shlok added during our discussion that physical routers of the past never captured economic value based on data volume transferred. Whether you downloaded a TB or a GB, Cisco earned roughly the same. In contrast, bridges earn based on the number of transactions they facilitate. In every sense, their fate may be different.
For now, it’s safe to say that what we’re seeing in cross-chain bridges mirrors the development of physical infrastructure for internet data routing.
Join TechFlow official community to stay tuned
Telegram:https://t.me/TechFlowDaily
X (Twitter):https://x.com/TechFlowPost
X (Twitter) EN:https://x.com/BlockFlow_News