Analyzing the Economic Value of Cross-Chain Bridges: The Cisco of the Blockchain Era?
TechFlow Selected TechFlow Selected
Analyzing the Economic Value of Cross-Chain Bridges: The Cisco of the Blockchain Era?
Ordinary users on cross-chain bridges are more valuable than those on L2s.
Author: Joel John
Translation: Luffy, Foresight News
The killer app for cryptocurrency has arrived — it's stablecoins. In 2023, Visa processed nearly $15 trillion in transaction volume; stablecoins reached $20.8 trillion. Since 2019, stablecoins have transferred a total of $221 trillion between wallets.
Over the past few years, an amount of capital equivalent to global GDP has been flowing across blockchains. Over time, this capital accumulates across different networks. Users switch between protocols to access better financial opportunities or lower transfer costs; in the era of chain abstraction, users may not even realize they're using cross-chain bridges.
Cross-chain bridges can be seen as routers for capital. When you visit any website on the internet, a complex network operates behind the scenes. Your home router is critical to this infrastructure — it determines how data packets are routed so you get the information you need in the shortest possible time.
Today, cross-chain bridges play the same role in on-chain capital flows. When a user wants to move from one chain to another, the bridge decides how to route funds to maximize value or speed for their capital.
Since 2022, cross-chain bridges have facilitated over $100 billion in transaction volume. This pales in comparison to the volume moved by stablecoins on-chain. But compared to many other protocols, bridges generate higher profits per user and per dollar locked.
This article will explore the business models behind cross-chain bridges and the economics of transactions flowing through them.
The Business Model of Cross-Chain Bridges
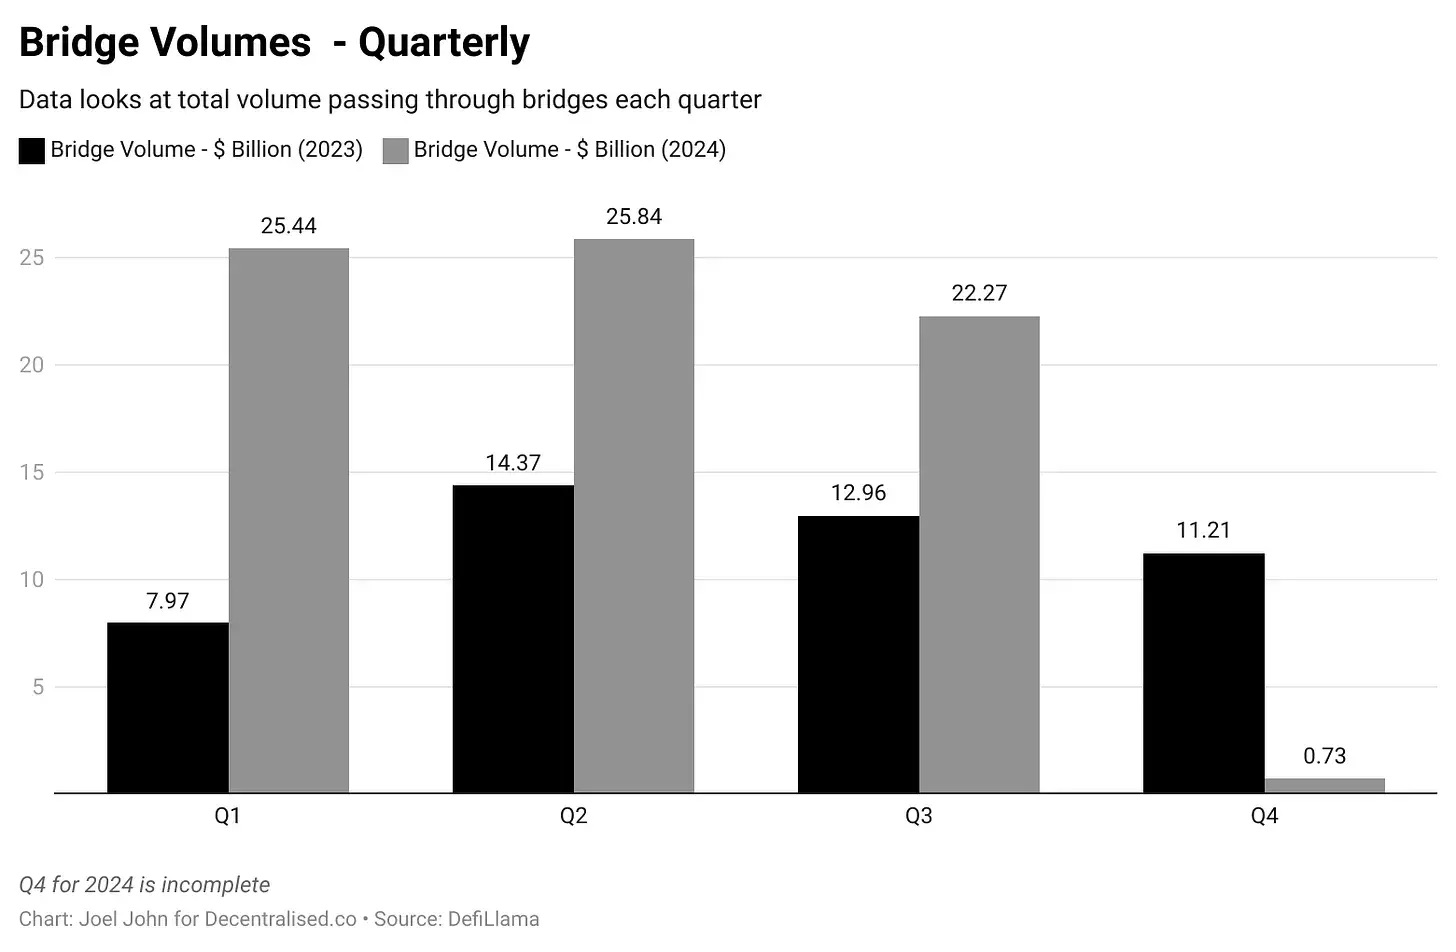
Since mid-2020, blockchain cross-chain bridges have generated nearly $104 million in cumulative fees. Usage is somewhat seasonal, driven by user surges seeking new applications or economic opportunities. Without attractive yield prospects, memecoins, or novel financial primitives, bridge usage drops significantly, as users stick to their preferred chains and protocols.
A sad (but interesting) way to measure cross-chain revenue is to compare it with memecoin platforms like Pump.fun. When Pump.fun earned $70 million in fees, cross-chain bridges collectively earned $13.8 million.
Despite rising transaction volumes, fees have remained largely flat due to ongoing price wars between blockchains. To understand how such efficiency is achieved, we need to examine how most cross-chain bridges work. A useful mental model for understanding bridges is the Hawala network from a century ago.
While today Hawala is often associated with money laundering, a century ago it was an effective method for transferring funds. For example, if you wanted to send $1,000 from Dubai to Bangalore in the 1940s, you had options.
You could go through a bank, but that might take days and require extensive documentation. Alternatively, you could visit a gold souk dealer who would take your $1,000 and instruct a merchant in India to pay an equivalent sum to your designated recipient in Bangalore. Money changed hands in both India and Dubai, but no physical currency crossed borders.
How did this work? Hawala is a trust-based system. It functioned because the gold dealer in Dubai and the Indian merchant typically maintained ongoing trade relationships. Instead of moving capital directly, they later settled balances through goods like gold. These transactions relied on mutual trust between individuals, requiring high confidence in each party’s honesty and cooperation.
What does this have to do with cross-chain? Many bridges use the same model. If you want to move capital from Ethereum to Solana for yield opportunities, cross-chain bridges like LayerZero help relay messages so users can deposit tokens on one chain and borrow on another.
Imagine these traders don’t lock assets or offer gold bars, but instead give you a redeemable code usable anywhere. This code is a form of message transmission — on LayerZero, these are called endpoints. They are smart contracts existing on different blockchains. A Solana smart contract might not understand Ethereum transactions, so oracles are needed. LayerZero uses Google Cloud as a verifier for cross-chain transactions — even at the frontier of Web3, we rely on Web2 giants to help build better economic systems.
But what if participants don't trust their ability to interpret the code? Not everyone can get Google Cloud to verify transactions. Another approach is asset locking and minting.
In this model, when you use Wormhole, your assets are locked in an Ethereum smart contract, and you receive wrapped assets on Solana. This is like depositing USD in the UAE while a hawala agent provides you with gold in India. You can take the gold, speculate with it, return it, and reclaim your original capital in Dubai.
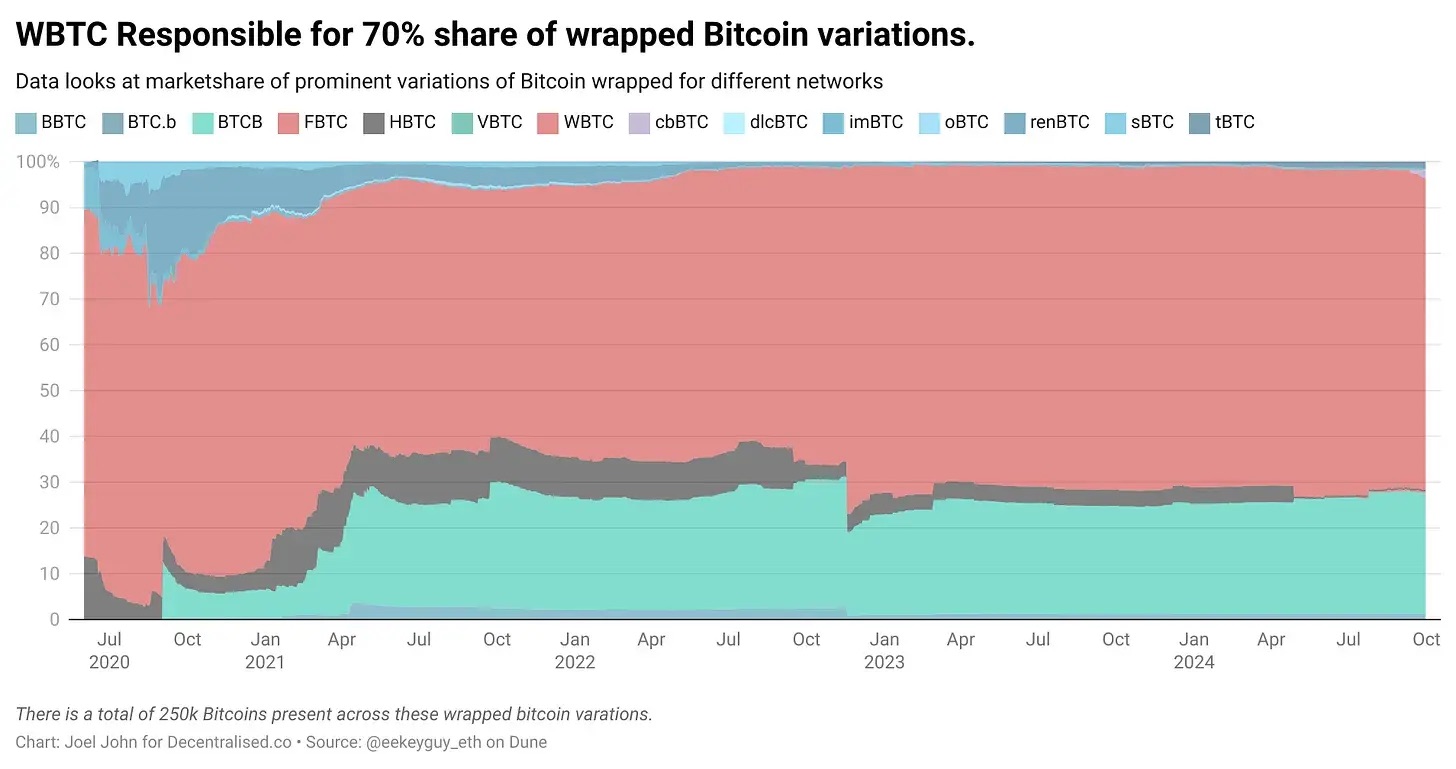
The chart below shows wrapped Bitcoin assets today. Most were minted during DeFi summer to generate yield from Bitcoin on Ethereum.
Key commercial aspects of cross-chain bridges include:
-
TVL: When users deposit funds, this capital can be used to generate yield. Today, most bridges don’t deploy idle capital into lending markets but instead charge small transaction fees when users move capital between chains.
-
Relayer Fees: Charged by third parties (like Google Cloud in LayerZero), who collect small fees per transfer to validate transactions across multiple chains.
-
Liquidity Provider (LP) Fees: Paid to individuals who deposit funds into bridge smart contracts. Suppose you’re running a hawala network and someone moves $100 million from one chain to another. You personally may not have that much capital. Liquidity providers pool funds to facilitate such trades. In return, each LP earns a share of the generated fees.
-
Minting Costs: Bridges can charge a small fee when minting assets. For example, WBTC charges 10 basis points per BTC minted.
Bridge revenues come from transaction fees and value creation via asset minting on both sides of a transfer, while expenses cover relayer maintenance and payments to liquidity providers.
The Economic Value of Cross-Chain Bridges
The following data is somewhat messy because not all fees flow back to the protocol. Sometimes fees depend on the specific protocol and assets involved. If a bridge primarily handles low-liquidity long-tail assets, users may also face slippage. Therefore, when analyzing unit economics, the figures below don’t necessarily indicate which bridge is better than another. Our goal is to understand how much value the entire supply chain generates during cross-chain events.
First, we examine 90-day transaction volume and fees generated across protocols. The data reflects metrics up to August 2024, covering the subsequent 90 days. We assume Across has higher volume due to its lower fees.
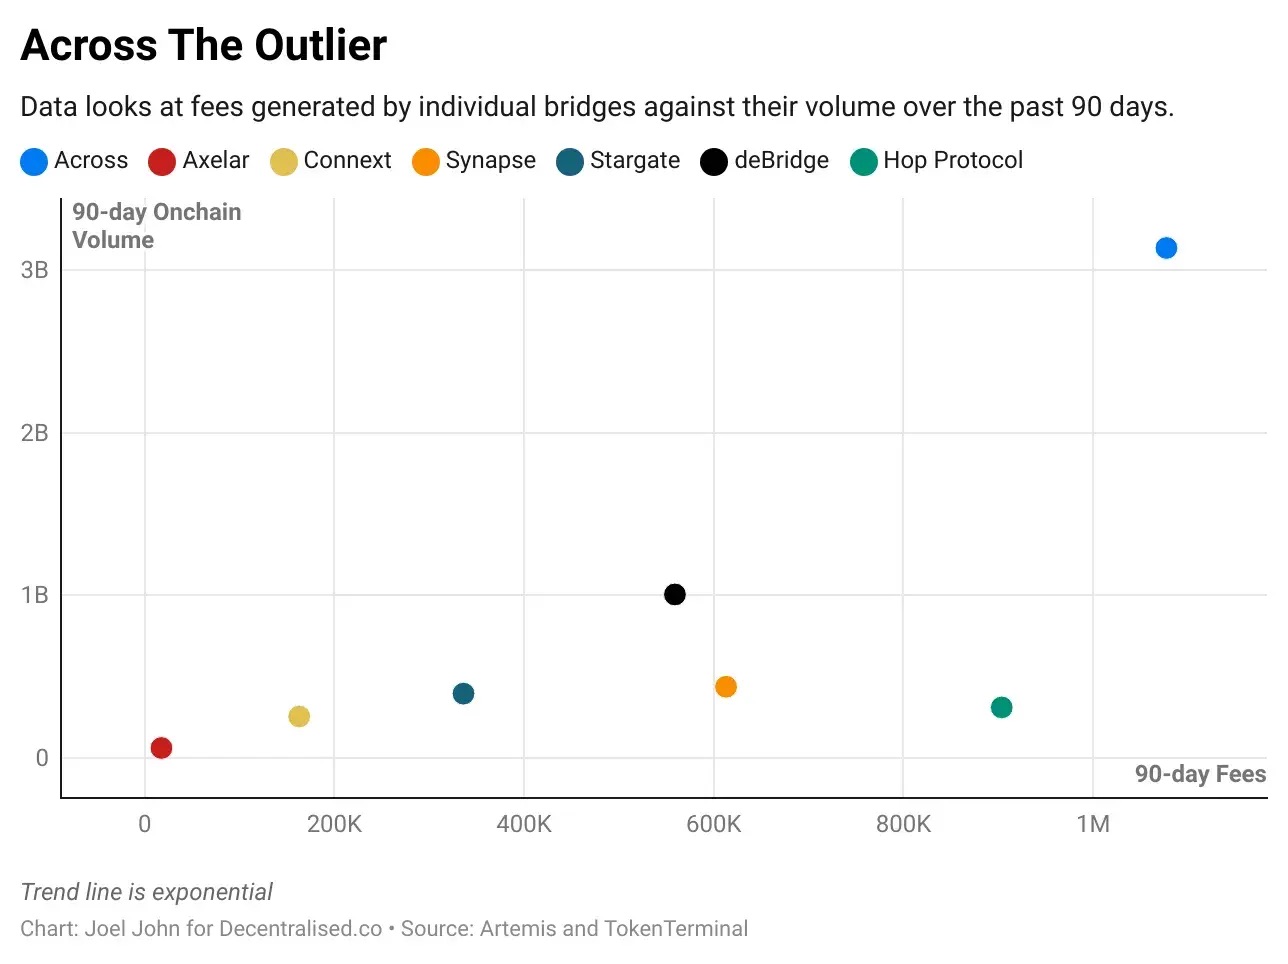
This roughly illustrates how much capital flowed through bridges in a given quarter and the types of fees generated during that period. We can use this data to calculate how much fee revenue is generated per dollar passing through a bridge. For readability, I’ve scaled the data to show fees generated per $10,000 transferred.
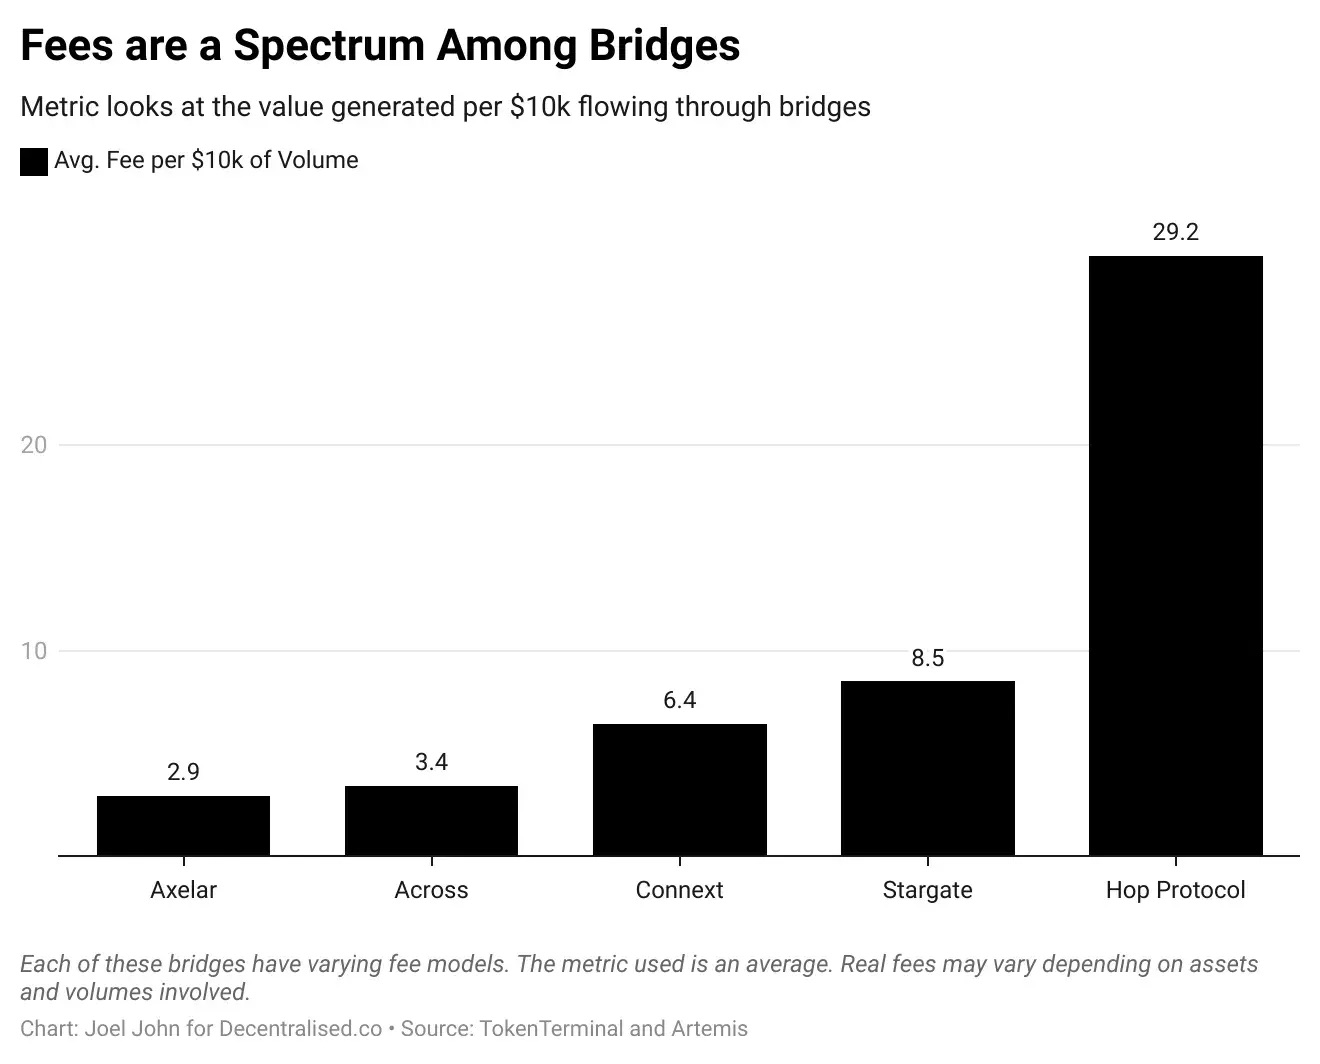
Before proceeding, let me clarify: this doesn’t mean Hop charges ten times more than Axelar. Rather, on a bridge like Hop, every $10,000 transfer creates $29.20 in value across the entire value chain (for LPs, relayers, etc.). These metrics vary because different bridges handle different types and natures of transfers.
The most interesting part for us is comparing this to the value captured by protocols and the volume of capital moving cross-chain.
As a benchmark, we look at transfer costs on Ethereum. At the time of writing, a low-gas Ethereum transfer costs about $0.0009179, while on Solana it’s around $0.0000193. Comparing bridges to L1s is like comparing routers to computers — storing files on a computer is far cheaper. But our question here is whether, from an investment standpoint, bridges capture more value than L1s.
From this perspective, referencing the above metrics, one way to compare them is to look at the dollar fees charged per transaction by various bridges versus those on Ethereum and Solana.
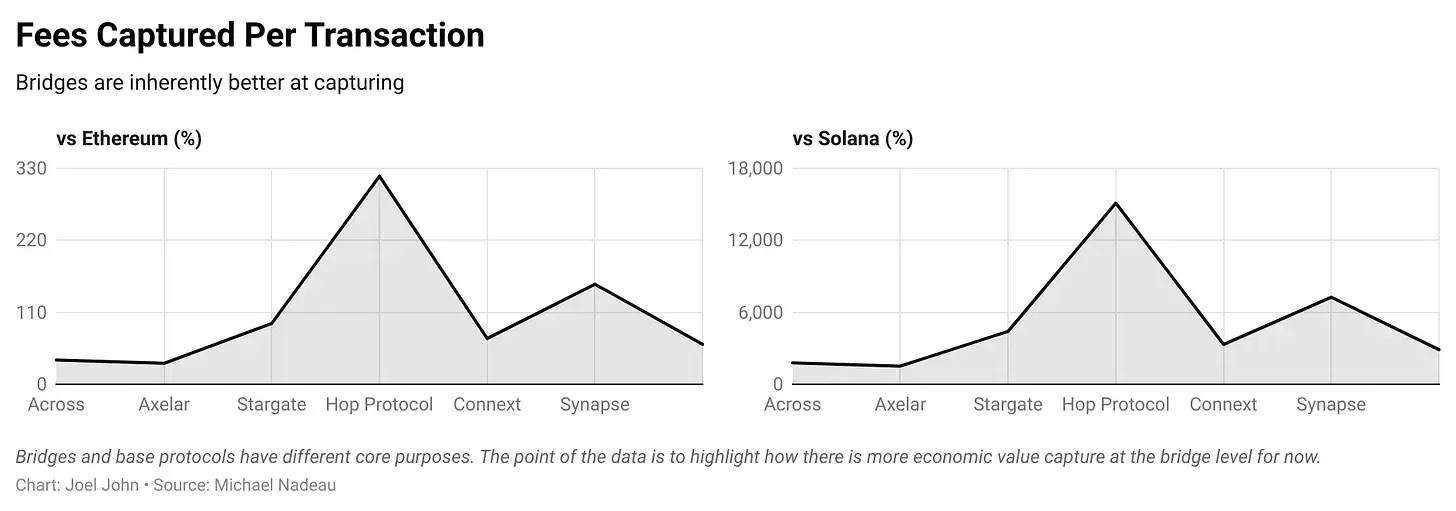
Some bridges charge less than Ethereum due to gas costs incurred when bridging from Ethereum.
One might say Hop Protocol captures 120x more value than Solana. But that misses the point — the two networks have entirely different fee models. What interests us is the difference between value capture and valuation.
Among the top seven cross-chain protocols, five charge less than Ethereum L1. Axelar is the cheapest, averaging just 32% of Ethereum’s fees over the past 90 days. Hop Protocol and Synapse are more expensive than Ethereum. Compared to Solana, we see that settlement fees on high-throughput L1s are orders of magnitude cheaper than today’s cross-chain protocols.
To further contextualize this, consider transaction costs on L2s within the EVM ecosystem. Typically, Solana fees are about 2% of Ethereum’s. For comparison, we’ll use Arbitrum and Base. Since L2s are designed for low fees, we’ll use a different metric to assess economic value — average daily fees per active user.
Over the 90 days covered in our dataset, Arbitrum averaged 581,000 users per day, generating $82,000 in daily fees. Similarly, Base had 564,000 users, generating $120,000 in daily fees.
In contrast, bridges have fewer users and lower fees. The highest is Across, where 4,400 users generated $12,000 in fees. Based on this, we estimate Across generates $2.40 in fees per user per day. This metric can then be compared to Arbitrum or Base to assess per-user economic value.
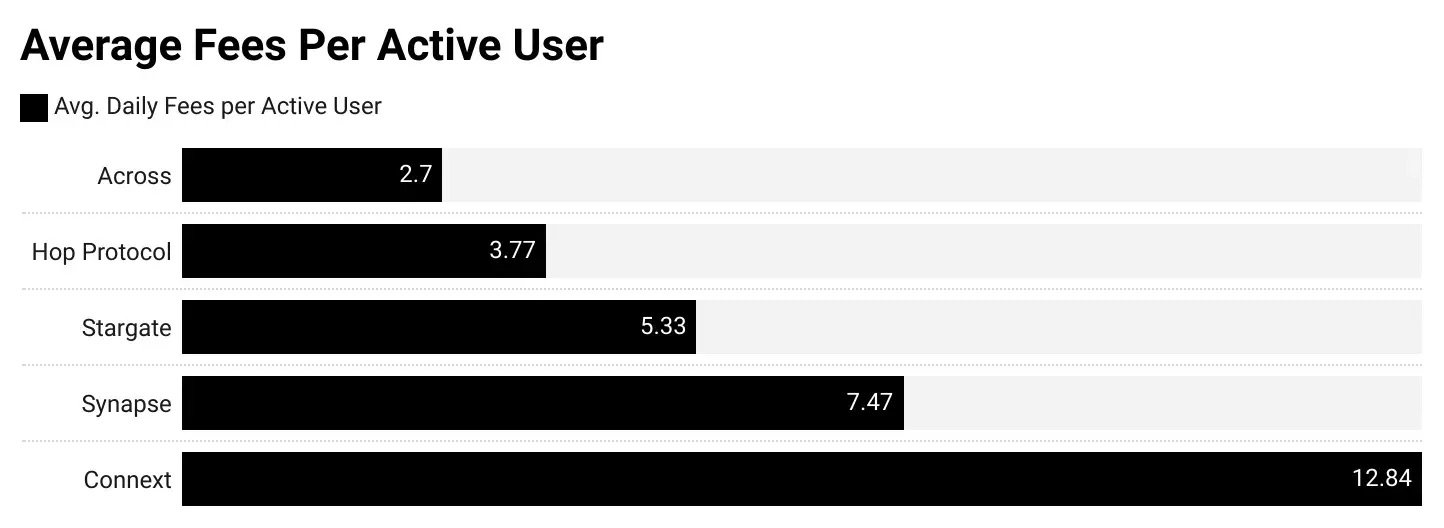
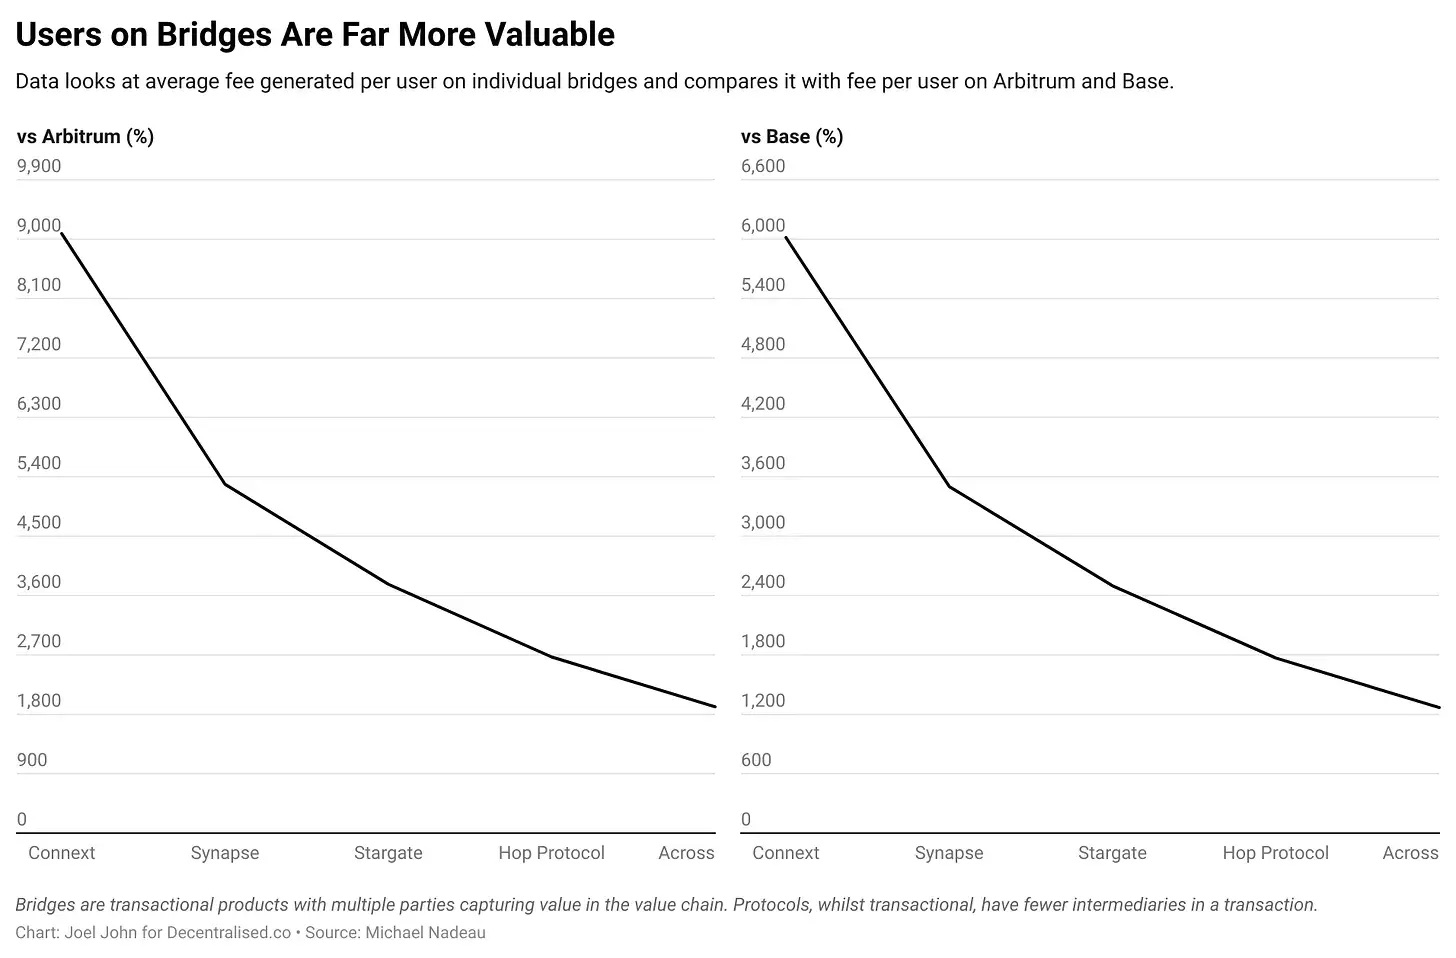
Today, the average user on a cross-chain bridge is more valuable than the average user on an L2. The average Connext user generates 90x more value than an Arbitrum user.
-
Cross-chain bridges, as monetary routers, may be one of the few product categories in crypto capable of generating meaningful economic value.
-
As long as transaction fees remain high, we may not see users shifting toward L1s like Ethereum or Bitcoin. Instead, users might directly join L2s like Base, or simply switch between low-cost networks.
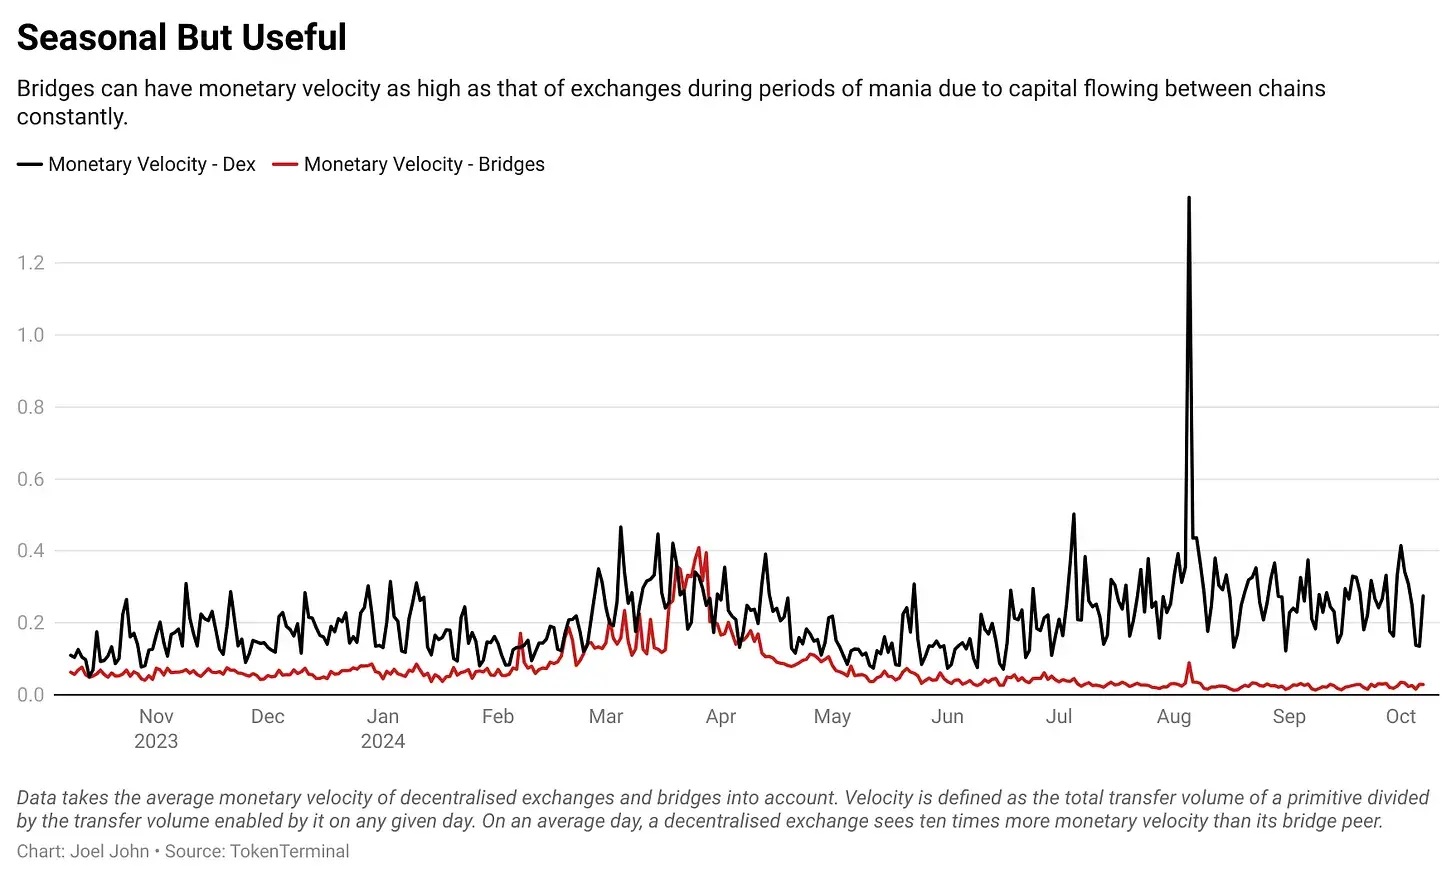
Another way to assess the economic value of cross-chain protocols is to compare them with decentralized exchanges (DEXs). Think closely — both primitives serve similar functions: enabling token transfers from one form to another. DEXs allow transfers between assets; bridges enable transfers between blockchains.
The above data applies only to DEXs on Ethereum
Here, I avoid comparing fees or revenue directly. Instead, I focus on capital velocity — defined as how many times capital circulates between the smart contracts owned by a bridge or DEX. To calculate this, I divide the daily transfer volume by the TVL of the bridge or DEX.
As expected, DEXs have much higher velocity, since users trade assets back and forth multiple times in a single day.
However, interestingly, when excluding large L2-native bridges (like those of Arbitrum or Optimism), the velocity gap between bridges and DEXs narrows considerably.
Perhaps in the future, we'll see bridges that limit capital capacity and instead focus on maximizing returns by increasing capital velocity. That is, if a bridge can move capital multiple times within a day, it can generate higher yields.
Are Cross-Chain Bridges Routers?
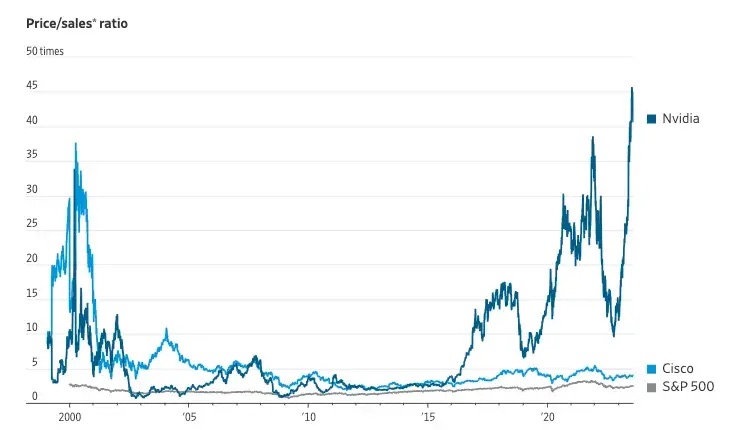
Source: Wall Street Journal
If you think venture capital rushing into "infrastructure" is a new phenomenon, let’s revisit the past. Back in the 2000s, when I was a boy, many in Silicon Valley praised Cisco. The logic then was simple: if traffic through internet channels increases, routers will capture a significant portion of that value. Much like NVIDIA today, Cisco was a premium stock because it built the physical infrastructure underpinning the internet.
Cisco’s stock peaked at $80 on March 24, 2000. At the time of writing, it trades at $52 — never recovering its former glory. Writing this during a memecoin frenzy makes me wonder how much value cross-chain protocols can truly capture. They exhibit network effects, but it may be a winner-takes-all market. The space is increasingly leaning toward intent-based solutions, with centralized market makers executing orders in the backend.
In the end, most users don’t care about the decentralization level of the bridge they use — they care about cost and speed.
Cross-chain bridges have matured to a certain extent, with multiple approaches emerging to solve the age-old problem of moving assets across chains. The main driver of change is chain abstraction — a mechanism for transferring assets across chains where users are completely unaware that a transfer ever occurred.
Another factor driving volume growth is innovation in product distribution or positioning. Last night, while exploring memecoins, I noticed IntentX using intent to bring Binance’s perpetual futures market onto a decentralized exchange product. We’re also seeing chain-specific bridges evolve to strengthen product competitiveness.
No matter the approach, one thing is clear: like DEXs, cross-chain bridges are hubs through which massive monetary value flows. As a primitive, they will persist and continue evolving. We believe niche-specific bridges (like IntentX) or user-centric bridges (enabled by chain abstraction) will become the primary drivers of industry growth.
Shlok added a subtle point during our discussion: traditional routers never captured economic value based on data volume. Whether you download TBs or GBs, Cisco earns the same. In contrast, cross-chain bridges earn based on transaction volume. Therefore, their fate may differ.
For now, it’s safe to say that the current state of cross-chain bridges mirrors the physical data routing infrastructure of the internet.
Join TechFlow official community to stay tuned
Telegram:https://t.me/TechFlowDaily
X (Twitter):https://x.com/TechFlowPost
X (Twitter) EN:https://x.com/BlockFlow_News