

Cycle Trading: Changes in Asset Prices Across the Board After Rate Cuts Take Effect
TechFlow Selected TechFlow Selected
Cycle Trading: Changes in Asset Prices Across the Board After Rate Cuts Take Effect
During the 2019 rate-cutting cycle, BTC experienced a brief price surge after the first rate cut, then generally entered a downward channel. The entire pullback lasted 175 days from the peak, with a correction幅度 of approximately 50%.

1. A New Easing Cycle Begins After Four Years
At 2:00 a.m. Beijing time on September 19, the Federal Reserve announced a 50-basis-point rate cut, lowering the target range for the federal funds rate from 5.25%–5.50% to 4.75%–5.0%. The new easing cycle has officially begun. This 50-bp cut aligns with expectations priced into CME interest rate futures but exceeds forecasts from many Wall Street investment banks. Historically, initial 50-bp cuts have occurred only during periods of economic or market emergencies—such as the tech bubble in January 2001, the financial crisis in September 2007, and the COVID-19 pandemic in March 2020. Since a 50-bp cut tends to amplify market concerns about an economic "recession," Chair Powell emphasized during his speech that there are no signs of recession, using this standard approach to counterbalance such fears.
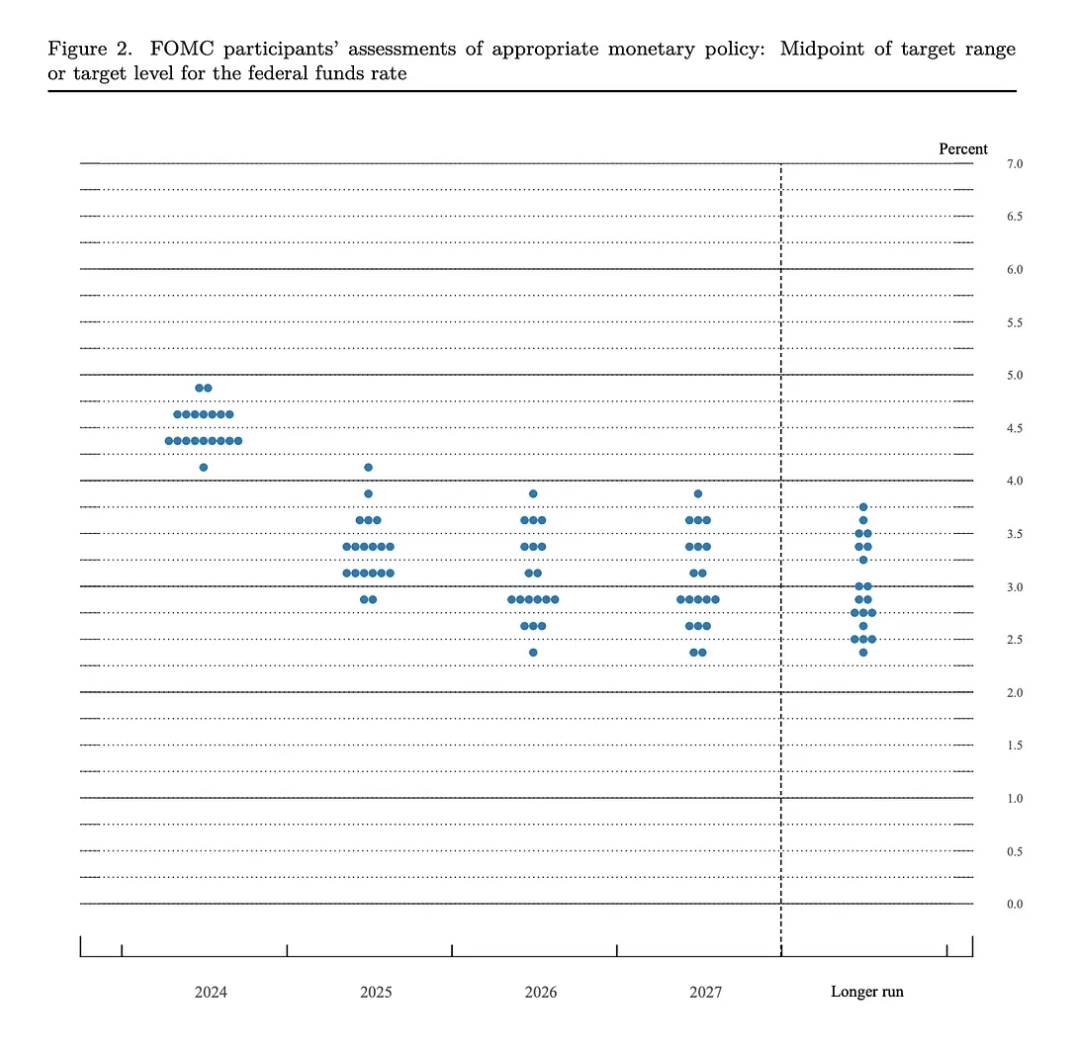
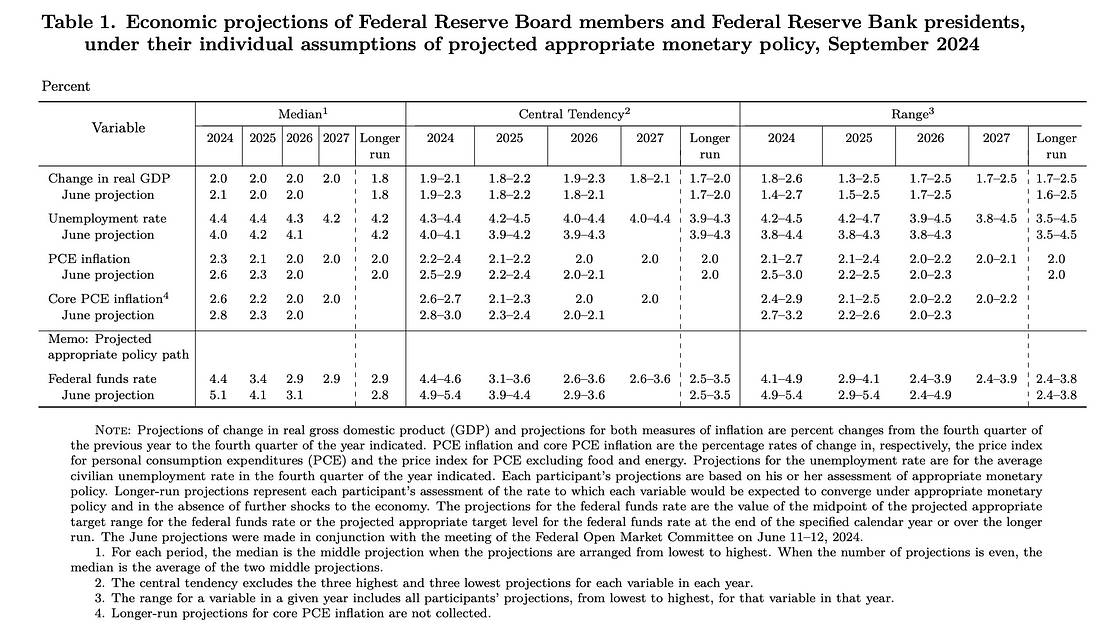
The Fed also released a relatively hawkish dot plot, projecting two additional 25-bp cuts this year (totaling 50 bp), four cuts in 2025 (100 bp), and two cuts in 2026 (50 bp). This implies a total easing of 250 bp, with the terminal rate landing at 2.75%–3.0%. However, the projected pace is gradual, slower than what CME rate futures had priced in—markets previously expected rates to reach 2.75%–3.0% by September 2025. Powell stressed that this 50-bp cut should not be taken as a baseline for linear extrapolation. There is no preset path—the pace could accelerate, slow down, or even pause depending on data at each meeting. This一定程度 explains the sharp rise in U.S. Treasury yields after the announcement.
In its economic outlook, the Fed revised its GDP growth forecast for this year down from 2.1% to 2.0%, significantly raised the unemployment rate projection from 4.0% to 4.4%, and lowered its PCE inflation forecast from 2.6% to 2.3%. The revisions reflect growing confidence in inflation control while signaling increased concern over labor market weakness. Overall, the combination of a large initial cut and a cautious forward guidance shows the Fed once again skillfully managing market expectations.
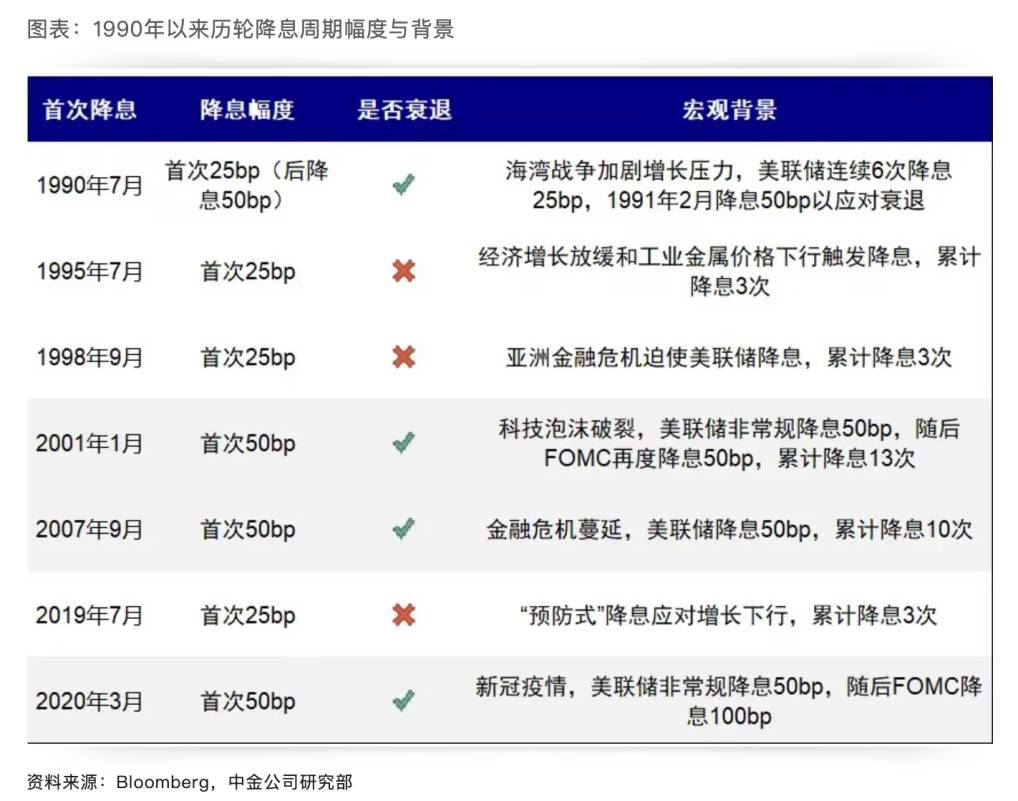
2. Rate Cut Cycles Since the 1990s
June 1989 – September 1992 (Recession-Driven Easing)
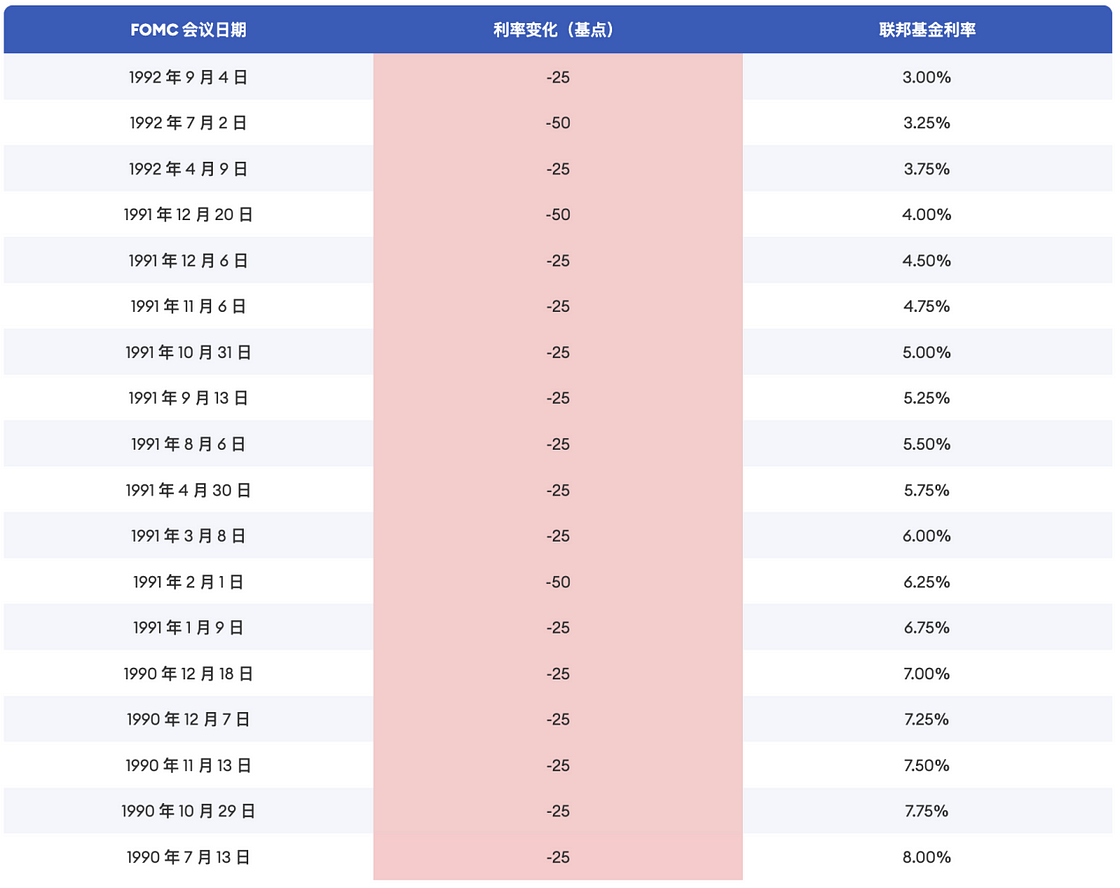
In the late 1980s, rapid U.S. interest rate hikes caused savings and loan institutions to face a mismatch where short-term deposit rates exceeded long-term fixed mortgage rates, leading to yield curve inversion. The U.S. financial sector experienced the "Savings and Loan Crisis," resulting in widespread bank failures. Combined with the external shock of the Gulf War, the U.S. economy entered a recession as defined by the National Bureau of Economic Research (NBER) from August 1990 to March 1991, lasting eight months. The Fed began a more than three-year easing cycle in June 1989, cutting rates cumulatively by 681.25 bps, bringing the policy rate ceiling from 9.8125% down to 3%.
July 1995 – January 1996 (Preemptive Easing)
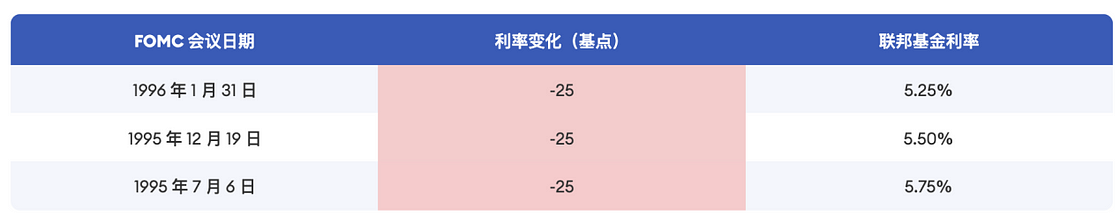
In 1995, U.S. economic growth slowed and labor market conditions weakened. Although the economy was not yet in recession, declining indicators suggested rising downside risks. To prevent a downturn, the Fed initiated easing. This cycle lasted seven months, with three cuts totaling 75 bps, reducing the policy rate ceiling from 6% to 5.25%. The U.S. economy achieved a "soft landing," with improvements in employment and manufacturing PMI. This cycle is considered a textbook example of successful preemptive monetary policy. Additionally, the Fed managed to keep inflation contained—the PCE inflation rate remained below 2.3% throughout the easing period, showing remarkable stability.
September – November 1998 (Preemptive Easing)

The Asian Financial Crisis erupted in the second half of 1997, weakening external demand and affecting U.S. trade. While the overall U.S. economy remained stable, turmoil abroad pressured the manufacturing sector, and U.S. equities corrected. From July to August 1998, the S&P 500 entered a nearly two-month correction, falling almost 20% at its worst. The giant hedge fund Long-Term Capital Management (LTCM) faced collapse. To prevent spillover effects, the Fed began cutting rates in September 1998, implementing three cuts totaling 75 bps by November, lowering the policy rate ceiling from 5.5% to 4.75%.
January 2001 – June 2003 (Recession-Driven Easing)

In the late 1990s, rapid development and adoption of internet technology led to excessive speculation and irrational exuberance, channeling massive capital into internet startups. From October 1999 to March 2000, the Nasdaq Composite surged 88% in five months. To cool the overheating economy, the Fed raised rates six times between June 1999 and May 2000, totaling 275 bps. In March 2000, the Nasdaq peaked and plunged rapidly, bursting the dot-com bubble. Numerous internet companies collapsed, dragging the economy into recession. On January 3, 2001, the Fed cut rates by 50 bps and went on to cut 13 times, cumulatively 550 bps, bringing the policy rate ceiling from 6.5% down to 1.0%.
September 2007 – December 2008 (Recession-Driven Easing)

In 2007, the U.S. subprime mortgage crisis spread to bond and equity markets, causing a sharp deterioration in economic conditions. On September 18, the Fed cut the federal funds rate by 50 bps to 4.75%, followed by ten consecutive cuts. By the end of 2008, rates had fallen 550 bps to 0.25%. With conventional easing insufficient, the Fed introduced quantitative easing (QE) for the first time, purchasing large quantities of Treasuries and mortgage-backed securities to lower long-term rates, stimulate the economy, and inject liquidity into markets.
August – October 2019 (Preemptive Easing)

In 2019, the U.S. economy and labor market remained solid overall. However, geopolitical tensions and U.S.-China trade friction weakened external demand, while domestic demand also showed signs of slowing. Inflation stayed below 2%. The PCE inflation rate held between 1.4% and 1.6% in the first half of 2019, while core PCE dipped from 1.9% at the start of the year to 1.6% in March–May.
On July 31, 2019, the Fed cut rates by 25 bps to 2.25%, citing moderate growth and a strong job market but noting inflation remained persistently below target. The move aimed to guard against economic slowdown amid global trade tensions and slowing world growth. Before the global pandemic hit in 2020, the U.S. economy remained stable, with rebounds in manufacturing PMI and core PCE. Between August and October 2019, the Fed cut rates three times, totaling 75 bps, lowering the policy rate ceiling from 2.5% to 1.75%.
March 2020 (Recession-Driven Easing)

In early 2020, the coronavirus pandemic spread globally. In two emergency unscheduled meetings in March, the FOMC slashed rates dramatically, returning the federal funds rate target range to 0%–0.25%.
3. Asset Price Performance During Rate Cut Cycles


Asset price movements following rate cuts largely depend on whether the macro environment is in recession. Current U.S. economic data do not support a recession call. Assuming a soft landing, the most relevant historical comparisons are the recent preemptive easing cycles of 2019–2020.
U.S. Treasuries
Treasuries generally trend upward around rate cuts, with stronger and more certain gains before the cuts begin. In the 1, 3, and 6 months preceding a cut, average price increase frequency is 100%; afterward, it declines. Average gains one, three, and six months before a cut are 13.7%, 22%, and 20.2%, respectively, versus 12.2%, 7.1%, and 4.6% after. This clearly reflects market anticipation—prices “price in” the cuts ahead of time. Volatility increases around the actual initiation of easing. In later stages, divergent economic recoveries lead to varied interest rate trajectories across cycles.

Gold
Similar to Treasuries, gold tends to see higher probability and magnitude of gains before rate cuts. Benefiting from safe-haven demand during crises, gold’s performance shows less clear correlation with "soft landing" outcomes. From a trading perspective, the optimal window for holding gold—as a denominator asset—is before rate cuts begin. Once cuts are priced in and delivered, investors may shift focus to numerator-driven assets that benefit from lower rates.
Prior to the 21st century, gold’s correlation with rate cuts was unclear. In 2004, the SEC approved the first exchange-traded gold fund (ETF), which dramatically boosted investment demand, attracting both retail and institutional investors. Sustained inflows provided strong momentum for gold prices. This bull run lasted until 2011, spanning seven years—including through the Fed’s 2004–2006 tightening cycle and 2007–2008 easing—and gold maintained an overall upward trajectory. Excluding the ETF effect, the only meaningful recent comparison is the 2019 cycle. In the short term, gold rose sharply after the first cut in August 2019, then consolidated over the next two months. Over a longer horizon, however, gold continued its upward trend post-cut.

Fed Rate Cycles and Gold Prices

Nasdaq Index
The Nasdaq's performance during recession-driven easing depends on the pace of fundamental recovery. In such cycles, the index mostly falls—except for the unusually long 1989–1992 easing, when it rose 28%. It declined 38.8% in 2001, 40% in 2007, and 20.5% in 2020. During preemptive easing, short-term reactions vary by cycle, but the long-term trend is consistently positive. Intuitively, preemptive cuts often succeed in reversing economic weakness and supporting equity markets. Therefore, the key determinant for Nasdaq’s direction is whether a recession occurs. In the 2019 cycle, the index pulled back after the first and second cuts, traded sideways for three months, then began a sustained rally around the time of the third cut.


BTC
During the 2019 easing cycle, BTC briefly rallied after the first cut, then entered a downtrend. From peak to trough, the drawdown lasted 175 days with a decline of about 50% (excluding later pandemic impacts). This time, BTC’s correction started earlier due to fluctuating rate cut expectations. After peaking in March this year, BTC has already undergone a 189-day consolidation with a maximum drawdown of approximately 33%. Based on historical patterns, the long-term outlook remains bullish. Short-term volatility or pullbacks are possible, but the depth and duration of any correction are likely to be smaller and shorter than in 2019.

Join TechFlow official community to stay tuned
Telegram:https://t.me/TechFlowDaily
X (Twitter):https://x.com/TechFlowPost
X (Twitter) EN:https://x.com/BlockFlow_News


