Deep Dive: The Revenue Sustainability of Three Major Public Blockchains — Ethereum, Solana, and Tron
TechFlow Selected TechFlow Selected
Deep Dive: The Revenue Sustainability of Three Major Public Blockchains — Ethereum, Solana, and Tron
This report will provide an in-depth analysis of the revenue composition of Ethereum, Solana, and Tron, exploring their long-term development potential and revenue sustainability.
Author: Frontier Lab
Introduction
In today's rapidly evolving blockchain landscape, the revenue sustainability of public blockchains has become a key metric for assessing their long-term development potential. This report focuses on three major mainstream public chains—Ethereum, Solana, and Tron—analyzing their gas fee revenues, on-chain economic activities, and user-driven income sustainability to explore the structure and viability of their revenue models.
According to the latest data from DefiLlama, over the past 30 days Ethereum led significantly with $99.89 million in gas fees, followed by Solana at $46.21 million and Tron at $38.97 million. However, this revenue advantage does not fully align with market热度 or user activity levels. Notably, Solana has surpassed Ethereum in discussion热度 over the past six months, while Tron has gained widespread recognition in the payments sector due to its low transaction costs.
More strikingly, daily active address data reveals a completely different picture compared to gas fee income: Tron leads with 2.1 million daily active addresses, followed by Solana at 1.1 million, while Ethereum records only 316,000. This divergence highlights the complex relationship between gas fee composition, on-chain economic activity, and user-driven income sustainability, offering a unique lens through which to evaluate the revenue sustainability of these three leading blockchains.
This report provides an in-depth analysis of the revenue structures of Ethereum, Solana, and Tron, exploring their long-term growth potential and financial sustainability.
Ethereum
Gas Fee Revenue Composition
Ethereum has undergone a series of major upgrades, including the transition from Proof-of-Work (PoW) to Proof-of-Stake (PoS) and the implementation of EIP-1559, profoundly impacting its gas fee structure. The new model divides gas fees into two components: the base fee, which is automatically burned by the system, and tips, which are paid directly to validators. The base fee burning mechanism aims to push ETH into a deflationary state, potentially enhancing its value. Meanwhile, dynamically adjusted base fees help optimize network resource allocation, while tips provide additional incentives for validators, reinforcing network security. This dual structure diversifies validator income, reduces reliance on new coin issuance, and creates long-term deflationary pressure on ETH via fee burning. Collectively, these changes aim to strengthen Ethereum’s economic sustainability and long-term value proposition.
In the past 30 days, approximately $47 million worth of ETH has been burned via the base fee mechanism—an indicator of network activity and a critical basis for analyzing the contribution of various on-chain activities to total gas consumption. The primary contributors to this burn are illustrated below.
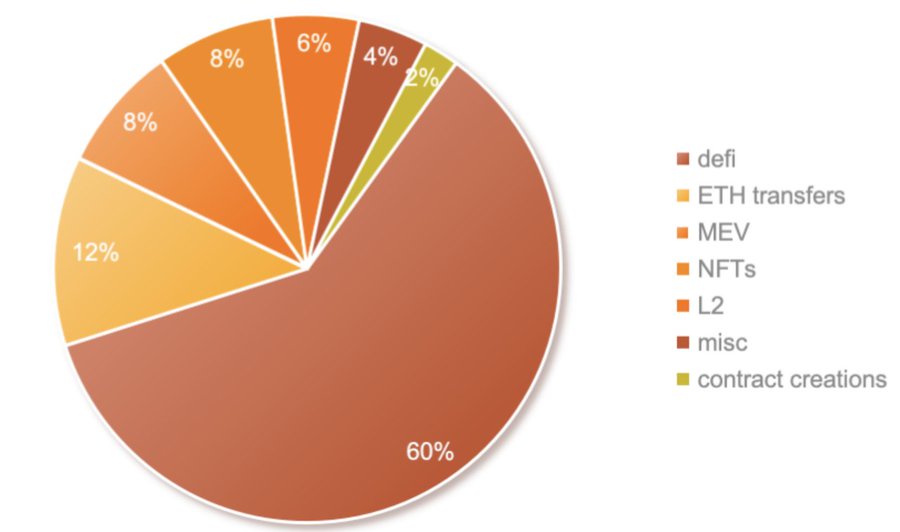
Figure 1-1 Ethereum Ecosystem Burn Statistics
The distribution of gas fee consumption on Ethereum reflects the vitality and economic value flow within its ecosystem. As shown in the chart, decentralized finance (DeFi) dominates with a 60% share, underscoring its central role in the Ethereum ecosystem. This is followed by ETH transfers (12%), MEV (Maximum Extractable Value, 8%), and NFTs (Non-Fungible Tokens, 8%). Together, these four categories account for 88% of total gas consumption, forming the core of Ethereum’s on-chain economic activity. Layer 2 solutions (6%) and smart contract creation (2%) represent smaller shares, suggesting the ecosystem may currently be in a relative "trough phase."
Despite this apparent lull, Ethereum’s gas consumption remains diversified, led by DeFi but supported by ETH transfers, MEV, and NFTs, demonstrating sustained vitality and broad application scenarios that lay a solid foundation for future value growth.
On-Chain Economic Activity
DeFi
Decentralized Finance (DeFi) is a core component of the Ethereum ecosystem, encompassing diverse sub-sectors such as decentralized exchanges (DEXs), lending platforms, DEX trading bots, stablecoins, derivatives, crypto wallets, and liquid staking derivatives (LSDs).
Detailed analysis of Ethereum’s gas burn data shows that sectors like DEXs, stablecoins, DEX trading bots, and crypto wallets stand out in gas consumption, occupying top positions—reflecting their dominance and high user engagement within the current DeFi landscape.
Uniswap (DEX)
As the largest decentralized exchange (DEX) in the Ethereum ecosystem, Uniswap not only provides efficient on-chain spot trading services but also serves as foundational infrastructure for the broader DeFi ecosystem, meeting essential demand across blockchain networks.
Uniswap generated $54.23 million in revenue over the past 30 days, with $8.15 million contributed to gas fee burns, accounting for approximately 17.3% of the Ethereum ecosystem. Data (Figure 1-2) indicates that the most traded pairs on Uniswap are primarily ETH-stablecoin combinations, with speculative meme coin trades representing a negligible portion—highlighting a healthy, fundamentals-driven trading environment.
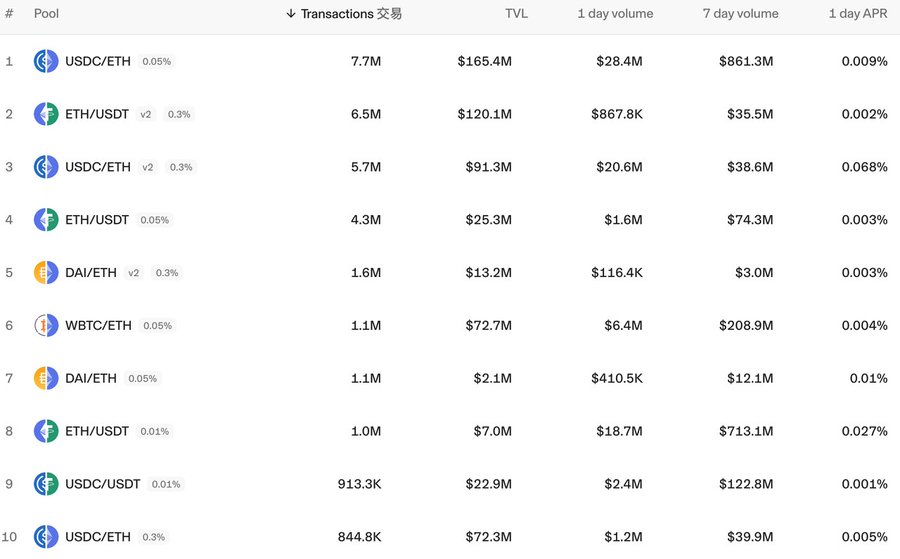
Figure 1-2 Top Trading Pairs on Uniswap
1inch (DEX)
1inch, a leading DEX aggregator on Ethereum, enhances user experience by consolidating liquidity pools across multiple DEXs to offer optimal trade routes and prices, particularly excelling in trades involving less popular tokens.
1inch contributed approximately $1.21 million in gas fees on Ethereum, representing about 3% of the total.
The DEX sector accounts for over 40% of DeFi activity and more than 25% of the entire Ethereum ecosystem, highlighting its status as the most active segment. Leading DEX projects focus on regular trading, rarely involving meme coins, reflecting a healthy ecosystem composition. Despite being the largest contributor, the DEX sector holds just 25% of Ethereum’s total gas usage, indicating a balanced fee distribution.
Stablecoin Transfers
Stablecoin transfers serve as a key indicator of chain vitality, ranking second after DEX activity on Ethereum. Functioning similarly to fiat currency on-chain, stablecoins provide pricing benchmarks for other tokens and, due to their ease of use and low slippage, have become the preferred intermediary in token swaps—dominated by industry-standard USDT and USDC. These metrics effectively reflect capital demand and activity levels within the Ethereum ecosystem.
In the past month, gas fees burned from stablecoin-related transactions on Ethereum reached $4.01 million, about 8.5% of total gas burned during the same period. This figure not only signals strong on-chain capital demand but also underscores the importance of stablecoin transfers in evaluating a public chain’s long-term potential, as they correlate directly with sufficient capital and user base. Ethereum’s strong performance here reaffirms its leadership and momentum in the broader cryptocurrency ecosystem.
Dex Trading Bot
The rise of Dex Trading Bots stems from the popularity of meme coins. Designed as automated tools for DEX traders, they enable users to quickly purchase newly launched meme coins. With the surge in meme coin projects—many exhibiting extreme volatility and lifespans under ten minutes—timing becomes critical; even a few seconds can determine profitability. As a result, traders widely adopt bots to gain early access, generating significant gas fees and often including high bribe fees aimed at incentivizing validators to prioritize their transactions for competitive advantage.
Figure 1-3 shows that Dex Trading Bot projects (primarily Banana Gun and Maestro) rank third in gas fee contributions, behind only Uniswap and ETH/stablecoin transfers.
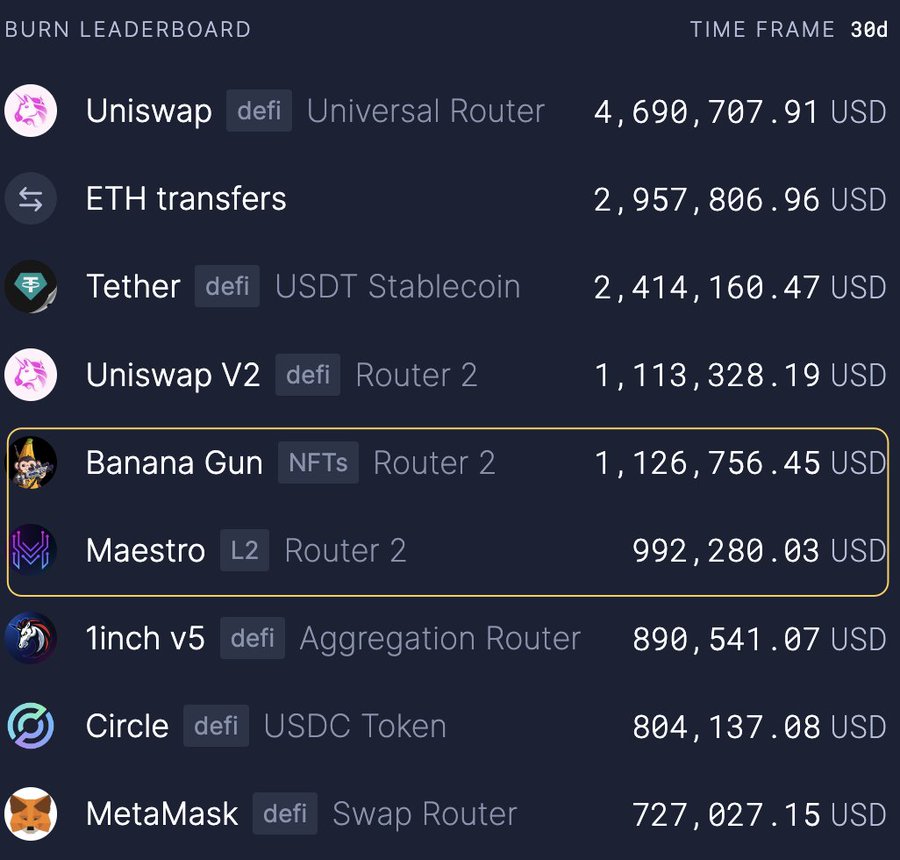
Figure 1-3 Top Contributors to Base Fee Burns on Ethereum (30-Day)
Banana Gun, a cross-chain compatible Dex Trading Bot, is primarily active on Ethereum and contributed $1.73 million in gas fees over the past 30 days—topping all such projects and representing 3.68% of the entire Ethereum ecosystem, demonstrating its dominance in automated trading tools.
Maestro, another multi-chain compatible bot focused on Ethereum, generated $1.51 million in gas fees over the same period, ranking second among Dex Trading Bot projects and capturing 3.21% of Ethereum’s total gas fees, highlighting its significant influence in the automated trading space.
The notable presence of the Dex Trading Bot sector on Ethereum (ranking third in gas contribution at ~6.9%) underscores its relevance. The clear market concentration (Banana Gun and Maestro together hold over 90% share) not only reflects the sector’s maturity but also indirectly suggests a reasonable level of meme coin trading activity—balancing user demand without allowing excessive speculation to disrupt core ecosystem functions, thereby supporting the overall health of Ethereum’s ecosystem.
Crypto Wallets
Wallets, as foundational infrastructure for user activity on public chains, serve as both indicators of real user engagement and key barometers of ecosystem health. Data (Figure 1-4) shows MetaMask—the most widely used on-chain wallet project—leads on Ethereum, contributing $2.91 million in gas fees (with $940,000 burned) over the past 30 days, representing about 2% of Ethereum’s total gas fees, emphasizing the strategic importance of the wallet sector.
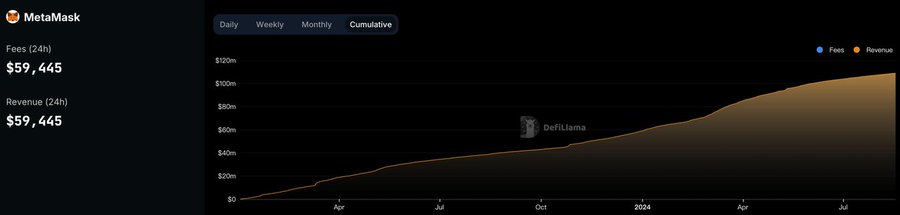
Figure 1-4 MetaMask Gas Fee Contribution
On-Chain Transfers
Ethereum on-chain transfers, the second most common on-chain activity, burned $3.83 million in gas fees last month, with estimated total gas contribution around $25.5 million, accounting for roughly 12% of Ethereum’s ecosystem. This highlights their significance and robust user demand.
MEV
MEV (Maximum Extractable Value), a phenomenon inherent to blockchain transaction processing, manifests on Ethereum as extra fees users pay to accelerate transaction execution. Post-EIP-1559, base fees are burned while tips go directly to validators. Excessive MEV demand often signals unhealthy ecosystem dynamics—particularly in meme coin markets, where time sensitivity drives users to increase MEV payments for priority. Thus, MEV volume can indirectly reflect the intensity of meme coin activity. On Ethereum, MEV-related burns totaled approximately $3.76 million, or 8% of total burns, indicating that meme coin participation does not dominate the ecosystem.
Ethereum Ecosystem Summary
The Ethereum ecosystem displays diversified yet concentrated development. DeFi leads with 60% of gas fees, confirming its centrality, while internal sub-sector distribution remains balanced. ETH transfers (12%), MEV (8%), and NFTs (8%) follow closely, with these four categories collectively accounting for 88% of total gas consumption. The top gas-consuming subcategories are DEX (26%), on-chain and stablecoin transfers (17%), Dex Trading Bots (7%), and wallets (3%), totaling 53%. Layer 2 solutions (6%) and smart contract creation (2%) remain minor, suggesting possible “trough” conditions. Nevertheless, the dispersed gas distribution reflects relatively balanced growth across sectors, avoiding dangerous over-concentration and demonstrating overall ecosystem health.
Solana
Transaction Fee Structure
Solana’s on-chain fees and costs consist of three components:
-
Transaction Fees – Paid for validator processing of transactions/instructions
-
Priority Fees – Optional fees to boost transaction ordering
-
Rent – Reserved balance to maintain on-chain data storage
Solana mandates that a fixed percentage (initially 50%) of each transaction fee be burned, with the remaining 50% going to validators. Over the past 30 days, Solana stakers received $23.1 million in transaction fee rewards.
The explosive growth of meme coin projects on Solana has created extremely time-sensitive trading conditions, prompting users to significantly raise priority fees to gain an edge—substantially increasing validators’ income from transaction and bribe fees.
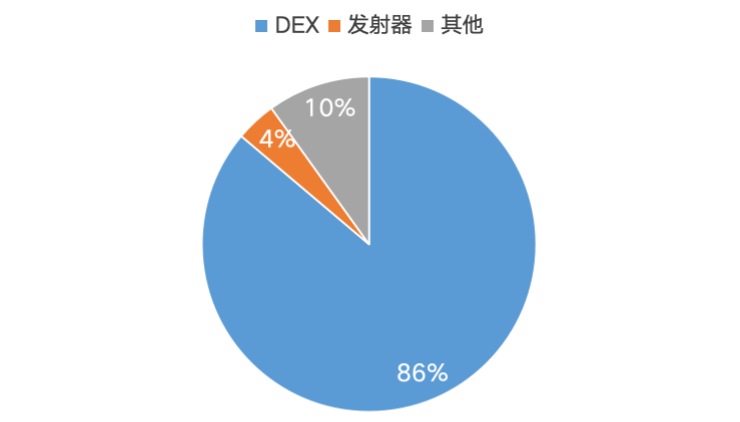
Figure 2-1 On-Chain Interaction Volume Share Across Sectors on Solana (30-Day)
Interaction volume on Solana directly reflects the frequency of on-chain transactions, closely tied to fee revenue. From Figure 2-1, we observe the following activity distribution:
-
DEX (Decentralized Exchange) activity dominates with 86%
-
Launchpads (likely referring to token launches or specific functions): 4%
-
All other activities: 10%
DEX activity plays a central role in the Solana ecosystem.
On-Chain Economic Activity
DEX
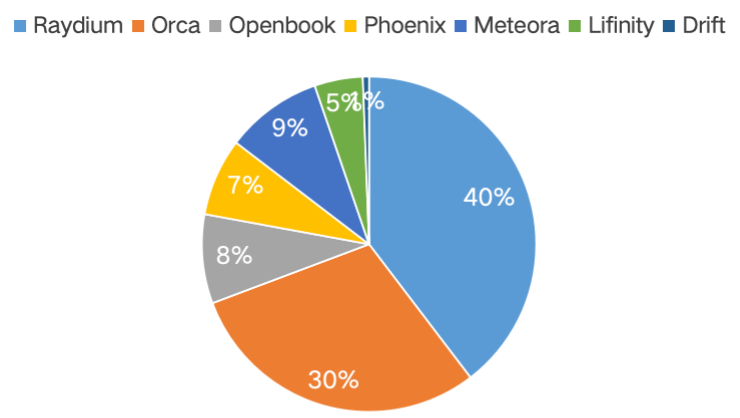
Figure 2-2 DEX Interaction Volume Share on Solana
Data from Figure 2-2 shows Raydium and Orca together capture 70%, making them the primary hubs of activity on Solana.
Raydium, the largest DEX on Solana, generated $52.37 million in transaction fees over the past 30 days. Figure 2-3 shows its revenue is primarily driven by meme coin trading pairs, highlighting the dominant role of speculative meme coin trading in Solana’s current DeFi market and its substantial contribution to platform revenue.
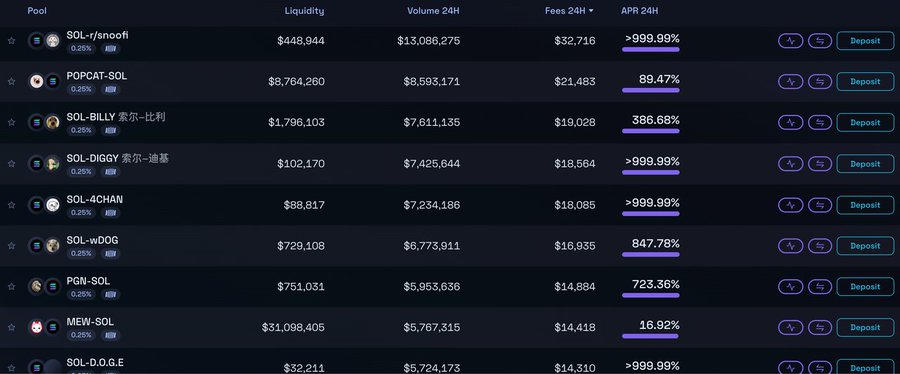
Figure 2-3 Top Revenue-Generating Trading Pairs on Raydium
Orca, Solana’s second-largest DEX, generated $12.25 million in transaction fees over the past 30 days, with over 50% of its revenue coming from meme coin pairs—reflecting the continued influence and significant revenue contribution of speculative meme coin trading in Solana’s DeFi market.
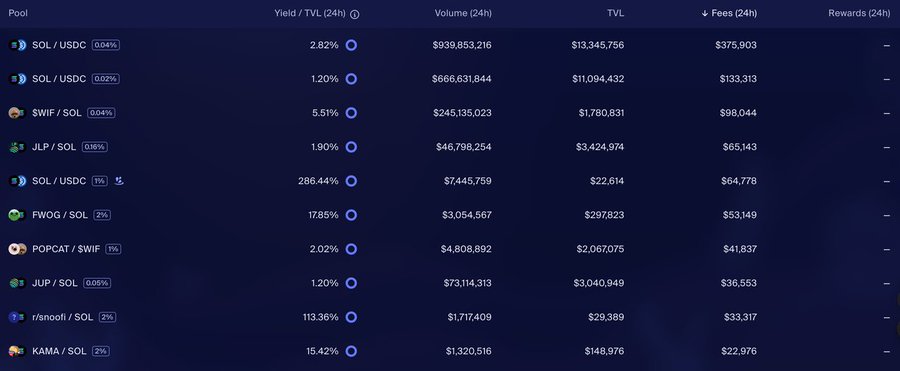
Figure 2-4 Top Revenue-Generating Trading Pairs on Orca
Recent data indicates DEX activity accounts for 86% of on-chain interactions on Solana, with estimated fee share exceeding 80%. Raydium and Orca together control 70% of the DEX market. Notably, meme coin trading contributes over 90% of Raydium’s revenue and over 60% on Orca, implying meme coin trades contribute more than 55% of total gas fees across the Solana ecosystem. Specifically, of Solana’s $46.21 million in gas fees over the past 30 days, meme coin trading likely contributed around $30 million. While meme coin activity has boosted short-term on-chain engagement and revenue, it is inherently speculative and drains participant funds. Therefore, despite impressive metrics, we conclude that a growth model primarily fueled by meme coins lacks sustainability. The Solana ecosystem urgently needs a more balanced and healthy development path.
MEV
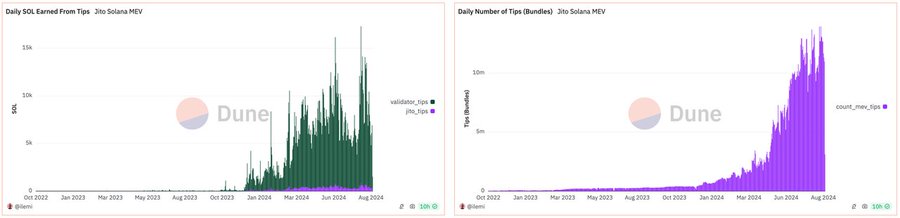
Figure 2-5 Daily MEV Fees on Solana
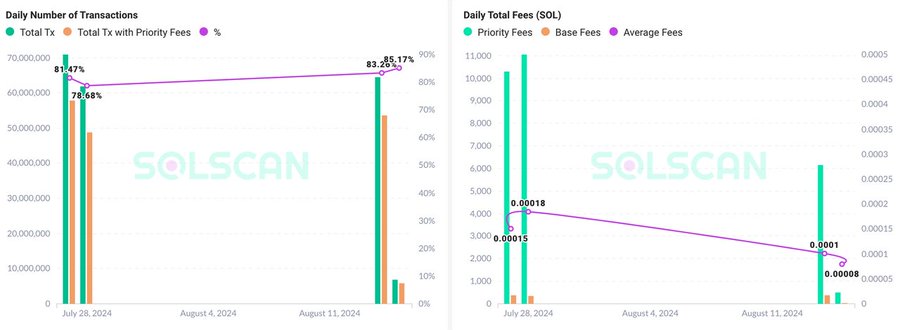
Figure 2-6 MEV Share on Solana
The MEV (Maximum Extractable Value) mechanism on Solana has evolved significantly due to surging demand from meme coin trading, becoming a defining feature of on-chain transactions.
Over the past 30 days, 82.45% of transactions on Solana included priority fees (MEV), indicating the vast majority of users leverage MEV. MEV fees accounted for 80% of total transaction fees, underscoring their prominence. Specifically, of Solana’s $46.21 million in transaction fees, over $30 million came from MEV—further confirming the dominance of meme coin trading and the widespread use of MEV to gain trading advantages.
Dex Trading Bot
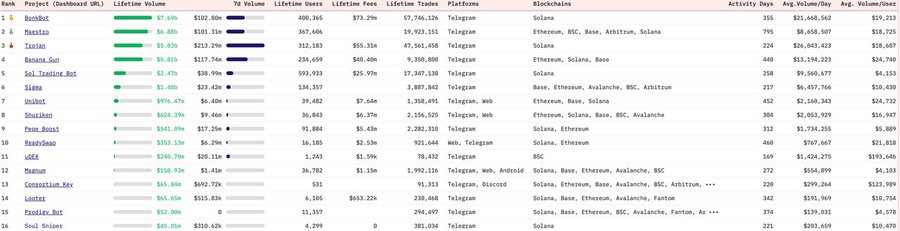
Figure 2-7 Dex Trading Bot Rankings
Analysis of Dex Trading Bot transaction volumes reveals that the top three projects—Photon, Bonkbot, and Trojan—collectively account for over 90% of transaction share on the chain.
-
Photon generated $18.96 million in revenue over the past 30 days
-
Bonkbot generated $3.35 million
-
Trojan generated $11.36 million
In total, Dex Trading Bot projects earned approximately $33.67 million in revenue on Solana over the past 30 days.
Solana Ecosystem Summary
About 80% of on-chain activity on Solana is attributed to meme coin trading, with monthly cost breakdowns for meme coin participants as follows:
-
MEV Priority Fees: $30 million
-
Dex Trading Bot Usage Fees: $30 million
-
DEX Transaction Fees: $50 million
-
Estimated Monthly Losses for Meme Coin Players: $110 million
Based on this analysis, Solana’s current ecosystem growth—driven by meme coins—faces significant sustainability risks. While meme trading has brought substantial short-term activity and revenue, it imposes heavy economic burdens on participants. A monthly loss exceeding $100 million—annualized at $1.3 billion—highlights the unsustainability of this model.
Meme coin projects lack intrinsic long-term value and depend heavily on continuous capital inflow and user participation. As losses accumulate, maintaining market热度 will become increasingly difficult. The Solana ecosystem faces a critical challenge: it must pursue a more balanced and sustainable trajectory, reducing reliance on a single, high-risk sector and fostering applications that generate lasting value to ensure long-term health and prosperity.
Solana’s participants and decision-makers must carefully assess the current development model, implement strategies to reduce dependence on meme coin trading, and actively support projects with substantive value and long-term potential to build a more resilient and sustainable blockchain ecosystem.
Tron
Tron features a unique design where transaction fees compensate for energy and bandwidth consumption rather than validator bribes. These include:
-
Energy Fee: Covers computational resources for transaction processing and validation
-
Bandwidth Fee: Covers data propagation across the blockchain network
When users lack sufficient bandwidth or energy, they must burn TRX to access transaction resources, promoting TRX deflation.
Data from Figure 3-1 shows that since October 29, 2021, the circulating supply of TRX has exhibited a continuous deflationary trend. This is primarily driven by the widespread adoption of USDT on the Tron network and the significant growth in transaction volume. The sustained expansion of stablecoin transfers strongly supports TRX’s deflationary mechanism, ensuring the long-term sustainability of its economic model.
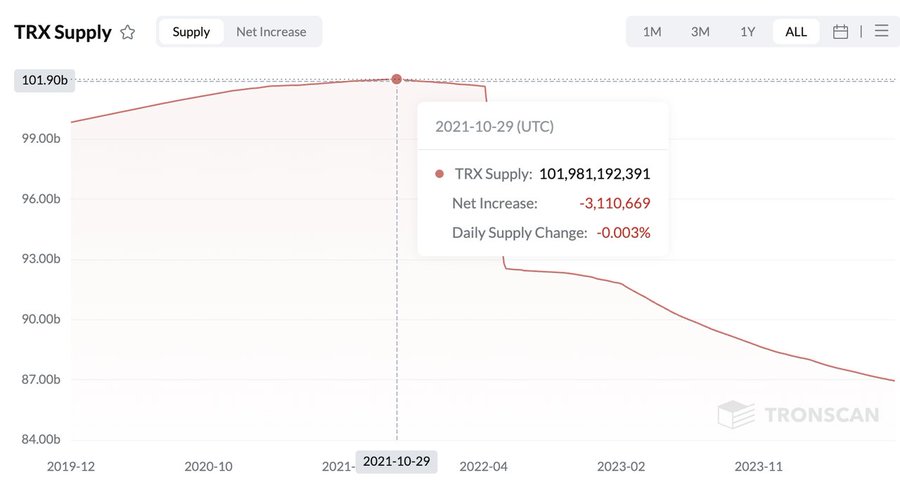
Figure 3-1 TRX Circulating Supply Trend
Figure 3-2 illustrates that, using July 22, 2024 as an example, USDT transfers accounted for 94.51% of all on-chain activity on Tron, highlighting their absolute dominance. Tron’s design advantages—including a flat $1 transfer fee (independent of amount), a rapid 3-second block time (compared to Ethereum’s 16 seconds), and no need for priority fees—give it a significant competitive edge in on-chain payments. These features meet market demand for fast, low-cost payment solutions and validate Tron’s original positioning as a payment-focused public chain. These strengths have attracted a large user base, especially in stablecoin transfers, driving sustained growth in on-chain activity and cementing Tron’s role as a key digital payment infrastructure.
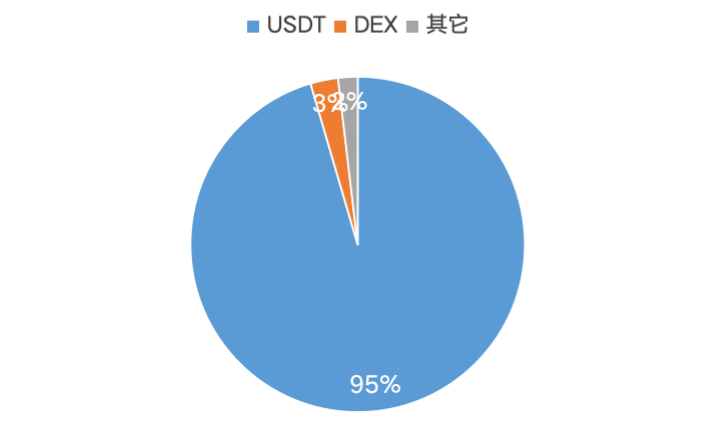
Figure 3-2 Energy Consumption Breakdown by Project on Tron (July 22, 2024)
Daily transaction volume on Tron shows strong growth, particularly accelerating since 2024—likely reflecting ecosystem expansion and rising user adoption. Between July and August 2024, transaction volume hit record highs, repeatedly surpassing 8 million per day and peaking near 9 million. This surge coincides with meme coin speculation spreading to the Tron chain.
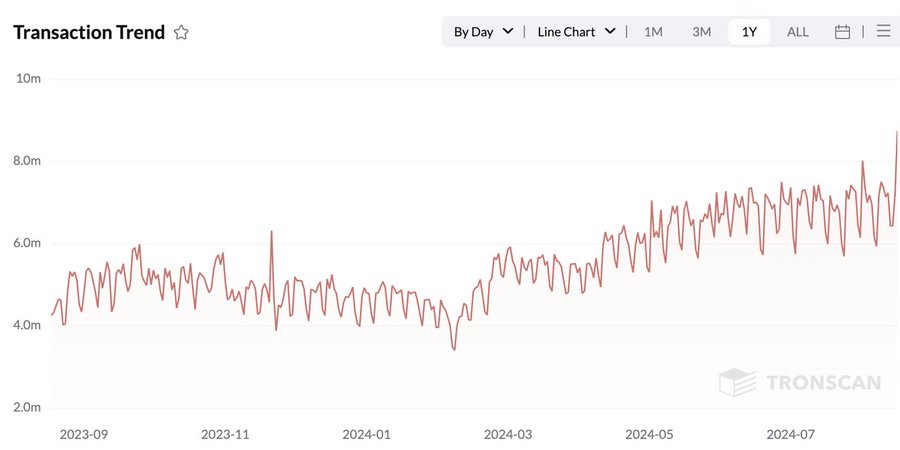
Figure 3-2 TRX Transfer Trend Statistics
In August 2024, Tron founder Justin Sun strategically announced his entry into the meme coin space, quickly attracting numerous meme projects to the ecosystem. Data shows that by August 20, Tron’s energy consumption structure shifted significantly: while USDT transfers remained the largest category, their share dropped to 52%, while DEX activity surged from 3% to 47%. This shift confirms that the influx of meme projects drove a sharp rise in short-term on-chain activity, validating Sun’s strategic move and signaling a potential structural transformation of the Tron ecosystem.
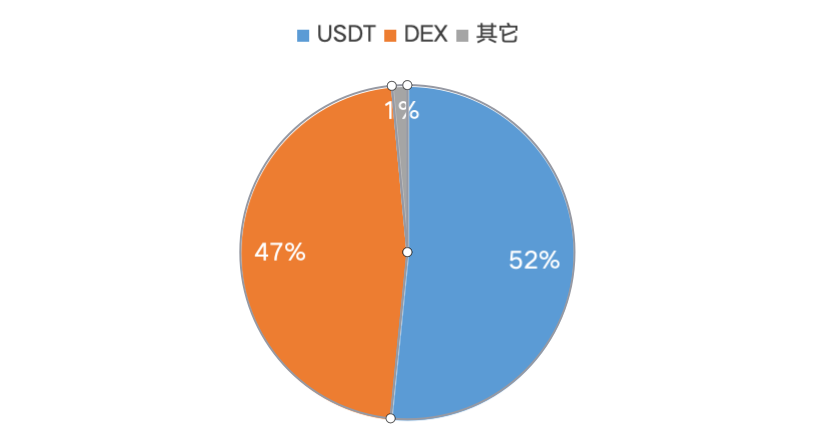
Figure 3-3 Energy Consumption Breakdown by Project on Tron (August 20, 2024)
Despite the significant drop in USDT’s share, its actual energy consumption remained stable, consistently between 80B–90B. This indicates that while meme projects have greatly increased overall activity, they have not disrupted Tron’s core business—USDT transfers. This underscores the fundamental, inelastic demand for stablecoin transfers and reaffirms their foundational role in the Tron ecosystem. This observation further suggests that even if the meme coin热潮 subsides, Tron’s core operations and stability are unlikely to be significantly impacted. This structural resilience provides strong support for Tron’s long-term development.
Although Tron’s transaction fee revenue is highly concentrated in USDT transfers, this concentration reflects users’ inelastic demand for stablecoin transactions. Combined with massive stablecoin transfer revenues, this not only demonstrates high user reliance on the Tron network but also validates the health and sustainability of Tron’s gas fee revenue structure.
Conclusion
This report analyzes the revenue composition and sustainability of Ethereum, Solana, and Tron, yielding the following key insights:
Ethereum: Most Balanced and Sustainable Development Model
-
Diversified Revenue Streams: Balanced growth across DeFi (60%), ETH transfers (12%), MEV (8%), and NFTs (8%)
-
Healthy Ecosystem: Core applications like DEXs and stablecoin transfers hold appropriate shares, reflecting genuine, sustained user demand
-
Innovation and Upgrades: Enhancements like EIP-1559 optimize fee mechanisms and create long-term value via ETH burning
-
Long-Term Potential: Diverse use cases and continuous technological innovation provide strong momentum for enduring growth
Solana: Rapid Growth with Sustainability Challenges
-
High Revenue Concentration: DEX activity accounts for 86%, with meme coin trading contributing over 55% of gas fees
-
Pervasive MEV Use: 82.45% of transactions use MEV, indicating a highly speculative environment
-
High User Costs: Estimated monthly losses for meme coin traders reach $110 million ($1.3 billion annualized)
-
Sustainability Risks: Overreliance on meme coin trading is unsustainable long-term and requires strategic rebalancing
Tron: Focused on Payments, Demonstrating Unique Strengths
-
Stablecoin Dominance: USDT transfers account for 94.51% of on-chain activity, affirming its leadership in payments
-
Clear Technical Advantages: Low fees, fast confirmation, and fixed pricing suit large-scale payment applications
-
Structural Resilience: Core USDT transfer business remains stable even amid meme coin hype
-
Long-Term Sustainability: Inelastic demand for stablecoin transfers ensures reliable, durable revenue streams
Overall Assessment
Ethereum demonstrates the strongest long-term sustainability through its diversified ecosystem and ongoing technological innovation.
Solana, while growing rapidly, faces significant risks from its overreliance on meme coin trading and requires strategic transformation to ensure longevity.
Tron has established a unique market position and sustainable revenue model by focusing on payments, particularly stablecoin transfers.
Join TechFlow official community to stay tuned
Telegram:https://t.me/TechFlowDaily
X (Twitter):https://x.com/TechFlowPost
X (Twitter) EN:https://x.com/BlockFlow_News