
Market Plunges at Start of August — Has the Yen Carry Trade Collapsed and Dragged Down Global Assets? What's Next for the Markets?
TechFlow Selected TechFlow Selected
Market Plunges at Start of August — Has the Yen Carry Trade Collapsed and Dragged Down Global Assets? What's Next for the Markets?
This article will review and interpret this major market crash.
 Navigating Web3 tides with focused insights
Monday's 85% plunge in the crypto market caught most people off guard. Compared to previous incidents like the Mt. Gox collapse and government Bitcoin sales by Germany and the U.S., this drop was far more sudden, with no clear warning signals from news or data, triggering extreme panic across the market. The Fear & Greed Index plunged to a freezing 17. Fortunately, after U.S. stocks opened Monday evening, they remained relatively stable—without the anticipated circuit breakers—and BTC managed to close above $54,000 on its daily candle, gradually recovering through Tuesday to stabilize around $56,000. A day later, with events and clues becoming clearer, we can now better review the entire downturn. This article will analyze and interpret this major market crash.
Introduction
Prior to this event, the market had already entered a unique state. With a September rate cut by the U.S. Federal Reserve now nearly certain, monetary easing expectations are no longer the primary driver. Since March this year, the crypto sector has been following U.S. equities downward without participating in their rallies.
In the short term, Wall Street is pricing in earnings season. Recently, MicroStrategy released its latest financial results below market expectations; Coinbase reported a 97% drop in Q2 net profit and an 11% sequential decline in revenue. Additionally, delays in NVIDIA’s new chip launch and Warren Buffett’s减持 of Apple stock impacted tech giants such as Meta, Google, and Microsoft, leading to sharp corrections in tech stocks. The S&P 500 has returned nearly ninefold since 2016, prompting many investors to take profits. Meanwhile, risk markets remain under pressure from multiple factors: global economic recession, geopolitical conflicts, Bank of Japan rate hikes, and the upcoming U.S. election.
I. Bloodbath in Risk Assets and the Crypto Market
U.S. equities suffered a massive shock last Friday after non-farm payroll numbers came in weaker than expected, triggering the Sahm Rule—a recession signal proposed by Federal Reserve economist Claudia Sahm. The rule states that if the three-month moving average of the unemployment rate rises 0.5 percentage points above the previous 12-month low, the economy may already be in recession. Since 1970, this indicator has had a 100% accuracy rate in predicting recessions. As a result, U.S. markets lost $2.9 trillion in value.
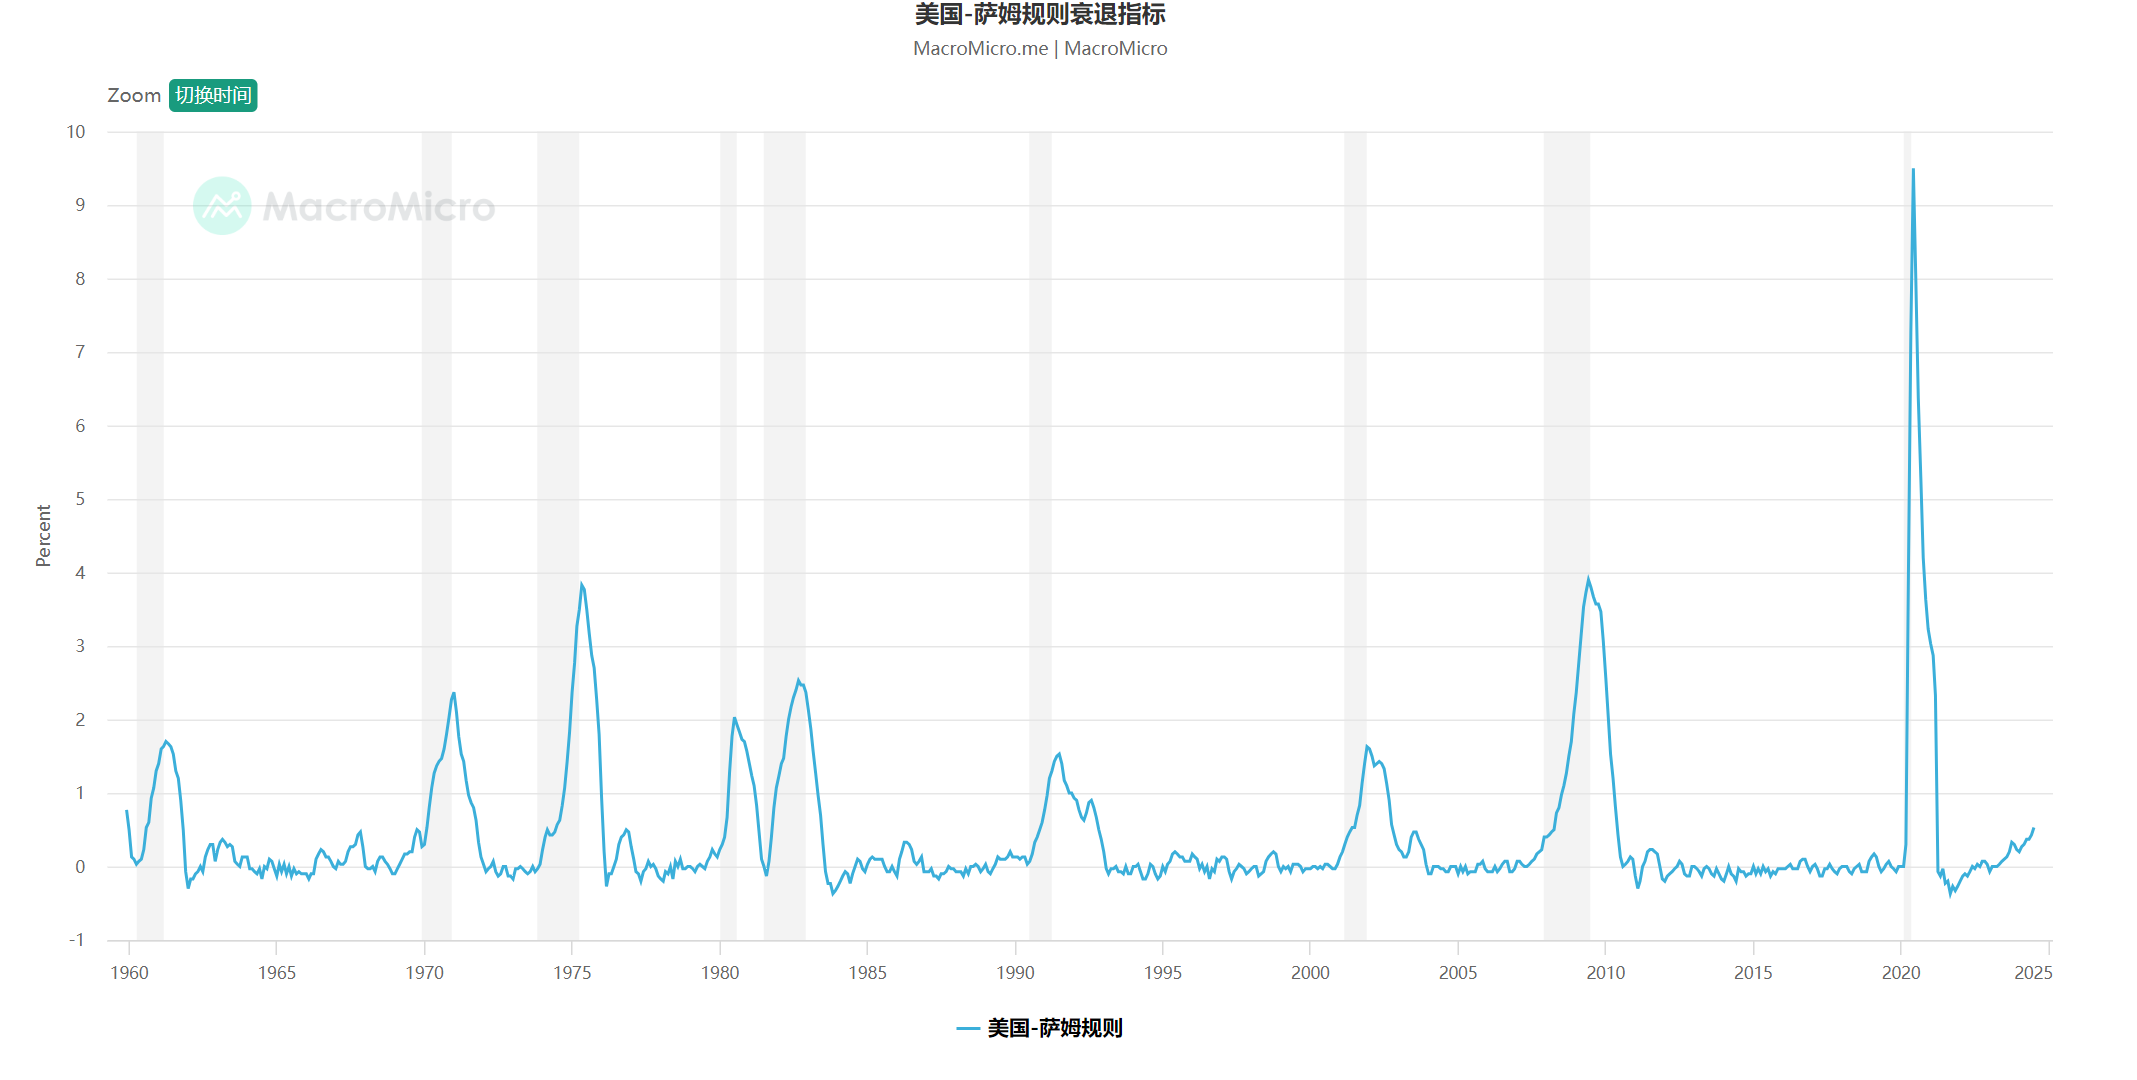
Sahm Rule data source: MacroMicro
Before Monday’s open, U.S. pre-market trading hit circuit breakers, but due to time zone differences, some global markets hadn’t yet opened, delaying the full impact until Monday.
Attention turned to yen carry trades. Starting Wednesday, weak U.S. economic data—including ADP jobs, jobless claims, and the official non-farm payrolls—signaled macroeconomic weakness. Coupled with the Bank of Japan’s surprise rate hike, expectations for dollar depreciation and yen appreciation intensified. Traders rushed on Monday to unwind carry trades—previously borrowing cheap yen to invest in higher-yielding assets—by selling U.S. equities and other high-return assets to cover yen-denominated debt. This triggered a global sell-off in risk assets.
Performance of Risk Assets
On August 5, global equities fell sharply. Asian markets led the way: Japanese indices were heavily hit, with the TOPIX index triggering circuit breakers multiple times, falling 20% from July highs into technical bear territory. The Nikkei dropped over 4,000 points, down more than 12% in a single day. South Korea’s KOSDAQ fell 8%, also triggering a halt. Europe’s STOXX 600 dropped 3%; Italy’s FTSE MIB fell over 4%; Germany’s DAX declined 3%; Portugal’s PSI slipped 2.43%; Israel’s benchmark index fell #%; Indonesia’s main index dropped 4%; India’s NSE50 fell over 3%; Taiwan’s stock market plunged 8%, its worst drop since 1967. Global markets collapsed like dominoes, sparking a stampede.
Mainstream Crypto Asset Performance
During Monday’s selloff, the crypto market was similarly devastated. BTC briefly dipped below $50,000 twice, spiking down to $48,900, with a maximum drawdown exceeding 15%. Its weekly Bollinger Bands broke below the lower band. ETH fared worse—amid rumors of liquidation by Jump Trading—plunging to $2,100, down over 22%, wiping out all its 2024 gains. SOL showed relative resilience, dipping to $110 before rebounding quickly, ending down only 6%. It’s hard to believe that just one week earlier, SOL was trading at $193. Other cryptos also crashed, leaving the market in despair. Panic gripped traders, with the Fear & Greed Index dropping to 26 on the day, indicating “fear.”
ETF Inflows and Outflows:
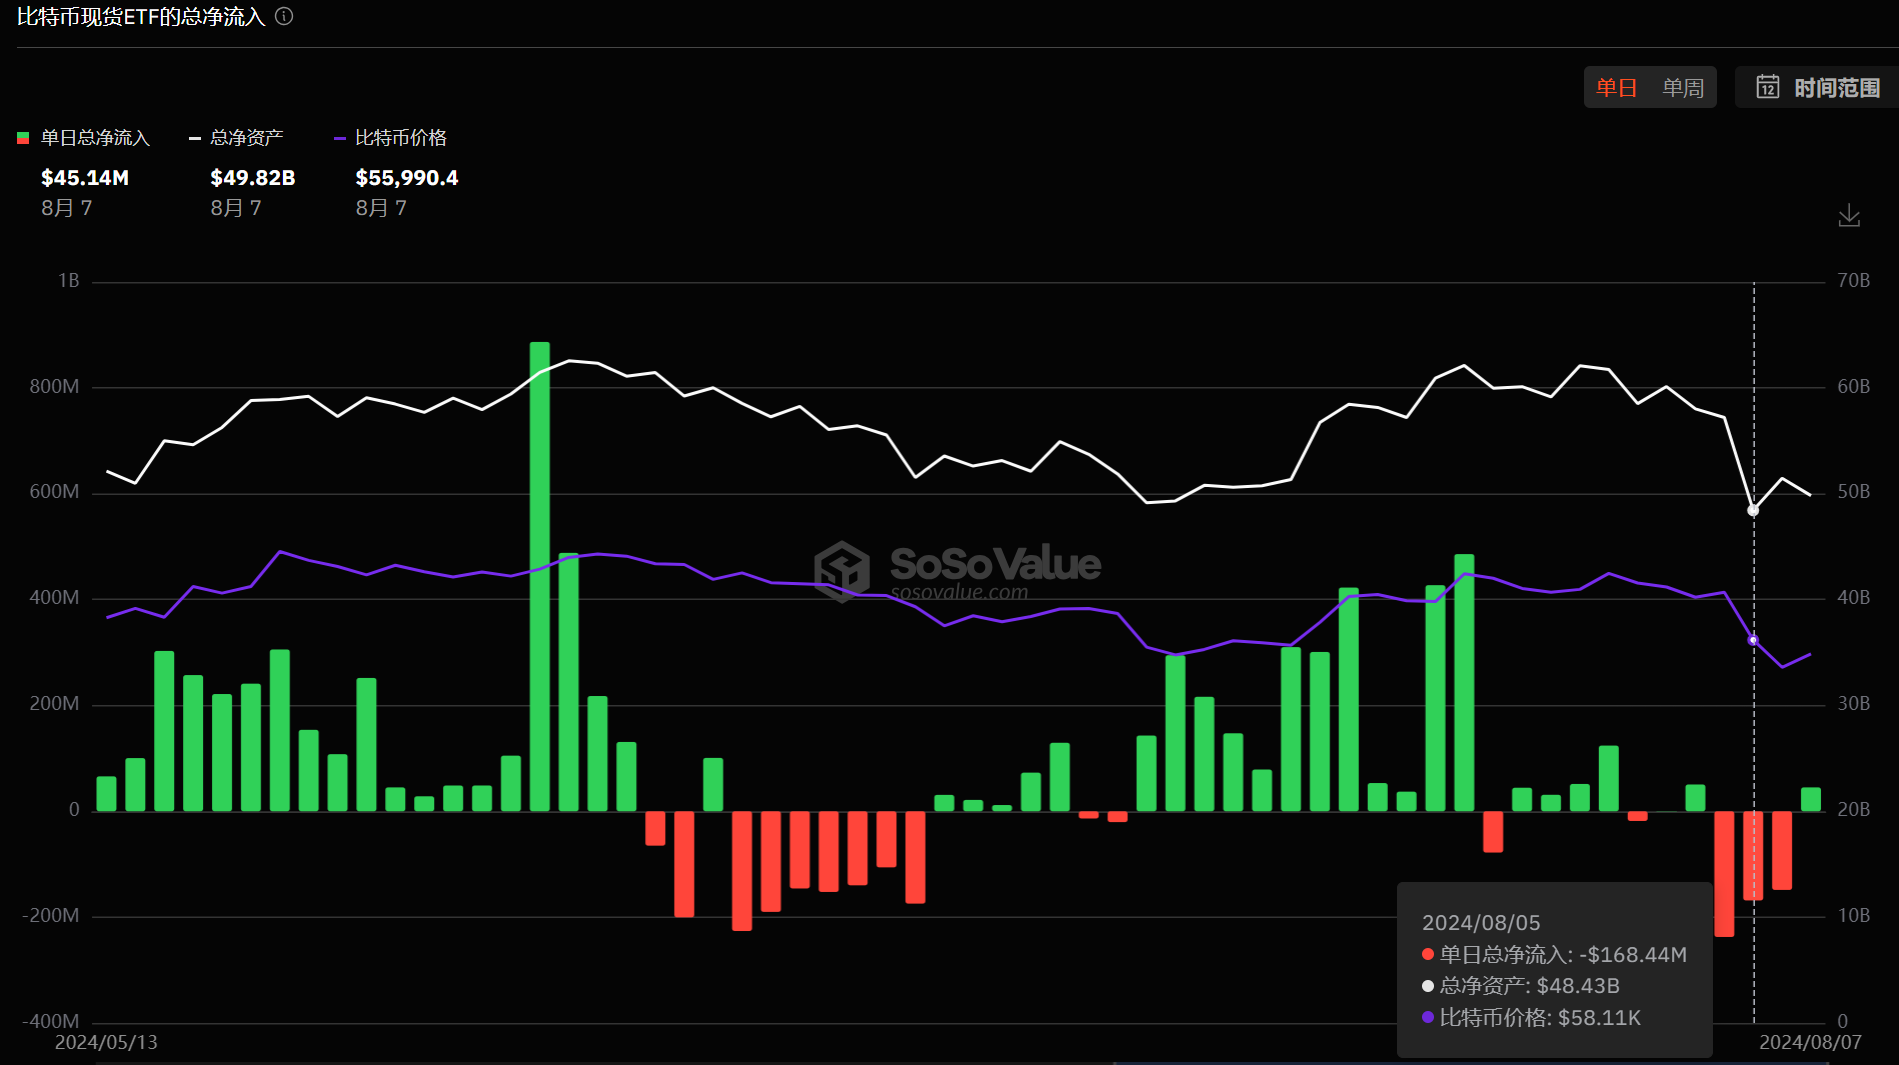
BTC spot ETFs saw consecutive days of significant net outflows, suggesting the market still needs time to heal.
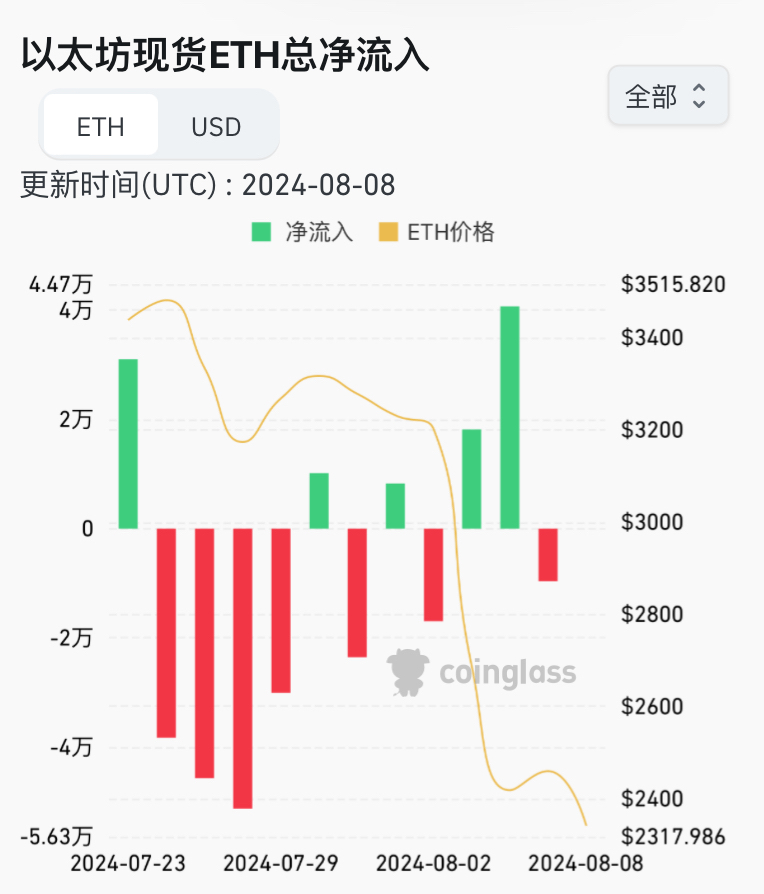
On Friday, August 2, Bitcoin spot ETFs recorded a total net outflow of $237 million, primarily driven by Fidelity’s FBTC ($104 million) and Ark Invest’s ARKB ($87 million). Ethereum ETFs saw a net outflow of $54 million, mostly from Grayscale’s ETHE, while others saw minor activity.
On Monday, August 5, ten U.S. Bitcoin ETFs posted a total net outflow of $168 million: FBTC ($58.04 million), ARKB ($69 million), GBTC ($69.12 million). Nine U.S. Ethereum ETFs recorded a net inflow of $48.8 million: Grayscale’s ETHE saw outflows of $46.8 million, while others were net buyers. BlackRock’s ETHA alone attracted $47.1 million.
On Tuesday, August 6, U.S. Bitcoin ETFs remained negative, with a total net outflow of $148 million. U.S. Ethereum ETFs saw a net inflow of $98.4 million: Grayscale’s ETHE outflowed $39.7 million, while BlackRock poured in a staggering $110 million. Two consecutive days of positive inflows suggest growing institutional interest in Ethereum.
II. What Triggered the Crash?
Returning to crypto, beyond the yen rate hike and unwinding of carry trades—which involved selling liquid assets like U.S. equities and cryptocurrencies—there was another catalyst: rumors that market-making giant Jump Trading might have dumped all its crypto holdings.
On August 5, BitMEX founder and prominent influencer Arthur Hayes tweeted that he’d learned from sources that a major whale had taken heavy losses and was dumping all crypto positions: “Not sure if it’s true. I won’t name names.” Most in the community suspect the whale is Jump Trading.

According to Arkham data, early on August 5, Jump Trading’s stablecoin allocation reached 96% of its portfolio, worth $590 million, with $569 million in stablecoins—suggesting it had likely sold most of its digital assets.
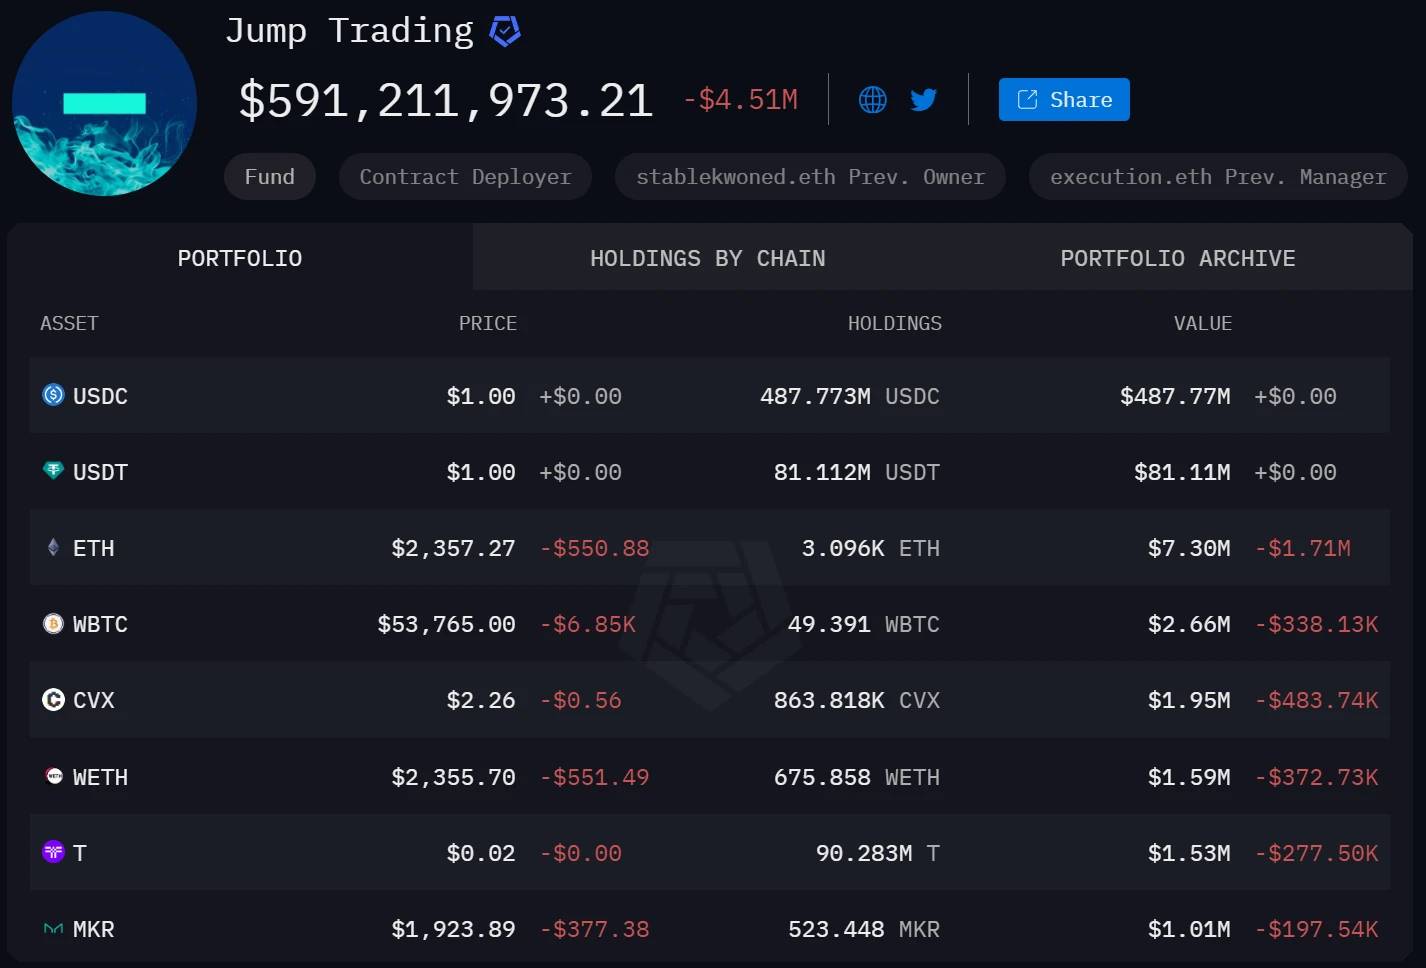
Here’s a detailed look at Jump’s holdings near the end of August 5:
-
USDC: $325 million
-
USDT: $129 million
-
wstETH: $128 million
-
ETH: $68 million
-
rETH: $10.44 million
-
wETH: $3.05 million
As of August 7, Jump continued withdrawing staked ETH on-chain and selling further, with its asset holdings still declining:
-
USDC: $307 million
-
USDT: $66.86 million
-
wstETH: $108 million
-
ETH: $9.62 million
-
rETH: $8.83 million
-
wETH: $2.58 million
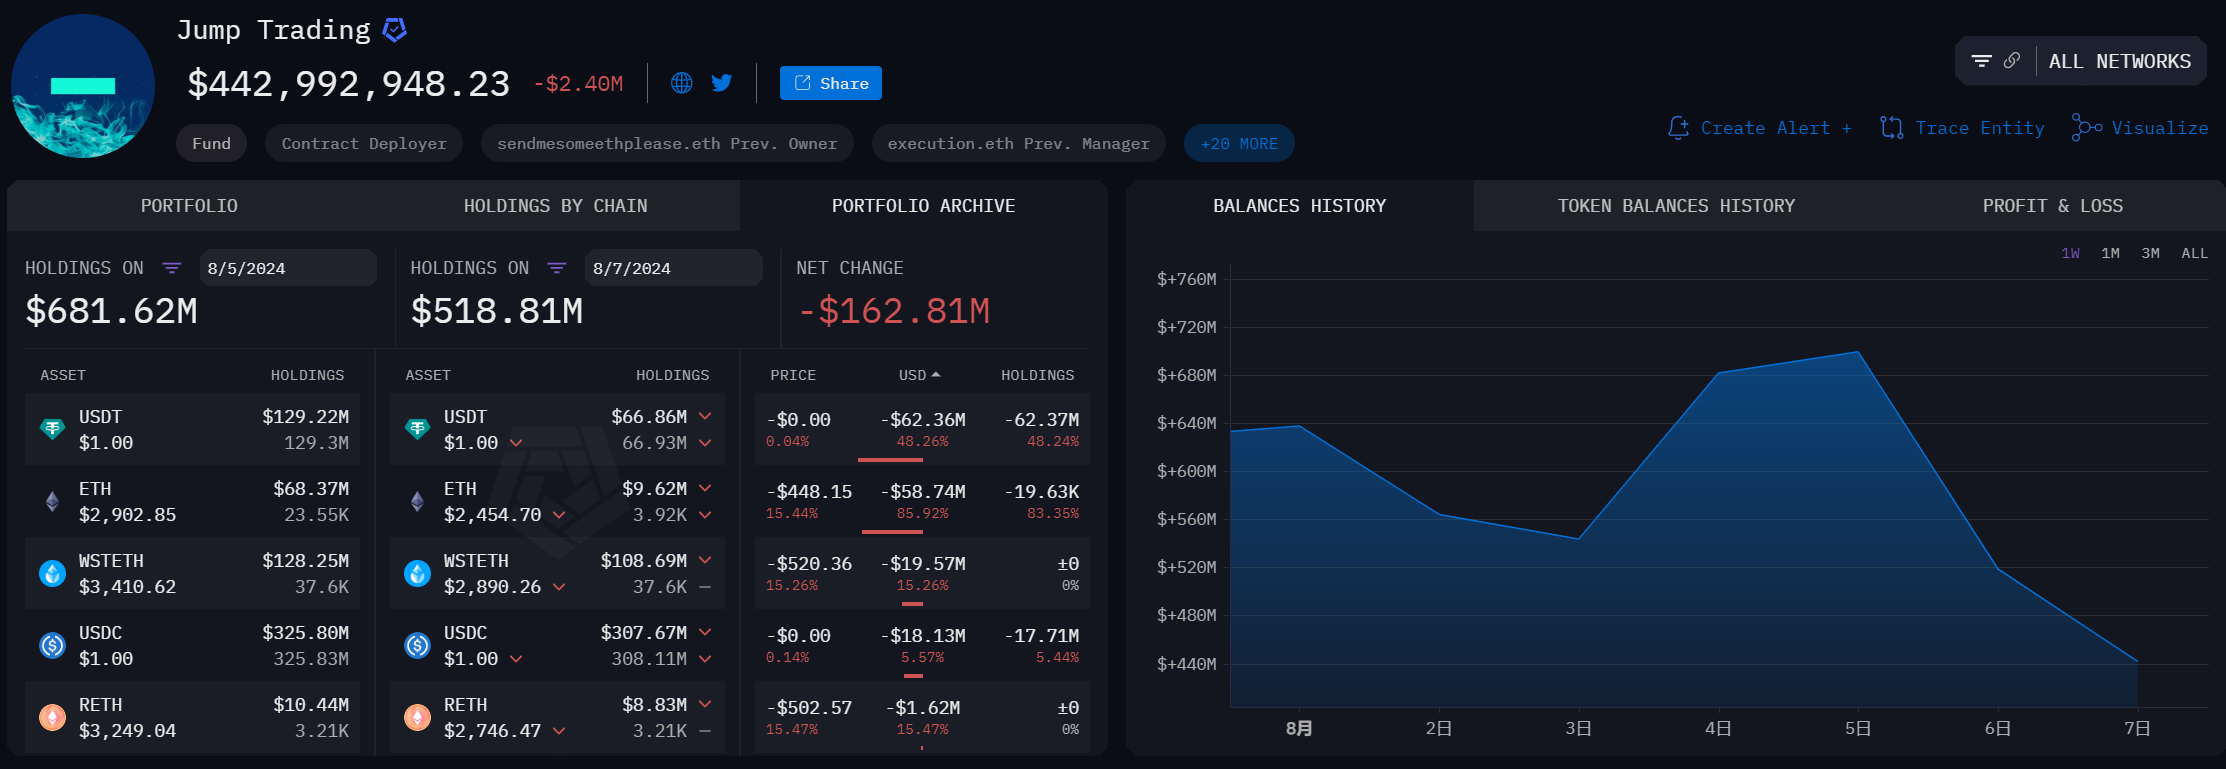
Jump Holdings Changes, Source: Arkham
Was the ETH crash really caused by Jump’s dump? According to Arkham monitoring, Jump Trading had actually begun selling as early as July 24. By August 7, it had already offloaded 83,000 wstETH (worth $377 million)—well before the crash. A closer look at Jump’s transfer data shows that during the crash, it also moved $200 million to exchanges to buy the dip. Some speculate that Jump may have exploited retail panic, taking advantage of thin weekend liquidity to simultaneously dump and short-sell, then buying back once prices bottomed.
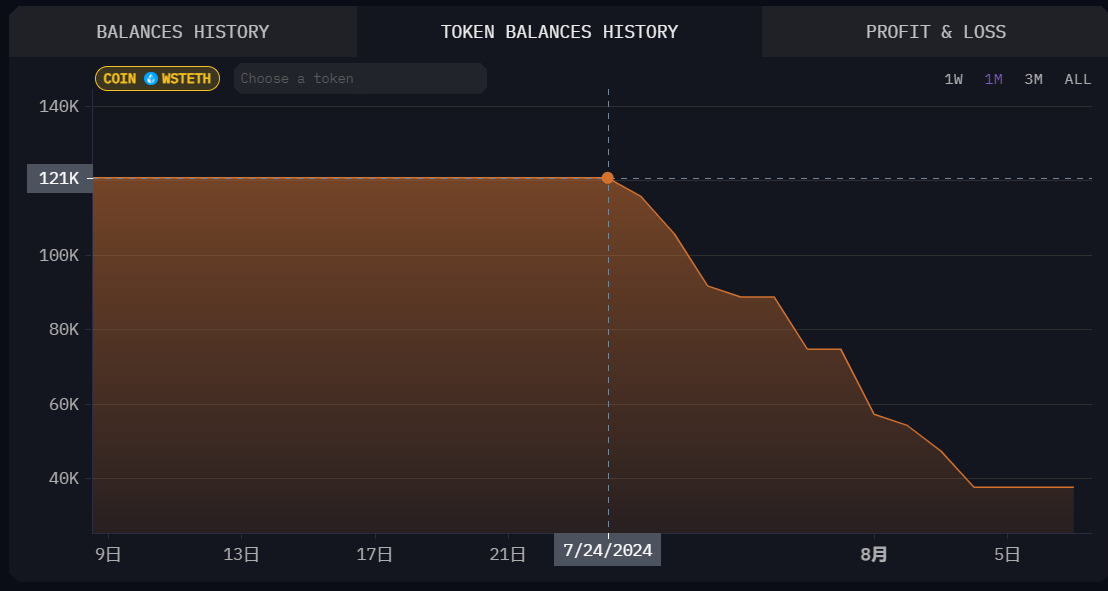
Jump wstETH Holding Changes, Source: Arkham
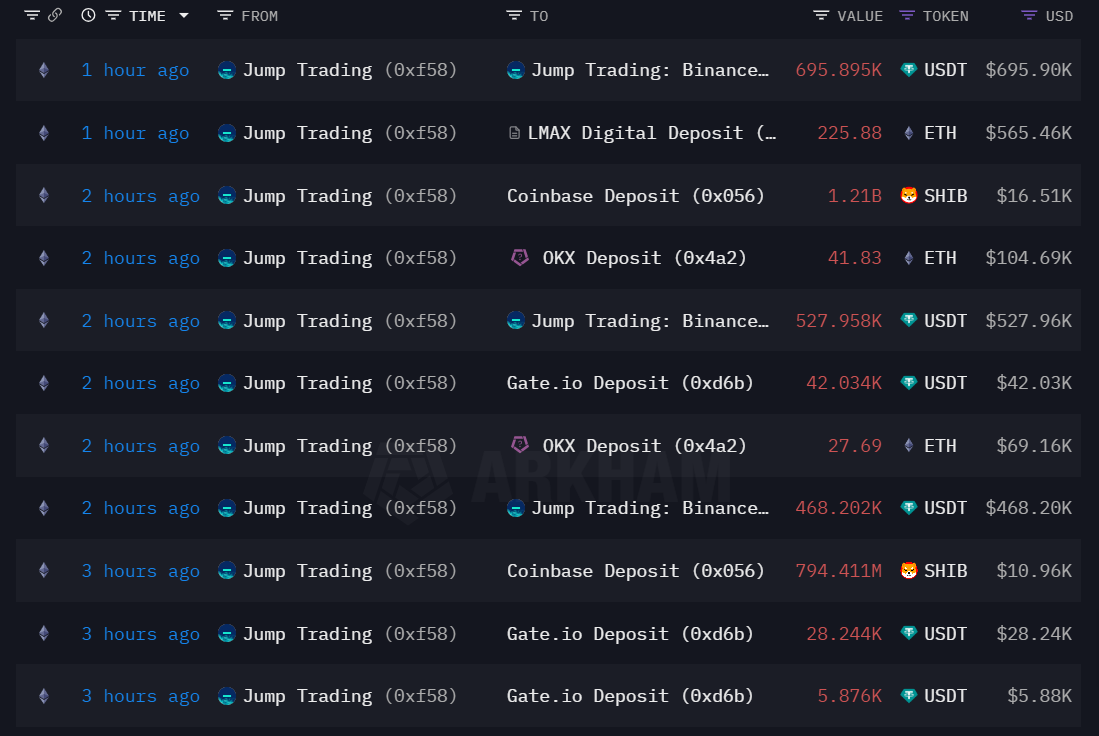
Jump On-Chain Wallet Transaction History, Source: Arkham
In summary, this crash appears less like a true black swan and more like a leveraged long squeeze amplified by short-term panic triggered by Japan’s rate hike. Indeed, markets began recovering immediately after the August 5 oversold condition, with both equities and crypto rebounding. In a bull market, a 20% correction is quite normal.
III. Violent Rebound in Risk Assets — Potential Crypto Market Reversal
U.S. Stock Market
After the broad sell-off on Monday, U.S. equity futures rose on Tuesday: Nasdaq futures up 2%, S&P 500 futures up 1.5%, Dow futures up 1%. When cash markets opened, all three major indices rallied: Dow closed up 0.76%, Nasdaq up 1.03%, S&P 500 up 1.04%. After Japan’s market plummeted and hit circuit breakers on August 5, the Nikkei 225 surged over 3,200 points on August 6, rising more than 10%, triggering upward halts in both the Nikkei and TOPIX futures. By market close, the Nikkei had gained 10.23%. South Korea’s KOSPI spiked over 5%, again hitting a trading halt.
Meanwhile, institutions stepped in to buy. Hedge funds aggressively bought $14 billion in U.S. stocks during Monday’s crash. Cathie Wood’s Ark Invest purchased over $60 million in Tesla, Meta, Amazon, Coinbase, and Robinhood shares.
This strong institutional buying reinforces bullish sentiment. Several indicators suggest U.S. equities may be nearing a short-term bottom: both the S&P 500 and Nasdaq 100 have 14-day RSI levels approaching 30, signaling oversold conditions and potential for a bounce.
Crypto Market
Following Monday’s crash, August 6 saw a strong oversold rebound in crypto. Bitcoin rose 3.7%, peaking near $57,000, showing wide-range consolidation. Ethereum gained 5.8%, SOL rebounded over 15%. Has the worst selling pressure passed? Let’s examine the data:
-
Total crypto market cap, after crashing on Monday, has recovered from $1.94T to $2.1T.
-
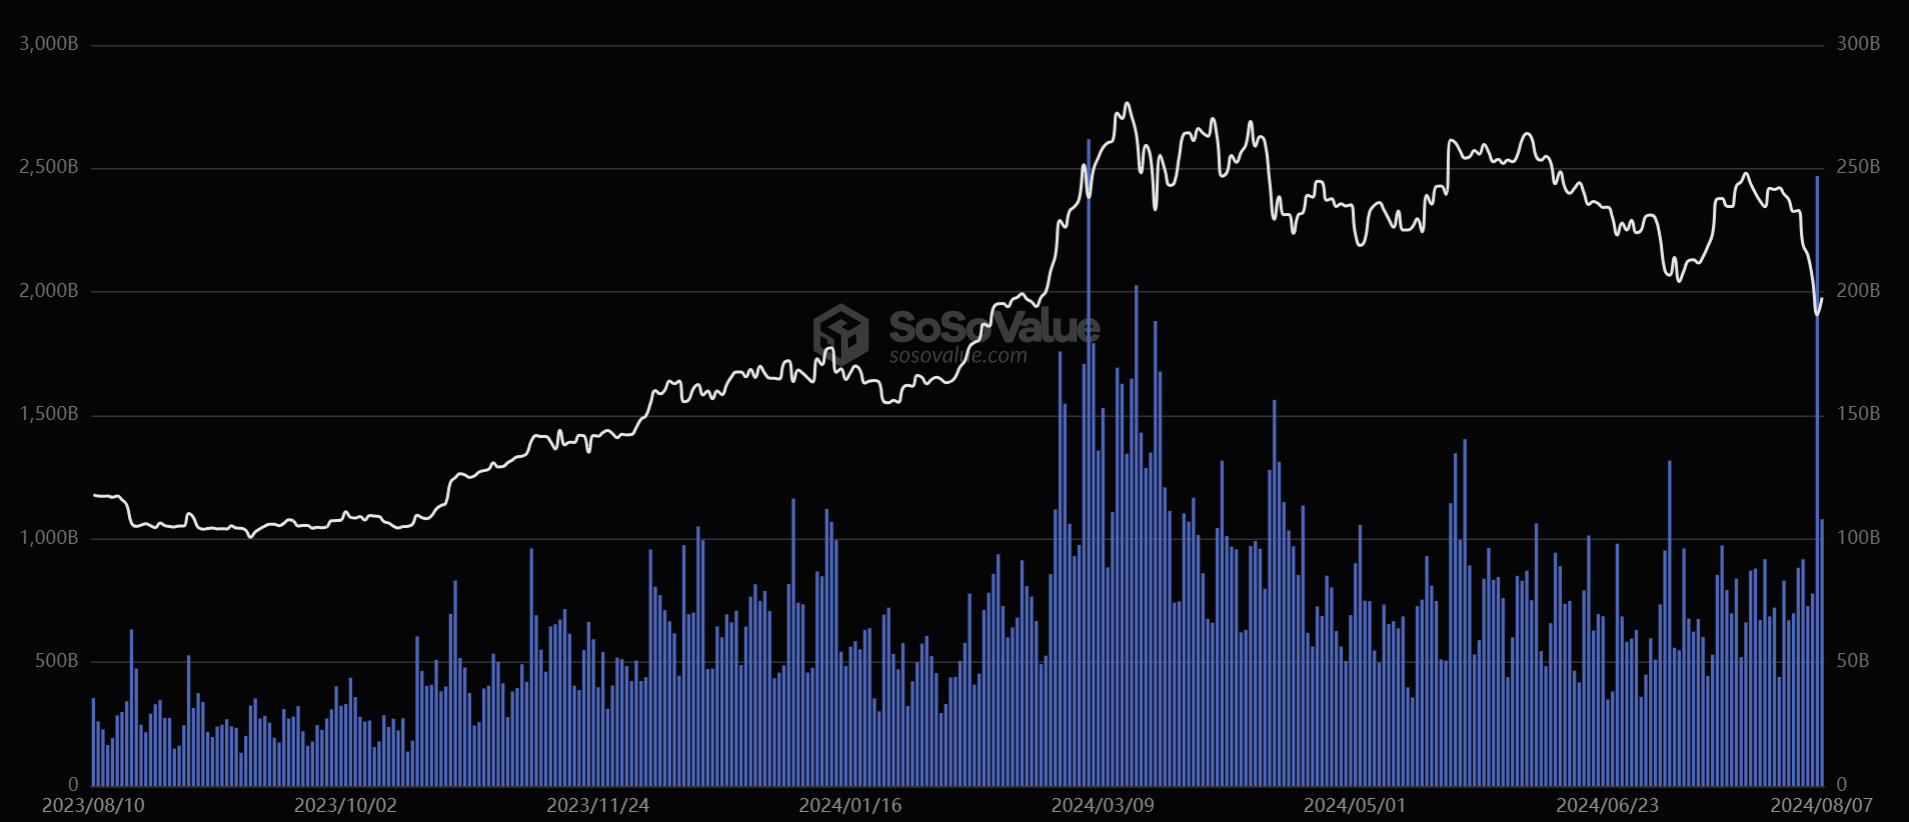
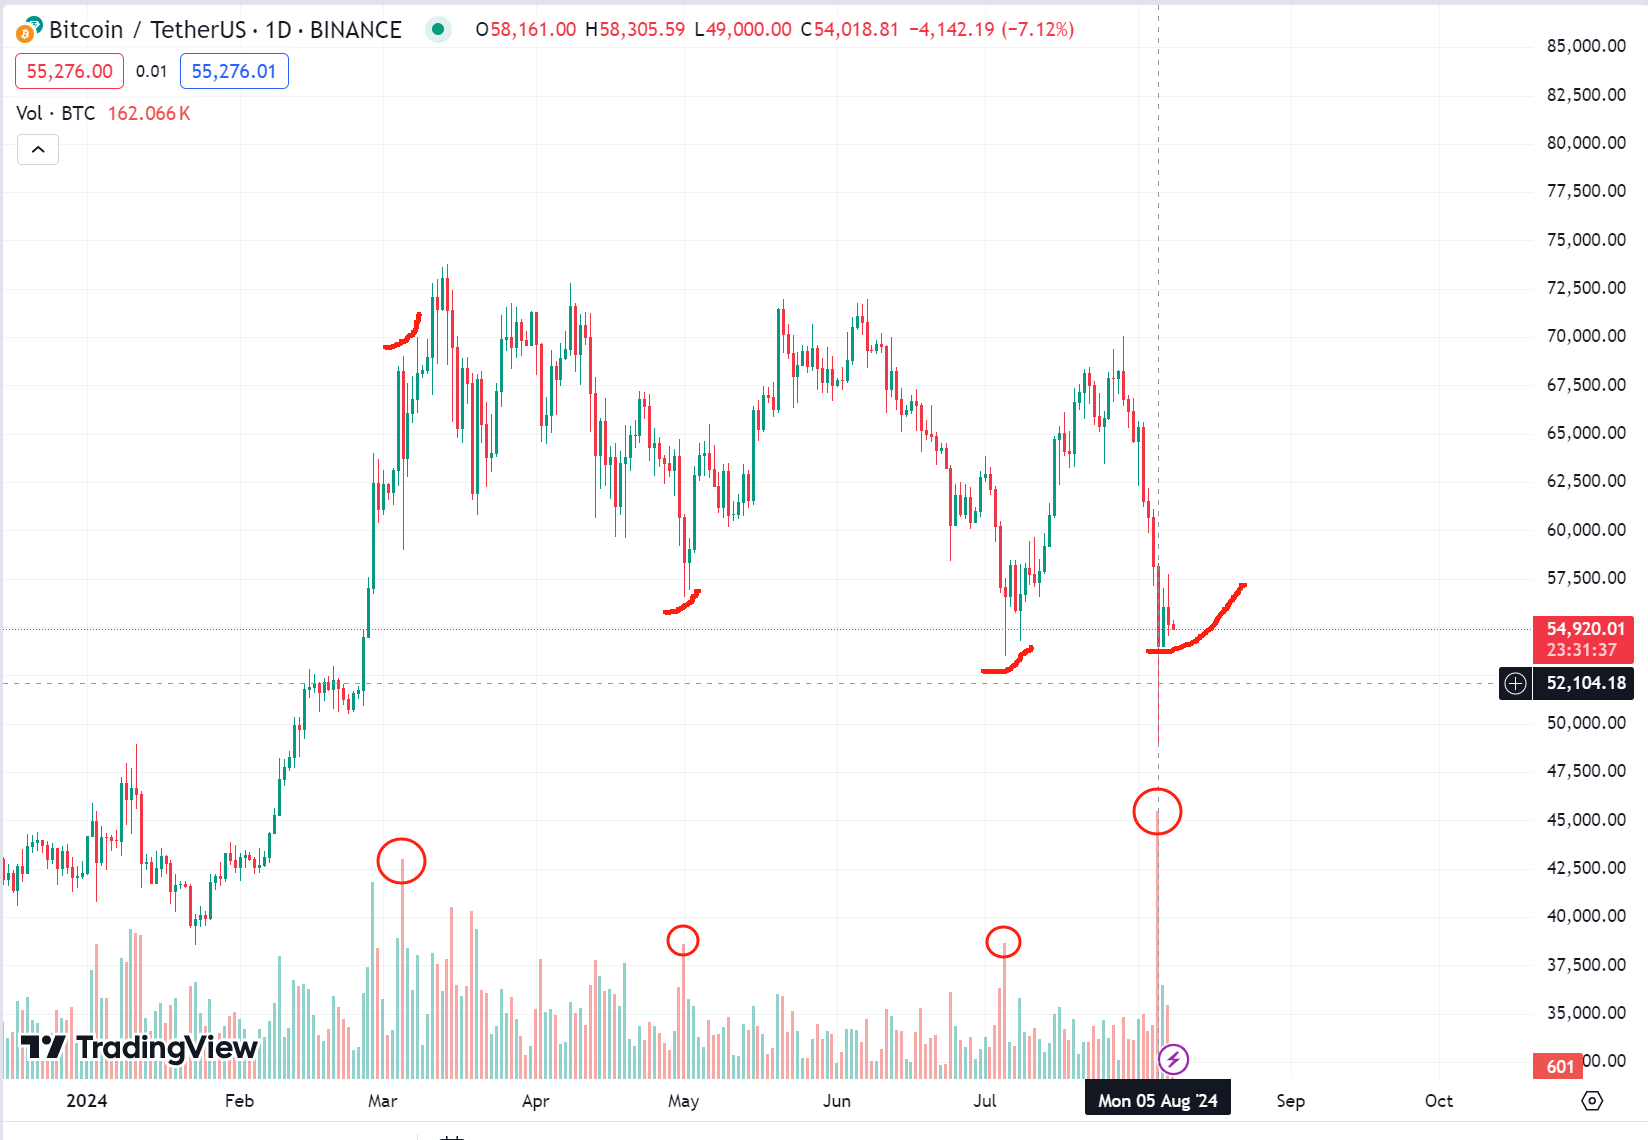
BTC and ETH trading volume hit record highs on August 5. Historical data (shown below) suggests price reversals often follow such spikes. While not guaranteed, such volume typically slows down the pace of declines.
-
Bitcoin perpetual contract open interest dropped over 30% after August 5, falling to $25.8 billion. Funding rates turned deeply negative, flushing out leveraged longs. The fastest phase of the sell-off may be over.
-
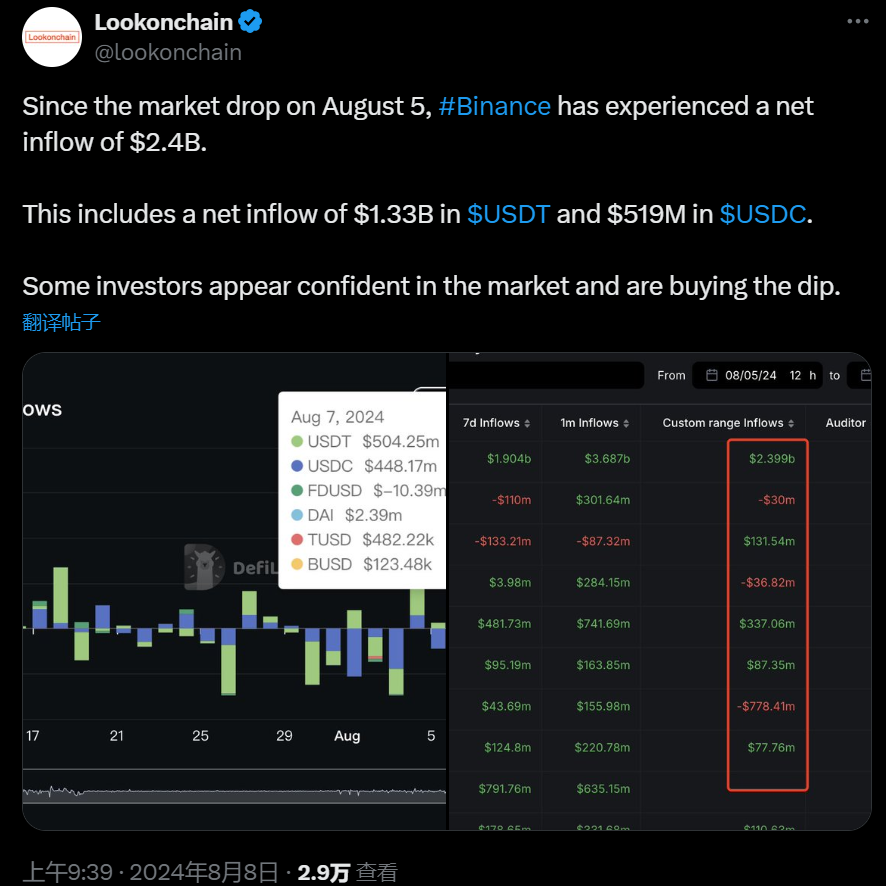
According to Lookonchain, stablecoin deposits on centralized exchanges (CEX) continued rising. Since August 5, Binance alone saw $2.4 billion in net inflows—indicating investor confidence and accumulation on dips.
-
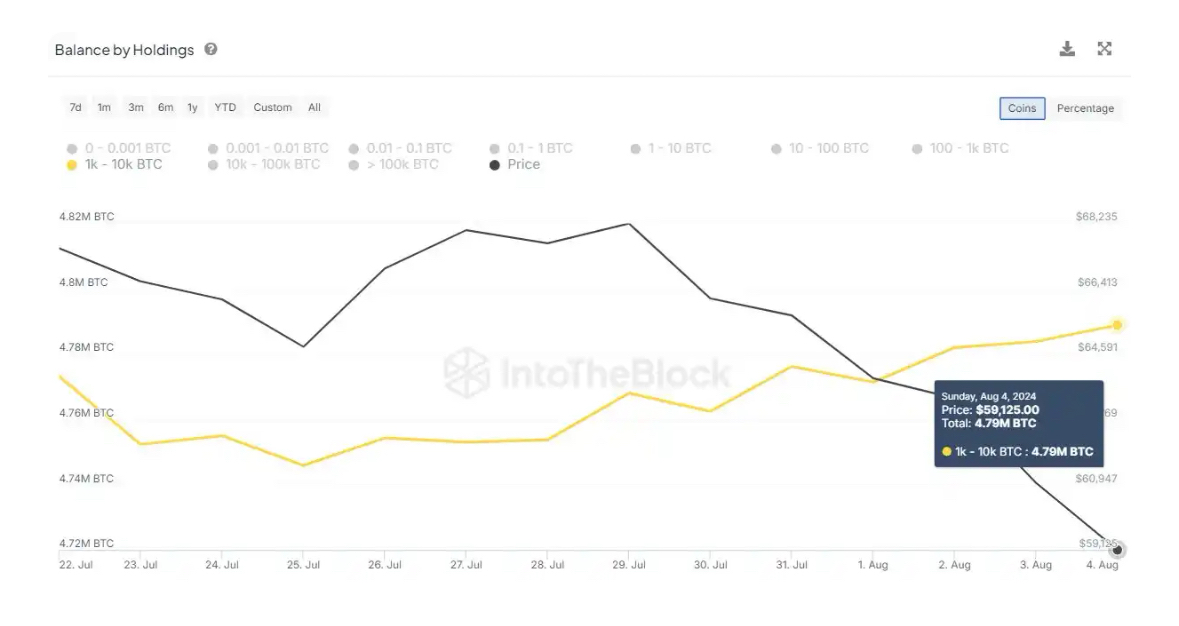
Whales holding over 1,000 BTC consistently increased their holdings during the dip.
Data source: IntotheBlock
-
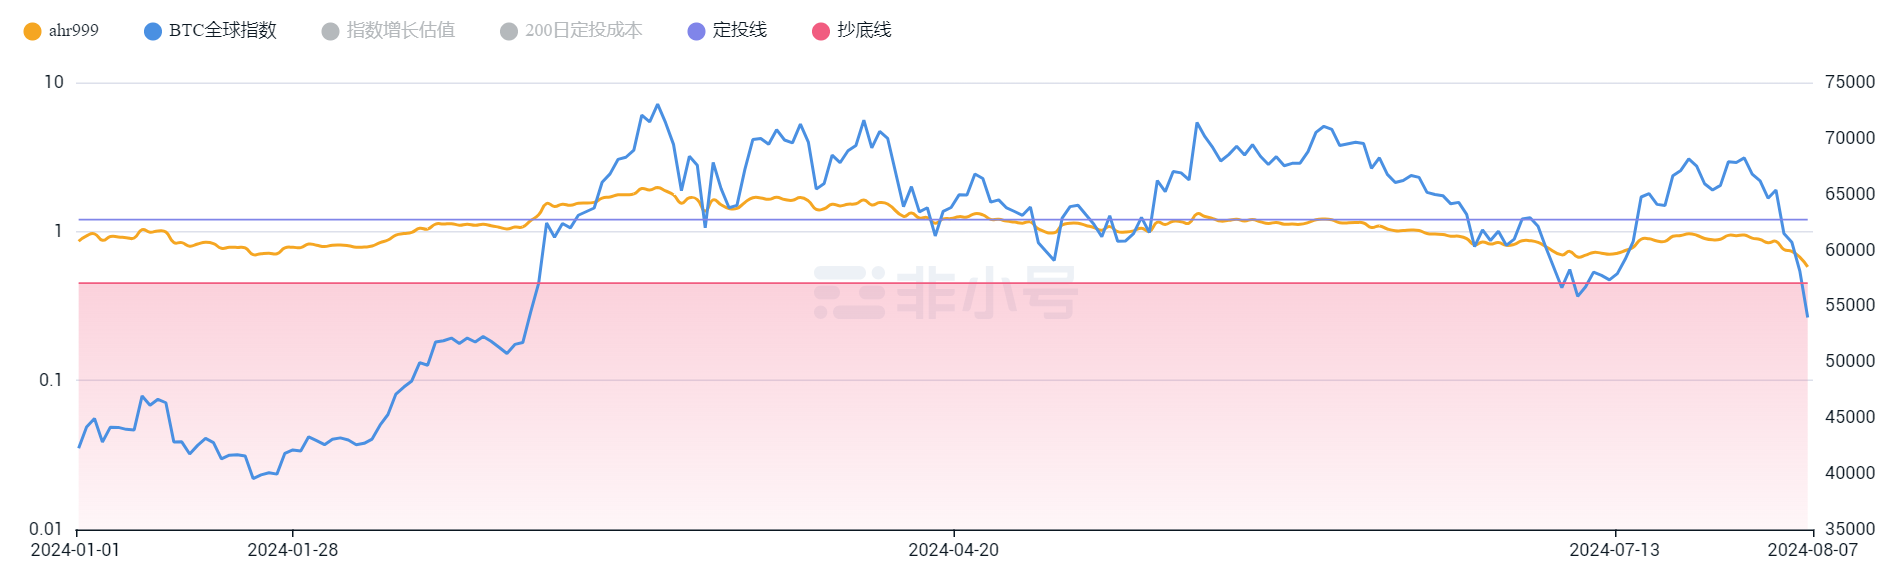
AHR999 Index: On August 7, the AHR999 stood at 0.61, having fallen sharply since August 5. The current 200-day cost basis is $60,950. The theoretical DCA range is 0.45–1.2. At ~$55,000, long-term investors may find this an attractive entry point.
-
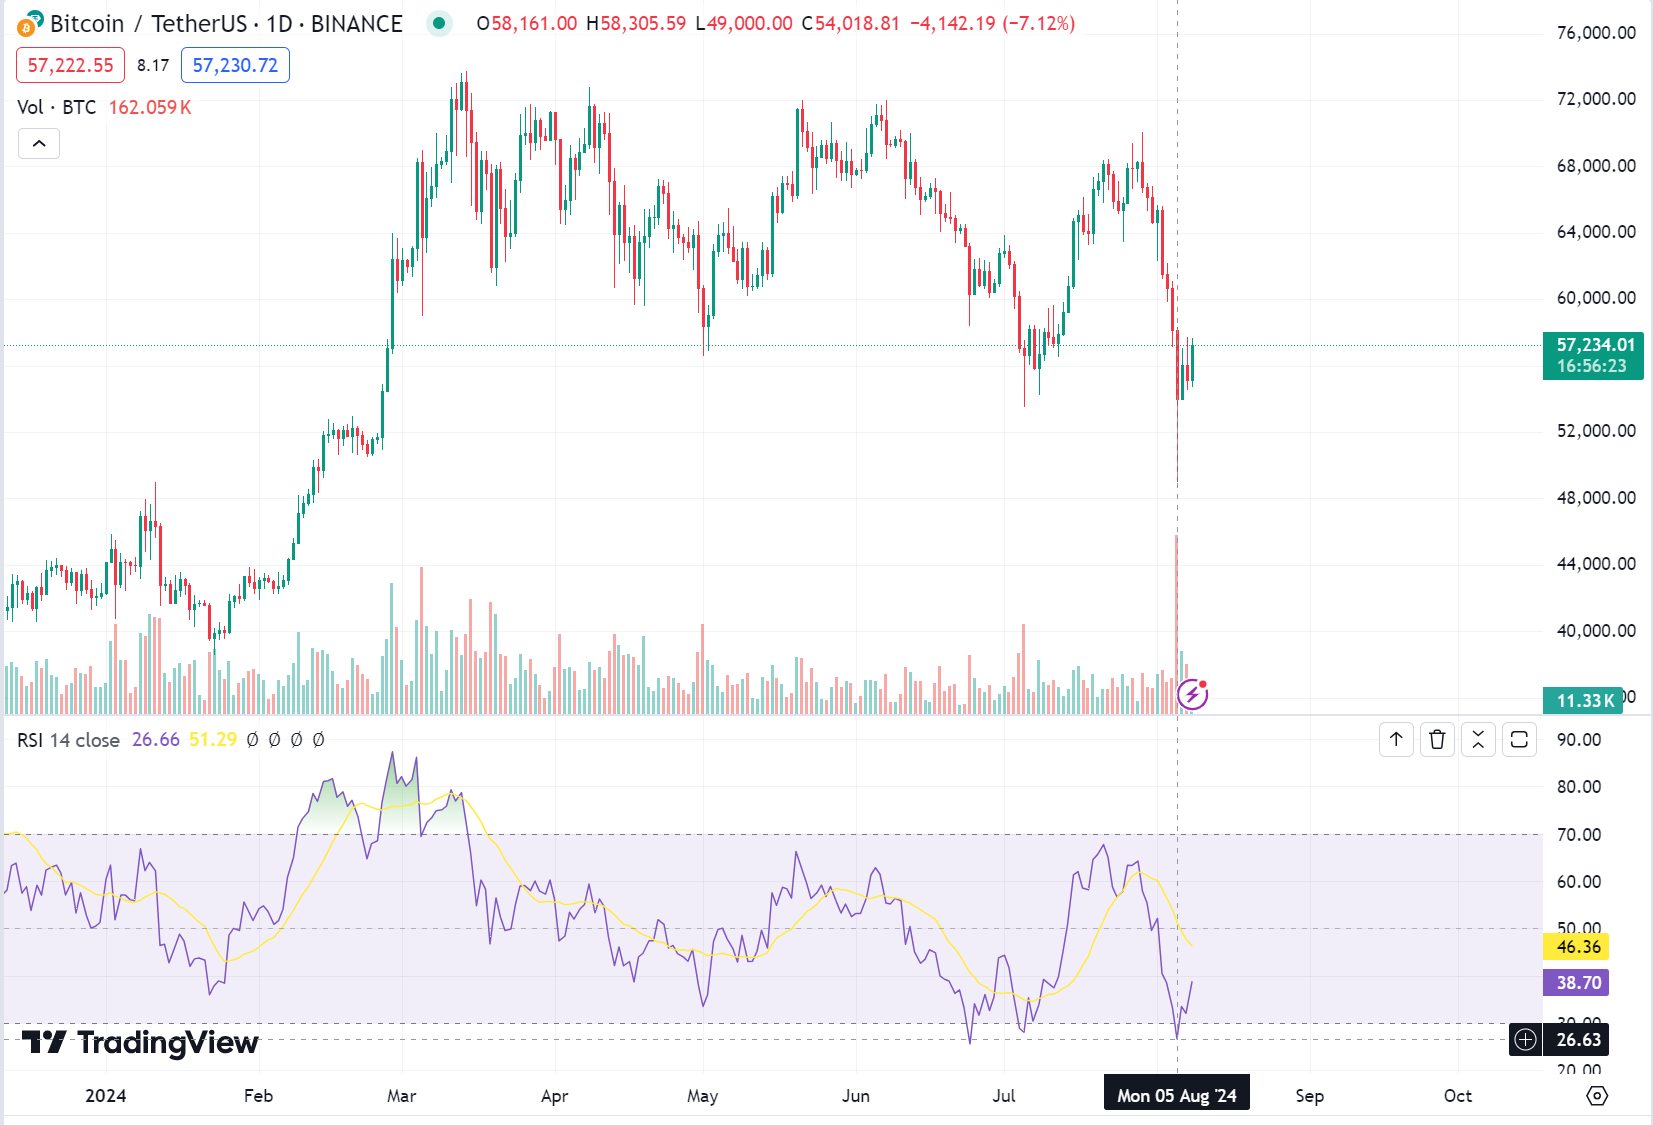
BTC’s RSI dropped to 26 at Monday’s low, indicating deeply oversold conditions—historically a good area to accumulate.
-
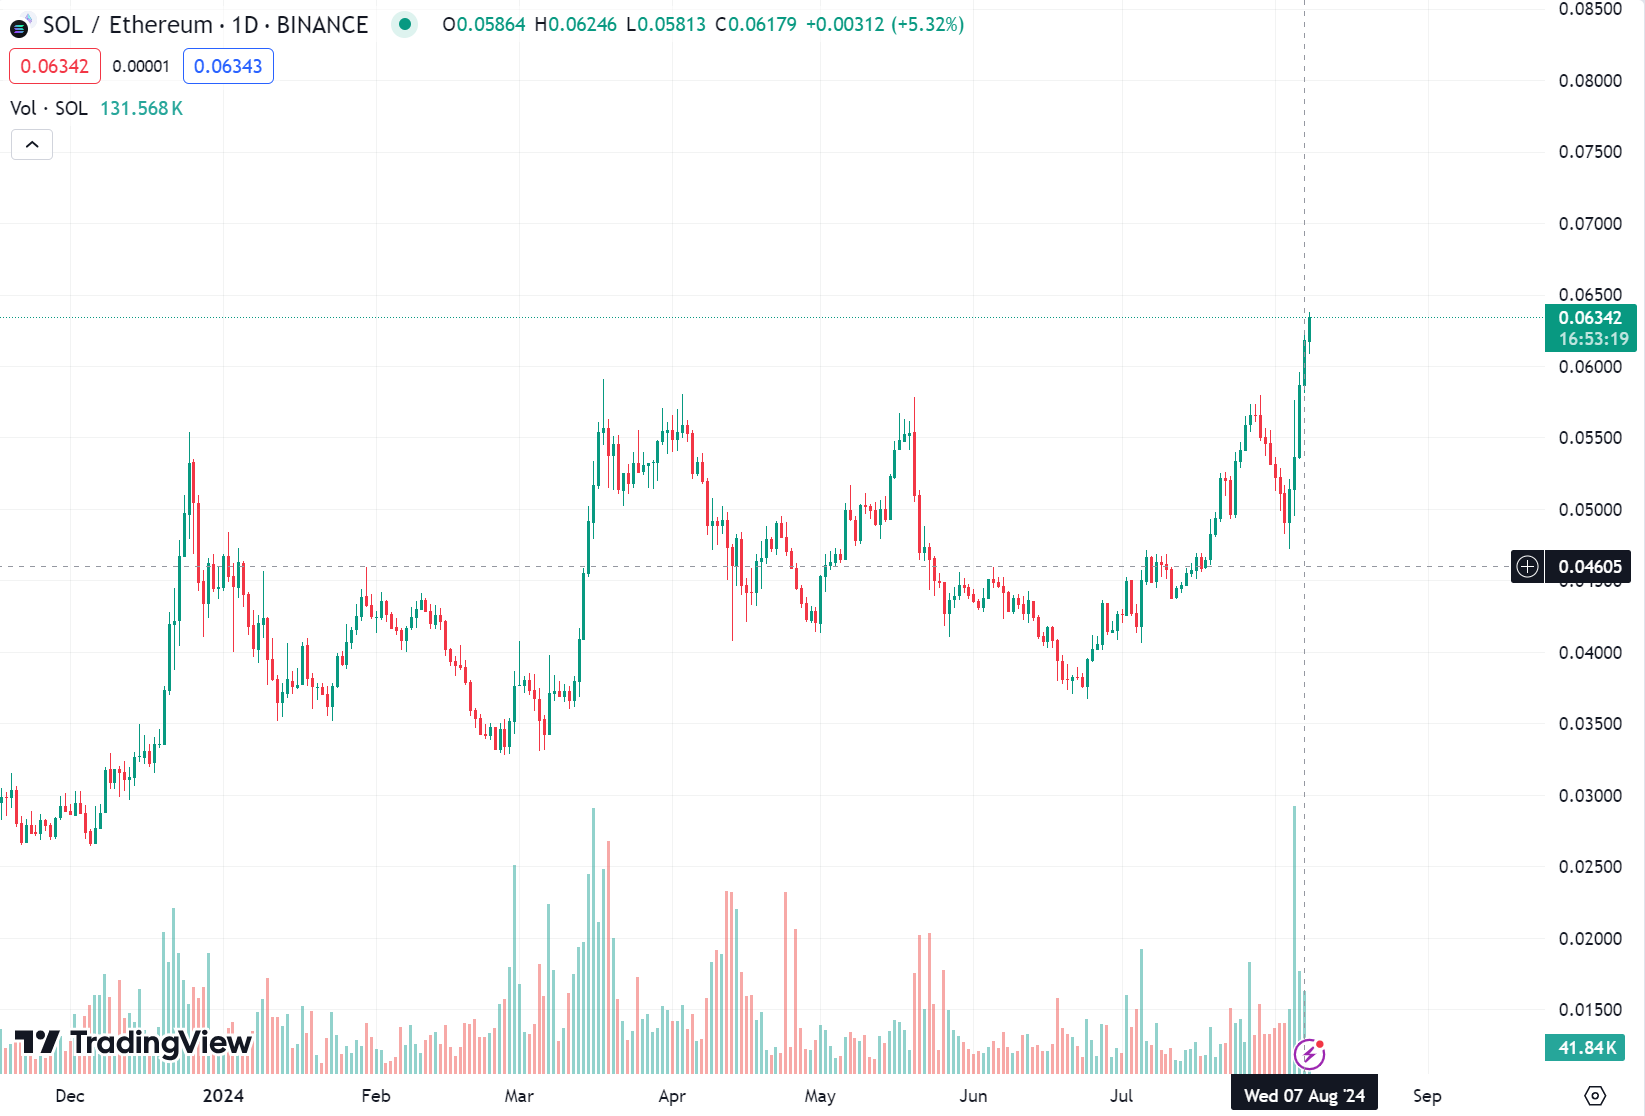
The SOL/ETH exchange rate broke above 0.06 on August 7, hitting a new high, showing market sentiment isn’t entirely broken.
-
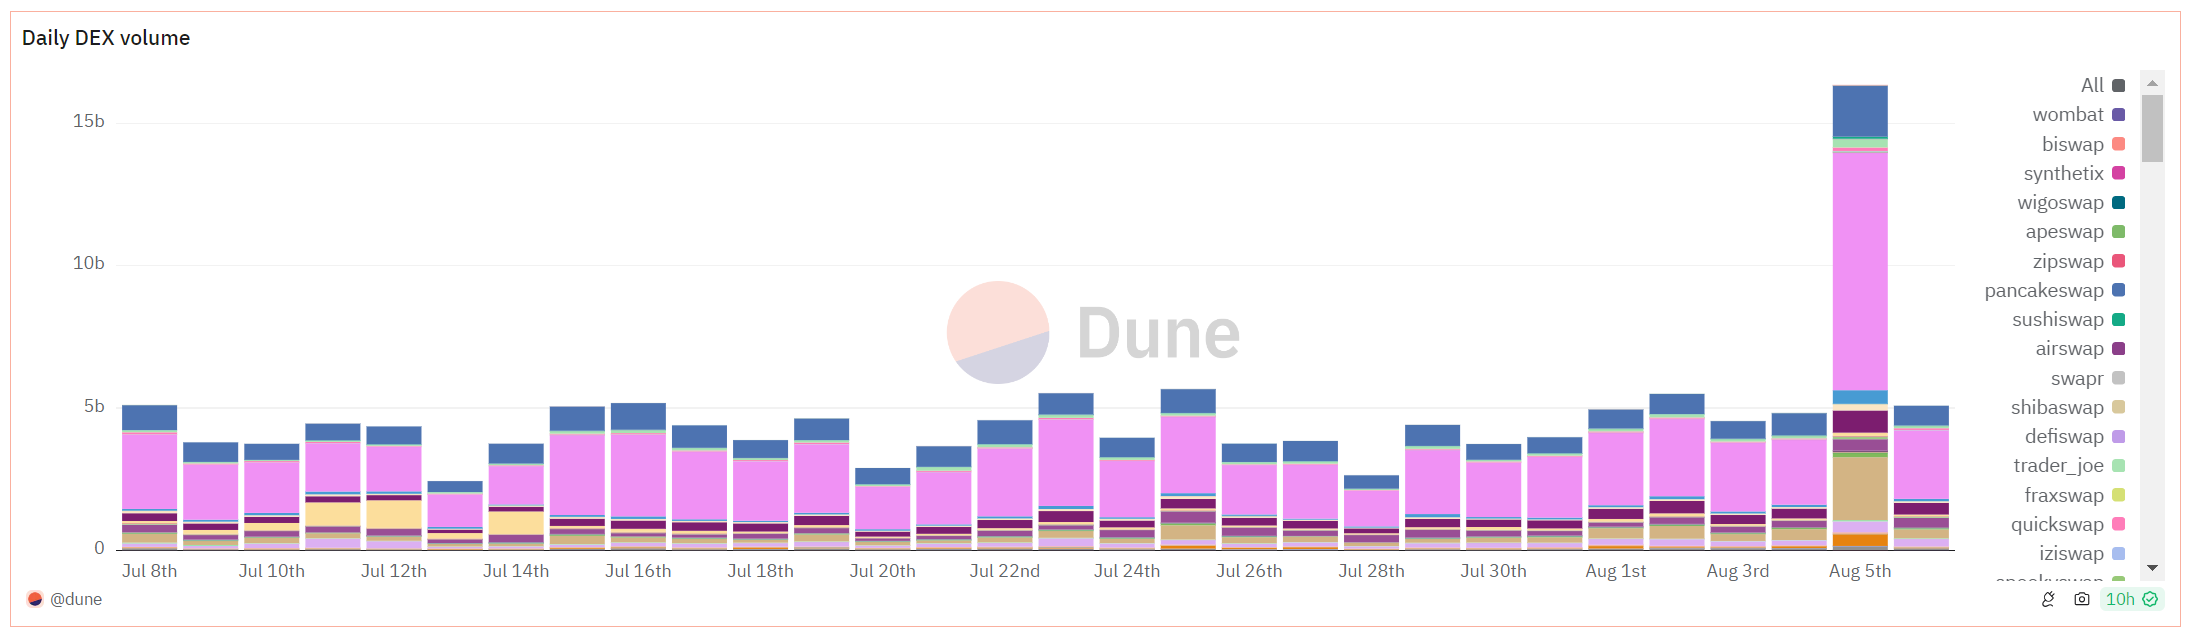
According to Dune Analytics, DEX trading volume exceeded $20.2 billion on August 5—the third-highest on record—showing strong altcoin activity.
IV. Ongoing Influencing Factors
As mentioned in the introduction, risk markets continue to be influenced by several key factors: global recession fears, geopolitical tensions, Bank of Japan rate hikes, and the U.S. election. Markets seem desensitized to ongoing conflicts in Ukraine and the Middle East—recent Iran-Israel, Israel-Palestine, and Hezbollah-Lebanon clashes had limited market impact. The U.S. election remains a key focus. As Arthur Hayes noted, “Whether Trump or Harris wins the next U.S. presidential election doesn’t matter much for crypto. Both Republicans and Democrats will loosen monetary policy—just in different ways—so crypto will rise, though the road may be bumpy.”
-
Fears of Global Recession
The creator of the Sahm Rule believes the current rise in unemployment doesn’t necessarily mean a recession has started: “We’re still in a relatively strong position overall. It’s hard to confirm we’re in a recession.” U.S. economic data currently shows little evidence of slowing. Corporate earnings in Q2 are expected to grow over 10% YoY—showing no signs of weakness.
Goldman Sachs CEO: No Recession Risk in U.S.
Goldman Sachs CEO David Solomon stated, “There is no recession risk in the U.S. The Fed is unlikely to cut rates urgently.” He said July’s jobs report wasn’t bad—just weaker than expected—and views such volatility as potentially healthy. Citigroup also noted that a recession scenario hasn’t been priced in. If a real U.S. recession were coming, the market would likely be reacting far worse than it currently is.
Fed Official: Inflation Down, Labor Market Healthy
Federal Reserve official Austan Goolsbee said inflation has fallen significantly and the labor market remains solid. If the economy deteriorates, the Fed will balance risks and act accordingly. Ahead of the September meeting, he urged patience and waiting for more data.
-
Bank of Japan Rate Hikes and Yen Carry Trade Impact
This week’s Black Monday shocked global risk markets. For years, Japan maintained ultra-low interest rates—even zero rates between 2001 and 2006. Borrowing cheap yen to convert into higher-yielding currencies like USD or EUR and investing abroad became a common arbitrage strategy over the past two decades.
Japan’s persistently weak yen provided ample liquidity for global carry trades, fueling asset bubbles in recipient countries. But the BOJ’s rate hike and balance sheet reduction on July 31 caused the yen to surge, forcing global investors to unwind cheap leverage and sell assets to repay yen debt.
Yen carry trades have supported the global equity bull run. The prolonged U.S. stock rally benefited greatly from the liquidity provided by these trades. Massive yen-funded capital flows into global equities, forex, and commodities have shaped market trends. Bitcoin, too, has benefited from the long-term yen depreciation. Now, as carry trades unwind, capital exits could trigger a global asset price crisis. As financial institutions deleverage, credit tightening becomes inevitable.
The true scale of yen carry trades is hard to track. The Wall Street Journal estimates based on BIS data show Japanese banks’ foreign currency loans totaled $1 trillion as of March. Japan’s net overseas investment reached ¥487 trillion in Q1.
Opinions vary: Citi’s FX analysts believe this adjustment is just beginning. JPMorgan and UBS estimate that about 75% of yen carry positions have been unwound after Monday’s crash and Tuesday’s rebound. Goldman Sachs and Société Générale believe the unwinding is largely complete.
BOJ Governor Ueda later sent dovish signals, pledging not to raise rates during market instability, maintaining current loose policy, and carefully assessing financial market conditions in future decisions.
-
U.S. Election
The U.S. election campaign is intensifying, with Trump and Harris preparing for a final showdown. Harris’s campaign recently raised a record $200 million, surpassing Trump’s $138.7 million in July.
According to the latest Ipsos poll, Harris and Trump are neck-and-neck in voter support, both at 43%. Harris enjoys 70% support among Black voters—up from Biden’s 59%. Trump’s support among Black voters has also risen, from 9% in May-June to 12% in July. Among white voters, Trump’s support grew from 46% to 50%, while Harris rose from 36% to 38%.
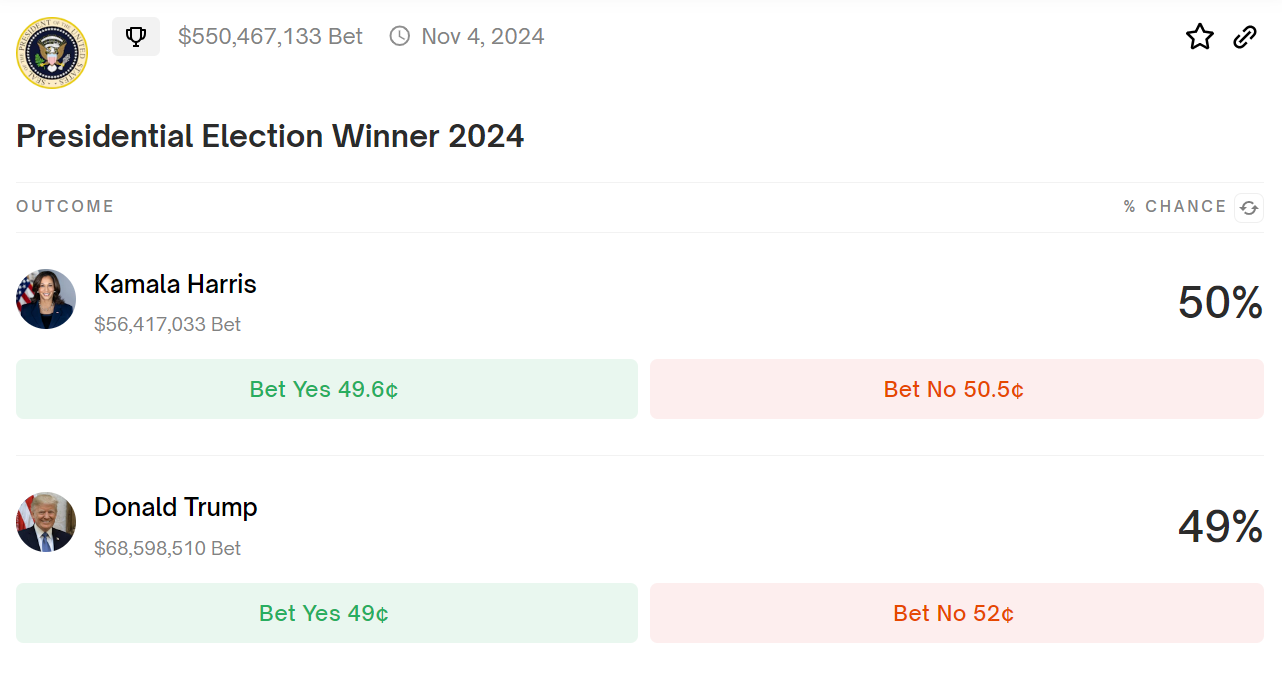
Looking at the crypto prediction market Polymarket, as of August 8, Harris has a 50% chance of winning, slightly ahead of Trump’s 49%.
The U.S. election will likely continue affecting risk market volatility. Regardless of the outcome, as Arthur Hayes said, “Crypto will rise—but the path may be rocky.”
V. Conclusion
The Bank of Japan’s recent shift toward a more moderate, dovish stance reflects its recognition of the severe impact monetary policy can have on risk markets and the broader economy. Abruptly reversing decades of ultra-loose policy inevitably disrupts global markets. Given the rising correlation between the yen and U.S. equities this year, a stronger yen often coincides with weaker U.S. stocks. We must closely monitor BOJ policy. The yen narrative will likely play a crucial role in the recovery of global risk assets in the near term.
BTC is currently in a recovery phase, consolidating after the oversold bounce. Without a decisive resolution in the U.S. election, major moves may be limited, and market healing will take time. Sub-$60,000 Bitcoin remains highly attractive to institutions. Optimistically, a return to a full bull market could occur in Q1 2025, aligning with rate cuts and supportive policy rollouts.
Recent panic-driven sell-offs reflect excessive sensitivity to U.S. economic data releases—possibly misaligned fear. Like many industry analysts, I remain bullish on crypto’s long-term outlook. Let’s stay calm and avoid letting panic dictate investment decisions.
With on-chain DEX volumes hitting new highs and Memecoins surging in popularity, XT Exchange continues focusing on uncovering quality assets, research-driven listings, filtering out risky contracts, and launching trending Memecoins at lightning speed. Buy valuable tokens — visit XT.com.
New users can register via this link:
https://www.xt.com/zh-CN/accounts/register/start?channel=XTlabs
Memecoin enthusiasts are welcome to join our dedicated dog-coin community to catch the next gem early: https://t.me/memetothemars
[Disclaimer] This article is for informational purposes only and does not constitute any investment advice. Investing carries risks; please proceed with caution. Readers should independently evaluate the content and assume full responsibility for their investment decisions.
Join TechFlow official community to stay tuned
Telegram:https://t.me/TechFlowDaily
X (Twitter):https://x.com/TechFlowPost
X (Twitter) EN:https://x.com/BlockFlow_News
 @XTexchange