
The shrinking circle game of global carry trades and its ripple effects
TechFlow Selected TechFlow Selected
The shrinking circle game of global carry trades and its ripple effects
To understand global markets, one must understand carry trades.
 Navigating Web3 tides with focused insights
Author: Fu Peng, Chief Economist at Northeast Securities
Introduction
Ultimately, it's the "gold mine town" logic that has started to break down—this is where core asset issues begin to surface. All previously stable, low-volatility, high-leverage trading chains, whose carry costs could even be ignored, begin to unwind. Nvidia’s decline signals a contraction in the arbitrage asset leg; consequently, the hedging logic for intermediate costs reverses (choosing to hold yen assets while selling yen), and the entire liability side (yen borrowing) begins to contract as well. At this point, the Bank of Japan can use minimal force to push exchange rates back toward interest rate differentials.
To Understand Global Markets, You Must Understand Carry Trades
Carry trades have become a well-known form of capital operation in financial markets. By selecting appropriate funding and investment instruments, investors exploit low volatility to ensure trade stability and maximize profits through interest rate differentials. Some traders may further apply moderate leverage on top of this. Of course, without considering leverage, key factors in evaluating carry lending investments include asset volatility, potential returns, and hedging costs.
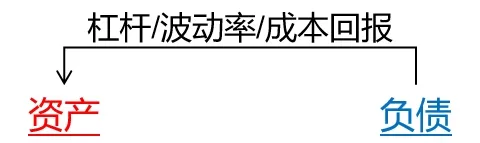
Participating in such trades helps reveal the logic behind global capital flows. Although capital should ideally flow freely across borders, real-world political and geopolitical factors create frictions and barriers. Since 2016, many assets and liabilities have undergone major role reversals, and shifts in global division of labor—especially deglobalization trends—have significantly altered international capital flow dynamics.
The Actual Carry Trade Structure Over the Past Two Years
After the pandemic, sharply higher U.S. interest rates significantly impacted global capital flows. First, although the dollar remains a primary borrowing currency, its rising cost now demands pairing with highly certain, high-leverage, low-volatility assets capable of delivering high returns (in contrast, low-interest dollars encouraged uncertain, high-leverage, high-volatility strategies like Cathie Wood’s Ark Invest). Thus, while high-interest dollar funding continues to be deployed, it no longer goes into speculative plays like Ark-style assets. Instead, assets like Nvidia have emerged as ideal candidates—offering certainty, high leverage, low volatility, and ultimately high returns.
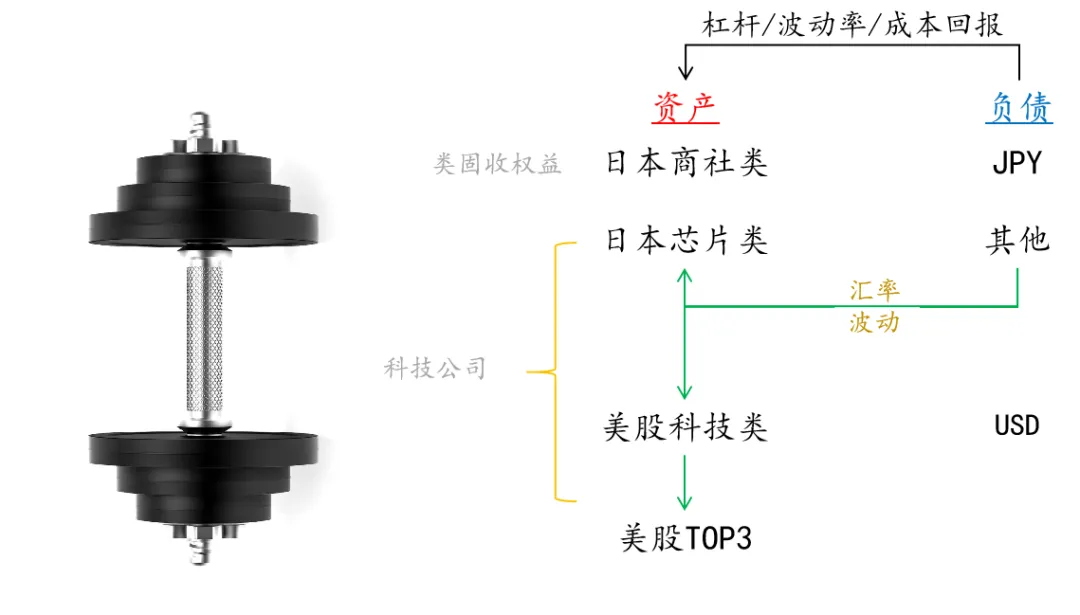
Figure: The barbell structure of global carry trade assets
Source: Fu Peng's Financial World
Second, the yen plays a crucial role as a funding currency alongside the dollar. Due to Japan’s prolonged low-interest-rate policy, the yen has long served as a popular carry funding instrument. For the past three decades, borrowing yen was primarily used to invest outside Japan. However, deep-rooted structural problems within Japan’s domestic economy made investing borrowed yen into Japanese assets unviable.
But as Japan completes its internal economic cycle (domestic income redistribution) and repositions itself in the global division of labor, borrowing yen to invest in yen-denominated assets has become increasingly common in recent years. On a more granular level, corporate governance reforms in Japanese equities have further created dual demand for two types of Japanese assets: large trading companies (sogo shosha), which have become stable, high-dividend cash cows due to improved governance; and Japanese tech stocks, which have turned into growth assets driven by U.S. AI advancements and global reallocation.
Carry funds from yen borrowing mainly flow into these two domestic asset classes. Warren Buffett’s strategy of borrowing yen to buy Japanese sogo shosha exemplifies a classic, highly certain arbitrage play—fully hedging away yen exchange rate risk/reward and focusing purely on the stable cash flows of large Japanese conglomerates.
On the other end of the barbell lies Japanese tech stocks—particularly firms like Tokyo Electron. But it's not just Tokyo Electron; companies including TSMC are essentially shadows of the current U.S. AI boom. These are outer-ring players, while the true core—the nucleus within the nucleus—is Nvidia.
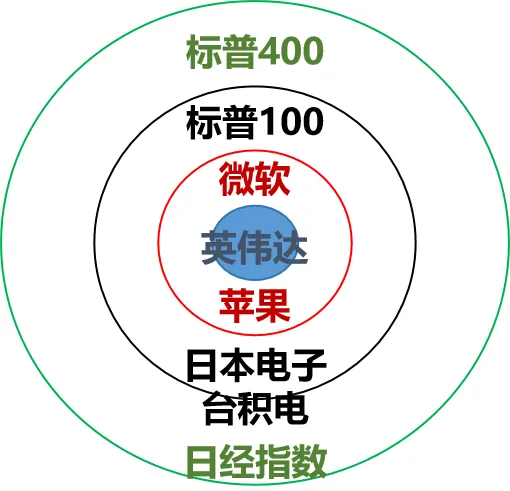
Just as observers note the narrowing concentration in U.S. equity markets—from the ratio of the top 100 vs. bottom 400 in the S&P 500, to the dominance of just three mega-caps over the remaining 97, and finally to Nvidia as the leader among them—capital is increasingly concentrating in the very largest firms. Behind this phenomenon lies record-low volatility in the S&P 500. As I previously emphasized, the scale of options markets around Nvidia illustrates how low volatility, leverage, and high returns have converged—setting the stage for an eventual climax.
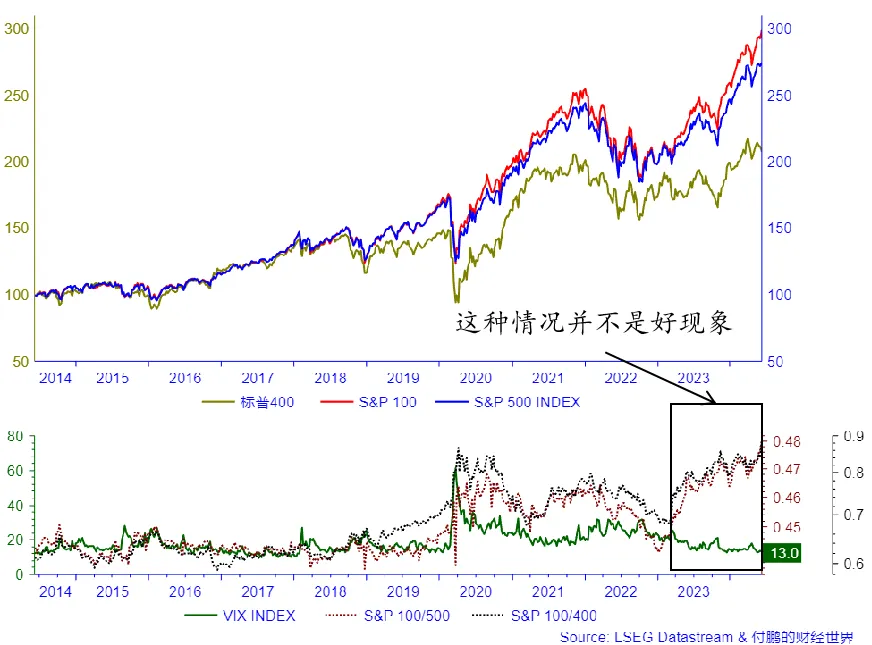
If we expand this narrowing process to include both types of Japanese assets together, we see that Japan—as a peripheral asset—was effectively “wiped out” during the April 2024 consolidation. I’ve noted before that Japanese semiconductor firms should be viewed merely as junior partners or shadows of U.S. tech giants. At this point, the yen exchange rate becomes a critical hedging tool.
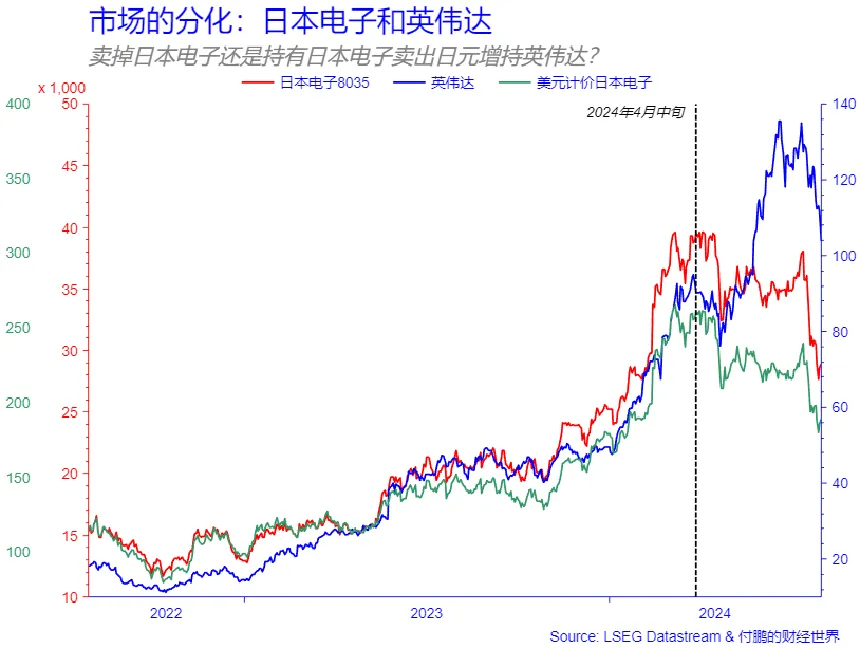
By late April 2024, yen-denominated Japanese chip stocks (e.g., Tokyo Electron) could no longer keep pace with Nvidia-led momentum, just like other U.S. tech names. Capital became increasingly concentrated in top-tier firms like Nvidia. Traders then faced a choice: sell Japanese chip stocks (i.e., sell yen assets), or maintain their carry position but hedge by shorting the yen—continuing to hold yen assets while selling yen outright. This allows dollar-denominated Japanese semiconductor holdings to remain in portfolios without incurring significant losses. Naturally, another group of yen borrowers would also redirect funds toward leading U.S. tech megacaps.
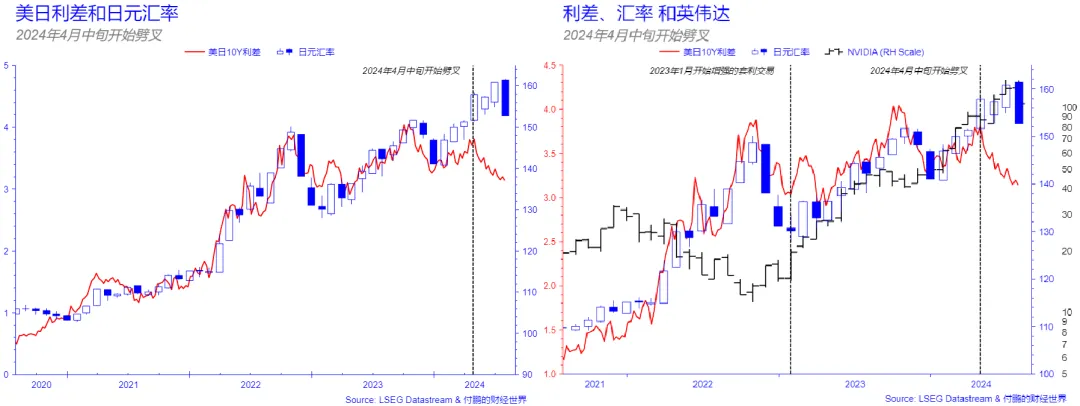
At this stage, exchange rate volatility (driven by yen selling) appears to the Bank of Japan (BOJ) as excessive speculation. But within carry trade portfolios, it functions as a hedge against holding yen assets. Here, exchange rates decouple from traditional interest rate differentials. Losses on the asset side are offset by gains from currency moves—but this puts traders directly at odds with the BOJ. So long as Nvidia keeps rallying, the asset leg remains attractive enough that expected returns outweigh hedging risks and costs, drawing in more arbitrageurs. Hence, despite the BOJ’s first intervention successfully reducing some speculative yen shorts (as seen in CFTC data), without any shift in underlying asset dynamics, the central bank kept burning through its ammunition.
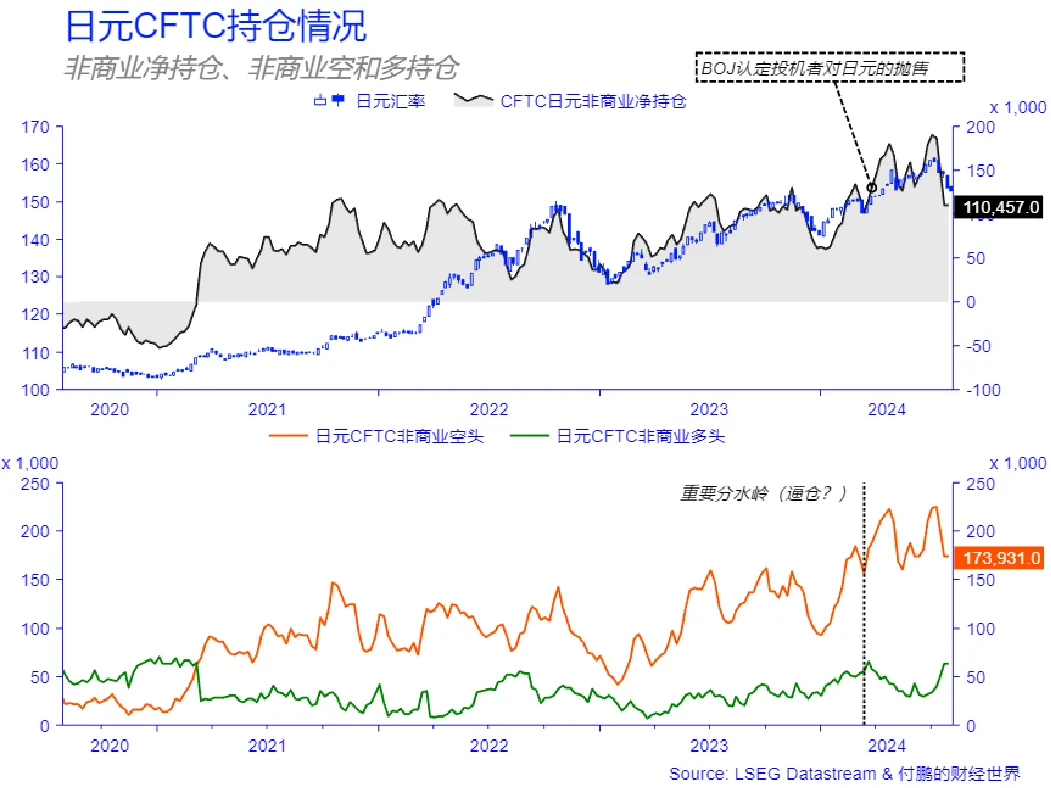
Eventually, the "gold mine town" logic starts to fail—this is when core asset vulnerabilities emerge. All previously stable, low-volatility, high-leverage trading chains, which could even ignore carry costs, begin to unwind. Nvidia’s downturn signals a contraction in the arbitrage asset leg. Consequently, the hedging logic for intermediate costs reverses (opting to hold yen assets while selling yen), and the entire liability side (yen borrowing) begins to shrink. At this juncture, the Bank of Japan can use minimal effort to bring exchange rates back in line with interest rate differentials.
Given the persistent 4% yield gap between Japan and the U.S., exchange rates will inevitably be constrained by interest rate differentials (with a yen fair value around 153). Japanese semiconductor assets are ultimately just shadows of U.S. AI tech equities, making Nvidia the pivotal anchor for the entire yen carry trade complex today.
Under these conditions, the yen remains relatively stable as a funding currency, and the U.S.-Japan yield spread stays largely fixed. If domestic Japanese tech assets offer low volatility and high returns, they can act as mutual hedges with exchange rates, enabling investors to earn stable returns even amid currency fluctuations. But when asset-side arbitrage opportunities become more attractive—with higher expected returns—currency volatility becomes a hedging mechanism that breaks the traditional link to interest rate differentials.
Overall, yen carry trade positioning reflects a dynamic where downside is anchored by funding costs (interest differentials), while upside depends on asset return expectations: below 153, rates dominate; above 153, the market assesses whether asset returns are sufficiently high to justify calculated hedging costs.
RMB: From Carry Asset to Carry Liability
Unnoticed, the RMB has also become part of new global carry trade dynamics. Domestically, China faces overcapacity and insufficient effective aggregate demand, with a shrinking property sector likely worsening supply-demand imbalances. This pushes suppliers to seek overseas markets via exports or corporate globalization, boosting China’s exports and trade surplus. However, this trend may soon provoke backlash in foreign markets, reigniting trade tensions.
Domestic investment returns are expected to fall sharply. Despite accumulating substantial surpluses through exports, low margins and scale dependency mean profits may not repatriate back into RMB. This leads to large volumes of unsettled foreign exchange holdings—funds either held en masse in USD via banking systems or retained offshore through trade mechanisms. This highlights thin profit margins in domestic production. Offshore-held profits may then be reinvested overseas via RMB borrowing, forming a “RMB borrowing–USD asset” carry trade structure. While legal when executed through domestic RMB loans funding QDII vehicles for overseas investments, such activity could trigger tighter scrutiny and quota restrictions on cross-border direct investment.
For funds remaining within China, capital controls limit investment options to domestic assets—low-volatility, low-risk bond-like instruments such as dividend-paying stocks and government bonds—giving rise to domestic carry trade behavior.
A small but growing segment of domestic RMB funds and Chinese corporate activities now reflect a shift from RMB borrowing to USD asset investment. Some may allocate to USD bonds, but larger sums are likely flowing into high-tech sectors like semiconductors and artificial intelligence. This underscores the mismatch between scarce RMB investment returns and strong investor demand, further highlighting the broader reality of deficient effective domestic demand.
Join TechFlow official community to stay tuned
Telegram:https://t.me/TechFlowDaily
X (Twitter):https://x.com/TechFlowPost
X (Twitter) EN:https://x.com/BlockFlow_News