

With altcoins in a continuous downtrend, is it time to refocus on DeFi?
TechFlow Selected TechFlow Selected
With altcoins in a continuous downtrend, is it time to refocus on DeFi?
This article will prioritize analysis of projects with stronger business development, wider moats, and more attractive valuations.
Authors: Alex Xu,Lawrence Lee
Introduction
As one of the oldest sectors in the crypto space, DeFi has underperformed during this bull market cycle. Over the past year, the overall gain of the DeFi sector (41.3%) significantly lagged behind the average market performance (91%) and even fell short of Ethereum's returns (75.8%).
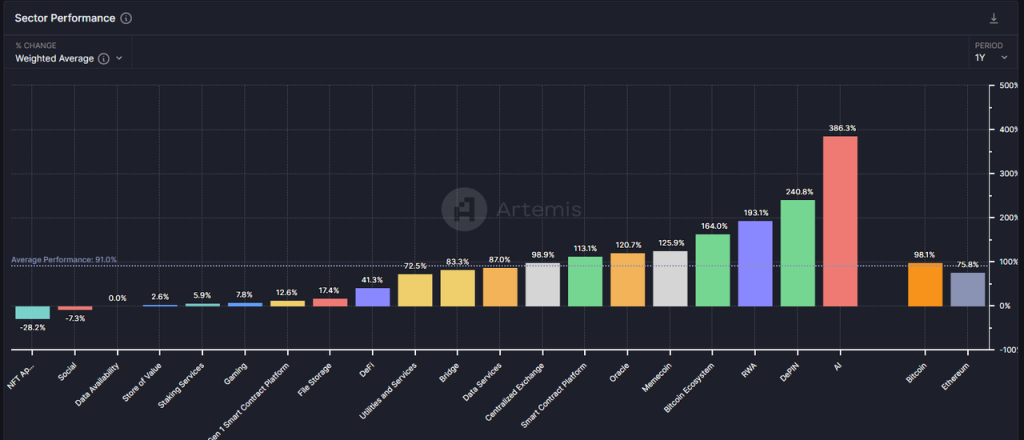
Source: artemis
Looking at 2024 alone, DeFi’s performance remains lackluster, with an overall decline of 11.2%.
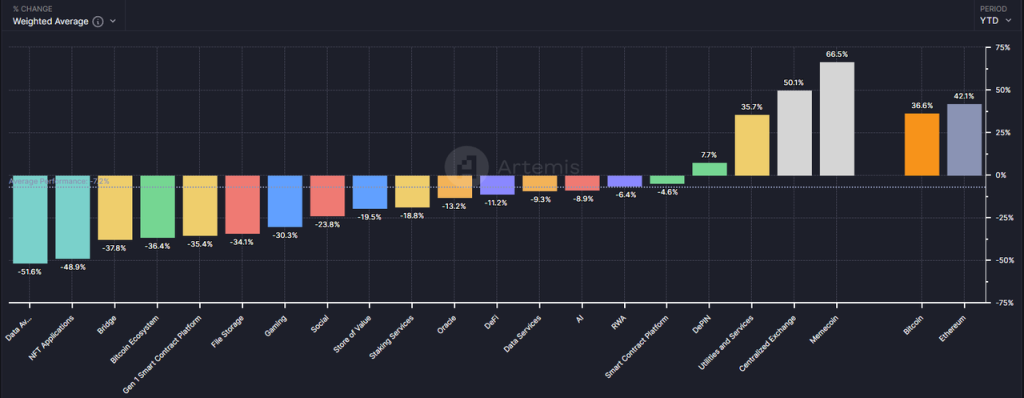
Source: artemis
However, in our view, after Bitcoin briefly hit new highs while altcoins broadly declined, the DeFi sector—particularly its leading projects—may now be entering what could be its best investment window since inception.
Through this article, we aim to clarify our perspective on the current value of DeFi by addressing the following questions:
-
Why have altcoins underperformed Bitcoin and Ethereum this cycle?
-
Why is now the optimal time to focus on DeFi?
-
Which DeFi projects deserve special attention, along with their sources of value and risks?
This article does not cover all potentially valuable DeFi projects in the market. The examples discussed are for analytical purposes only and should not be taken as investment advice.
The views expressed here represent our periodic thinking as of publication and may change in the future. They are highly subjective and may contain factual, data, or logical errors. We welcome criticism and further discussion from peers and readers.
Below is the main body of the article.
The Mystery Behind the Sharp Decline in Altcoin Prices
In our view, the disappointing price performance of altcoins this cycle can be attributed primarily to three internal factors within the crypto industry:
-
Insufficient demand growth: Lack of compelling new business models, with product-market fit (PMF) remaining distant for most sectors
-
Excessive supply growth: Continued infrastructure development has lowered startup barriers, resulting in an oversupply of new projects
-
Ongoing token unlocks: Continuous vesting of tokens from low-circulating-supply, high-FDV projects creates persistent selling pressure
Let us examine each of these factors in more detail.
Weak Demand Growth: A Bull Market Without Innovative Narratives
In an article published in early March titled "Preparing for the Primary Wave: My Periodic Strategy on This Bull Market Cycle", we noted that this bull run lacks commercial innovation and narratives comparable to DeFi in 2021 or ICOs in 2017. Therefore, our strategy recommended overweighting BTC and ETH (benefiting from ETF-driven capital inflows) and maintaining a controlled allocation to altcoins.
So far, this outlook has proven accurate.
The absence of new commercial stories has led to significantly reduced inflows of entrepreneurs, institutional investors, users, and capital. More critically, this situation has dampened investor expectations for the industry's long-term development. Without fresh narratives like “DeFi will eat traditional finance,” “ICOs are a new paradigm for innovation and fundraising,” or “NFTs disrupt content ecosystems,” investors naturally vote with their feet and migrate toward areas with stronger stories—such as AI.
That said, we do not endorse overly pessimistic views. Despite the lack of groundbreaking innovations, infrastructure continues to improve:
-
Blockspace costs have dropped sharply across both L1s and L2s
-
Cross-chain communication solutions are maturing, with a wide range of options available
-
User-friendly wallet experiences have improved—for example, Coinbase’s smart wallet enables keyless quick setup and recovery, direct access to CEX balances, and gasless transactions, bringing users closer to Web2-like convenience
-
Solana’s Actions and Blinks features allow on-chain interactions to be embedded anywhere on the internet, dramatically shortening user onboarding paths
These infrastructural developments are akin to utilities and roads in the real world—they are not innovations themselves but fertile ground where innovation can emerge.
Excessive Supply Growth: Project Proliferation + Ongoing High-Market-Cap Token Unlocks
From another angle, although many altcoins have reached new yearly lows, the total market cap of altcoins hasn’t declined drastically relative to Bitcoin.
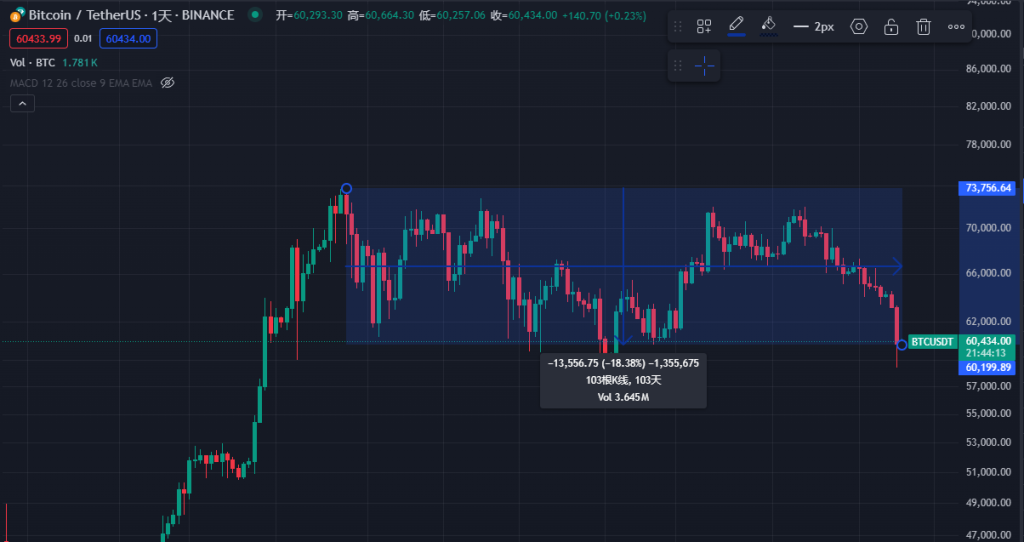
Data: TradingView, 2024.6.25
As of now, Bitcoin’s price has fallen approximately 18.4% from its peak, while the total market cap of altcoins (shown as Total3 in TradingView, representing total crypto market cap minus BTC and ETH) has declined only 25.5%.
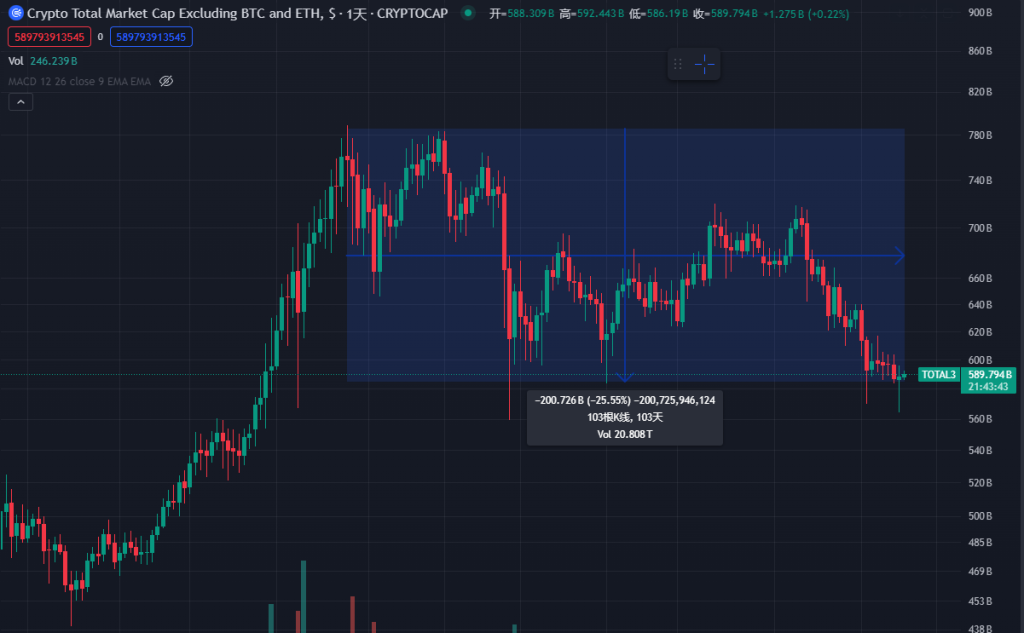
Data: TradingView, 2024.6.25
The limited drop in total altcoin market cap occurred against a backdrop of massive expansion in both the number and market value of new altcoins. As shown below, the increase in token issuance this bull market is the fastest in history.
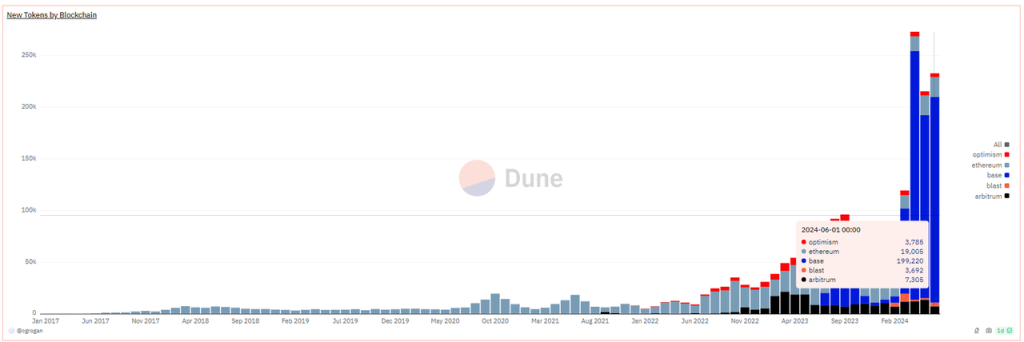
New Tokens by Blockchain, Source: https://dune.com/queries/3729319/6272382
Note that the above data only includes EVM chain token issuances, over 90% of which occurred on Base. In reality, Solana contributed even more new tokens. Most newly issued tokens on both Solana and Base are memecoins.
Notable high-market-cap memecoins that emerged this cycle include:
dogwifhat: $2.04 billion
Brett: $1.66 billion
Notcoin: $1.61 billion
DOG•GO•TO•THE•MOON: $630 million
Mog Coin: $560 million
Popcat: $470 million
Maga: $410 million
Beyond memecoins, numerous infrastructure tokens are launching or preparing for listing this year, including:
Layer 2 networks:
-
Starknet: Circulating market cap $930 million, FDV $7.17 billion
-
ZKsync: Circulating market cap $610 million, FDV $3.51 billion
-
Manta Network: Circulating market cap $330 million, FDV $1.02 billion
-
Taiko: Circulating market cap $120 million, FDV $1.9 billion
-
Blast: Circulating market cap $480 million, FDV $2.81 billion
Cross-chain communication services:
-
Wormhole: Circulating market cap $630 million, FDV $3.48 billion
-
LayerZero: Circulating market cap $680 million, FDV $2.73 billion
-
Zetachain: Circulating market cap $230 million, FDV $1.78 billion
-
Omni Network: Circulating market cap $147 million, FDV $1.42 billion
Modular blockchain platforms:
-
Altlayer: Circulating market cap $290 million, FDV $1.87 billion
-
Dymension: Circulating market cap $300 million, FDV $1.59 billion
-
Saga: Circulating market cap $140 million, FDV $1.5 billion
*All market cap data sourced from Coingecko as of 2024.6.28
Additionally, many listed tokens face massive upcoming unlocks. These projects commonly feature low circulating supply ratios, high FDVs, prior institutional funding rounds, and very low token acquisition costs for early investors.
Combined weak demand and narrative fatigue with excessive asset supply marks a first in the crypto cycle. Although project teams attempted to maintain valuations by reducing initial circulating supply ratios (from 41.2% in 2022 to 12.3%), the convergence of these forces ultimately drove down the valuation floor across most crypto projects. So far in 2024, only a few sectors—including Memes, CEXs, and DePIN—have maintained positive returns.
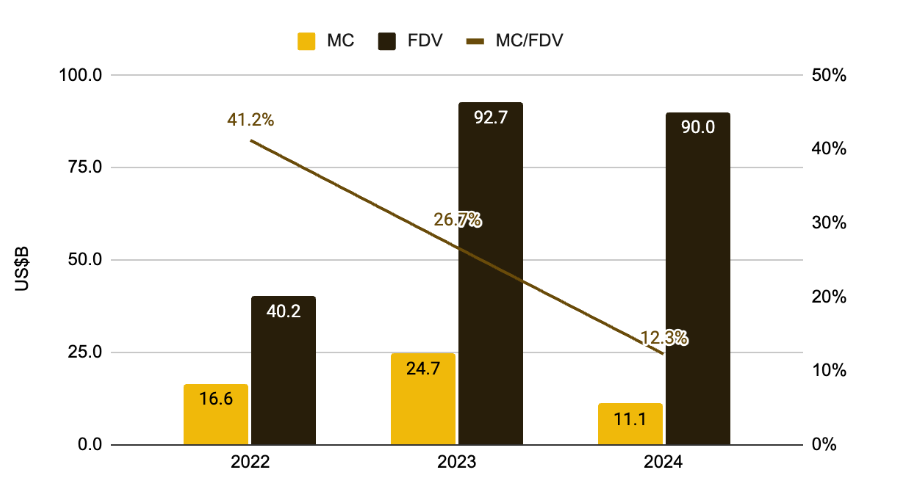
Ratio between new coin market cap and FDV. Image source: "Low Float & High FDV: How Did We Get Here?", Binance Research
In our view, the collapse in valuations of high-market-cap VC-backed tokens reflects the market’s rational response to various crypto anomalies:
-
Mass production of ghost-town rollups with TVL and bots but no real users
-
Repackaging old ideas to raise funds while offering nearly identical solutions—e.g., numerous cross-chain communication protocols
-
Building around trends rather than actual user needs—e.g., countless AI+Web3 projects
-
Persistent failure—or complete disregard—for identifying sustainable revenue models and token value accrual
The devaluation of these altcoins represents a healthy market correction—an act of self-healing through capital flight and market cleansing.
In reality, most VC-backed tokens aren't worthless—they were simply overvalued. The market has now reset them to fair levels.
Now Is the Time to Focus on DeFi: PMF Achieved, Emerging from the Bubble Phase
Since 2020, DeFi has formally become a distinct category among altcoins. During the first half of 2021, DeFi projects dominated the top 100 crypto market cap rankings, proliferating rapidly with ambitions to recreate every traditional financial business model on-chain.
At that time, DeFi was the foundational infrastructure for blockchains. DEXs, lending, stablecoins, and derivatives formed the essential “four-piece toolkit” for any new blockchain launch.
However, as homogeneous projects flooded the market, widespread hacks (including insider attacks), and Ponzi-style TVL models relying on circular incentives quickly collapsed, sending once-skyrocketing token prices spiraling downward.
Entering this bull cycle, most surviving DeFi projects have delivered disappointing price performance, and venture investment into DeFi has dwindled. As always at the beginning of a new cycle, investors favor novel narratives—and DeFi doesn’t qualify.
Yet precisely because of this, DeFi projects that have weathered the storm now appear more attractive compared to other altcoins. Specifically:
-
Business side: Mature business and revenue models; leading projects possess moats
DEXs and derivatives earn trading fees, lending protocols collect interest spreads, stablecoin projects charge stability fees, and staking services take a cut of staking rewards—revenue models are clear. Leading projects in each category serve organic user demand, have largely moved beyond subsidy phases, and some generate positive cash flow even after accounting for token emissions.
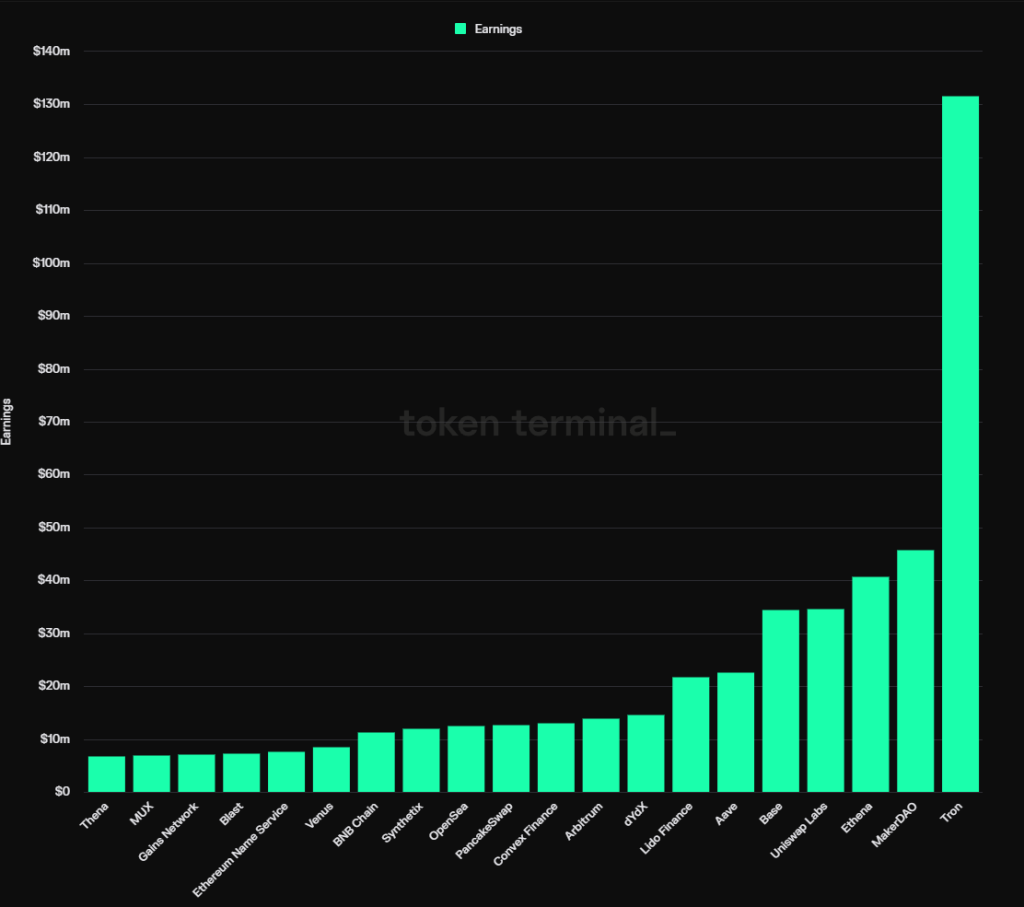
Top Crypto Projects by Profit, Source: Tokenterminal
According to Tokenterminal data, 12 of the top 20 highest-profit protocols in 2024 are DeFi projects, categorized as follows:
Stablecoins: MakerDAO, Ethena
Lending: Aave, Venus
Staking: Lido
DEXs: Uniswap Labs, Pancakeswap, Thena (revenue from front-end fees)
Derivatives: dYdX, Synthetix, MUX
Yield aggregators: Convex Finance
These projects enjoy diverse competitive advantages—some from multi-sided or two-sided network effects, others from user habits and brand recognition, and still others from unique ecosystem resources. But collectively, leading DeFi projects share common traits: market share stabilizing, fewer new competitors emerging, and some degree of pricing power.
We’ll delve deeper into specific project moats in the next section.
-
Supply side: Low emissions, high circulation ratios, minimal upcoming unlocks
As discussed earlier, one major reason for the ongoing devaluation of altcoins is excessive token emissions and the negative sentiment caused by massive token unlocks.
Leading DeFi projects, having launched earlier, have mostly passed their peak emission periods. Institutional tokens are largely fully released, leaving minimal future selling pressure. For example, Aave currently has a 91% circulation ratio, Lido 89%, Uniswap 75.3%, MakerDAO 95%, and Convex 81.9%.
This indicates not only low future sell-side pressure but also that gaining control of these projects would require purchasing tokens directly from the open market.
-
Valuation side: Market attention and operational metrics diverge, valuations at historical lows
Compared to new narratives like Memes, AI, DePIN, Restaking, and Rollup-as-a-service, DeFi has received little attention this cycle and delivered mediocre price performance. However, core business metrics of leading DeFi projects—such as trading volume, loan size, and profit levels—continue to grow steadily, creating a divergence between price and fundamentals. This has pushed valuations of several top DeFi projects to historic lows.
Take lending protocol Aave: Its quarterly net income has surpassed previous cycle highs and hit record levels, yet its PS ratio (circulating market cap / annualized revenue) is at an all-time low of just 17.4x.
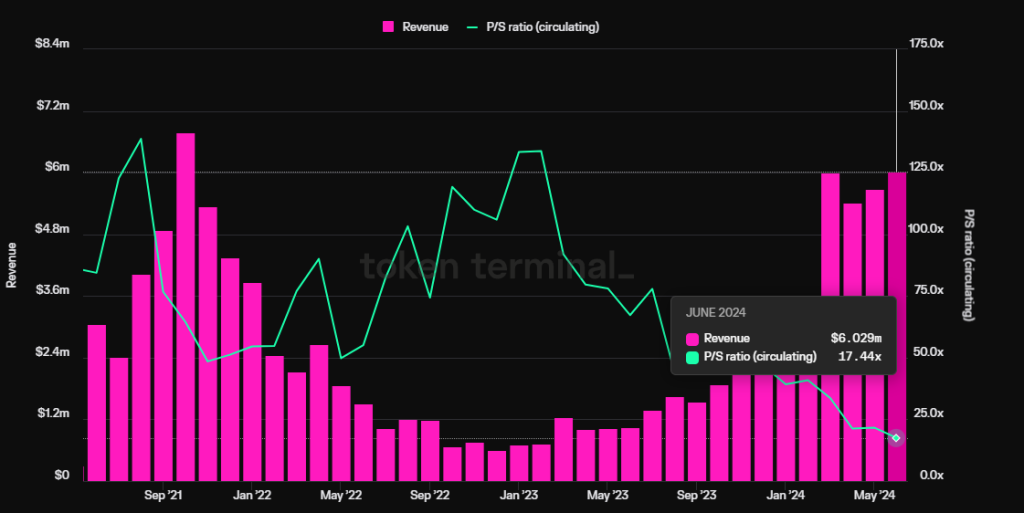
Source: Tokenterminal
-
Regulatory side: FIT21 bill favors DeFi compliance and could trigger potential M&A activity
FIT21—the Financial Innovation and Technology for the 21st Century Act—aims to establish a clear federal regulatory framework for digital assets, strengthen consumer protection, and bolster U.S. leadership in the global digital asset market. First introduced in May 2023, it passed the House with strong bipartisan support on May 22, 2024. By clarifying regulations and participant rules, the bill will make it easier for both startups and traditional financial institutions to invest in DeFi. Given Wall Street giants like BlackRock increasingly embracing crypto—pushing ETF approvals and issuing U.S. Treasury tokens on Ethereum—DeFi is likely to be a key area of focus in coming years. For traditional financial players, acquisitions may be the easiest entry route. Any such move—even merger speculation—could trigger significant revaluation of leading DeFi projects.
Next, we analyze select DeFi projects to assess their operations, moats, and valuations.
Given the vast number of DeFi projects, we prioritize those with strong operations, wide moats, and more attractive valuations.
Notable DeFi Projects Worth Watching
1. Lending: Aave
Aave is one of the longest-standing DeFi projects. After raising funds in 2017, it transitioned from peer-to-peer lending (originally named Lend) to a pool-based model and surpassed rival Compound in the last bull cycle. Today, Aave leads the lending sector in both market share and market cap.
Aave’s primary revenue comes from interest rate spreads on loans. Additionally, it launched its own stablecoin, GHO, last year, which generates additional yield. However, managing GHO incurs new costs, including marketing and liquidity incentives.
1.1 Business Overview
For lending protocols, the most critical metric is active loan volume—the primary source of revenue.
The chart below shows Aave’s market share of active loans over the past year. Over the last six months, Aave’s share has steadily increased, reaching 61.1%. The actual figure is even higher, as the chart double-counts Morpho’s optimized lending pools built atop Aave and Compound.
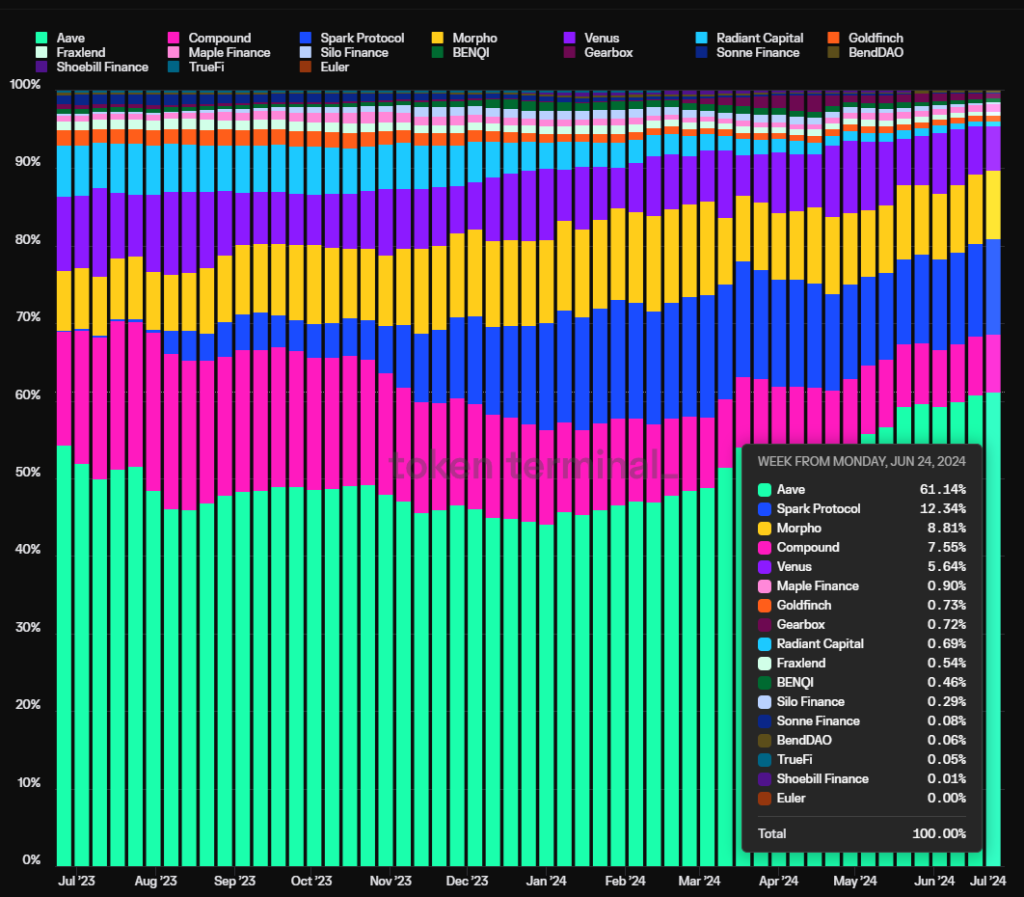
Source: Tokenterminal
Another key metric is profitability—i.e., net income. In this analysis, profit = protocol revenue – token incentives. As shown below, Aave has pulled far ahead of other lending protocols and exited the Ponzi-like phase of subsidizing growth via token emissions (represented by Radiant, purple line).
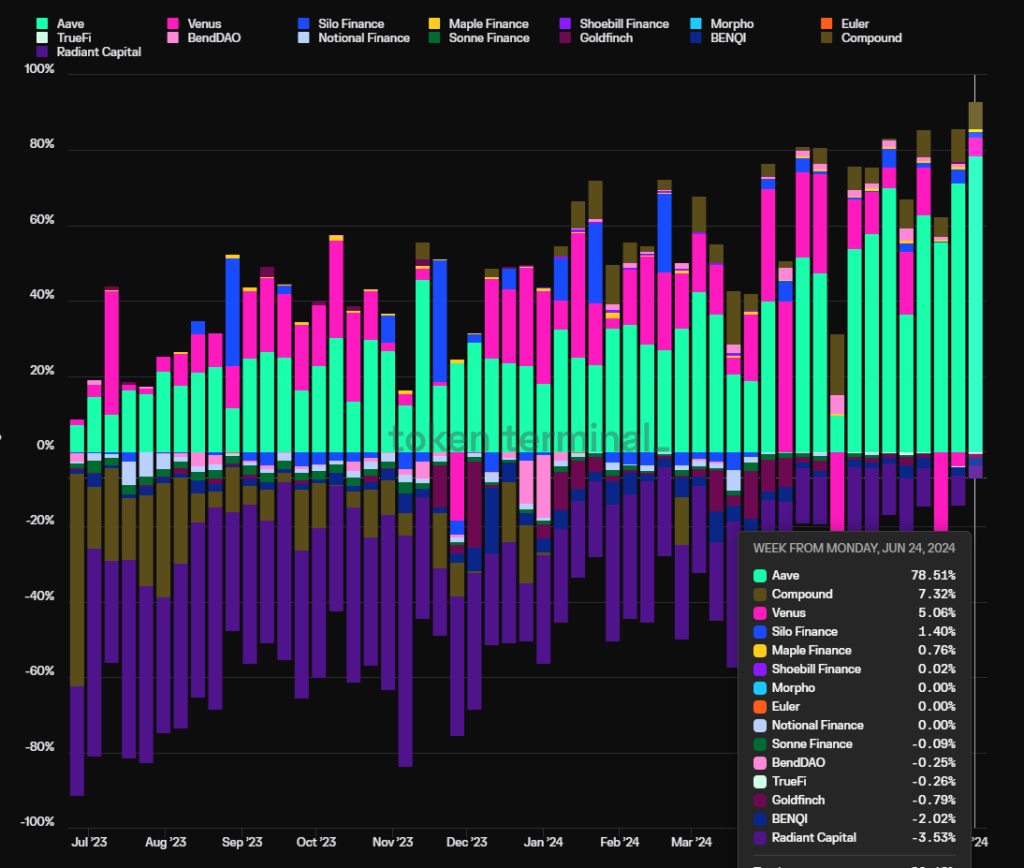
Source: Tokenterminal
1.2 Competitive Advantages
Aave’s moat consists of four key elements:
1. Accumulated security credibility: Most new lending protocols suffer security incidents within their first year. Aave, however, has operated without a single smart contract-level incident. This track record of safe, uninterrupted operation is often the top consideration for DeFi users—especially large whales. Notably, Justin Sun is a long-time Aave user.
2. Two-sided network effects: Like many internet platforms, DeFi lending is a classic two-sided market. Depositors and borrowers feed each other’s growth. Larger deposit or loan volumes attract more participants on the opposite side, making it harder for newcomers to catch up. Moreover, greater platform liquidity ensures smoother entry and exit for large traders, who then further fuel growth.
3. Strong DAO governance: Aave is fully managed by its DAO. Compared to team-centric models, DAO governance enables greater transparency and community participation in key decisions. Aave’s DAO includes a diverse set of sophisticated participants—top VCs, university blockchain clubs, market makers, risk management firms, third-party developers, and financial advisors—all actively engaged. Aave’s success in overtaking Compound—a pioneer in pool-based lending—was driven in large part by effective DAO governance balancing innovation and safety.
4. Multi-chain ecosystem positioning: Aave is deployed across nearly all major EVM L1/L2 chains and consistently ranks among the top in TVL. With the upcoming Aave V4, it will unify liquidity across chains, amplifying its cross-chain advantage. See chart below:
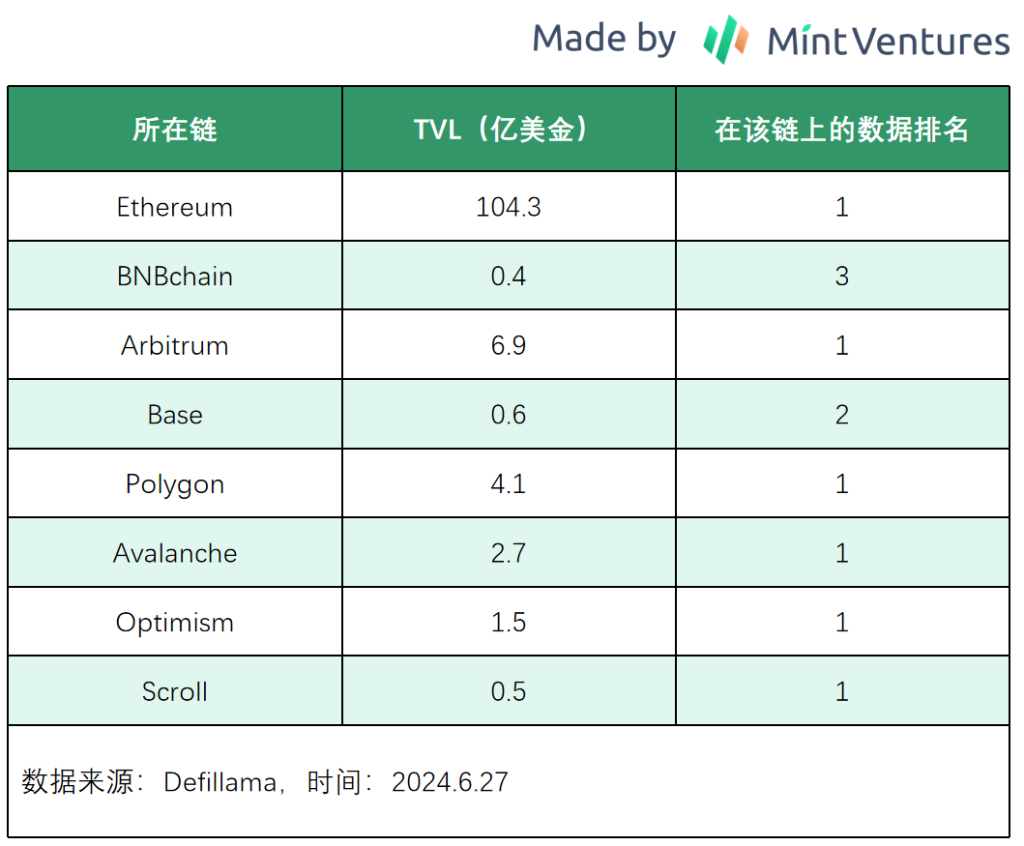
Beyond EVM chains, Aave is evaluating deployment on Solana and Aptos, indicating potential future expansion.
1.3 Valuation
According to Tokenterminal, Aave’s PS (circulating market cap / annualized revenue) and PF (circulating market cap / protocol fees) ratios have reached all-time lows due to recovering fees and stagnant token price—currently 17.44x and 3.1x respectively.
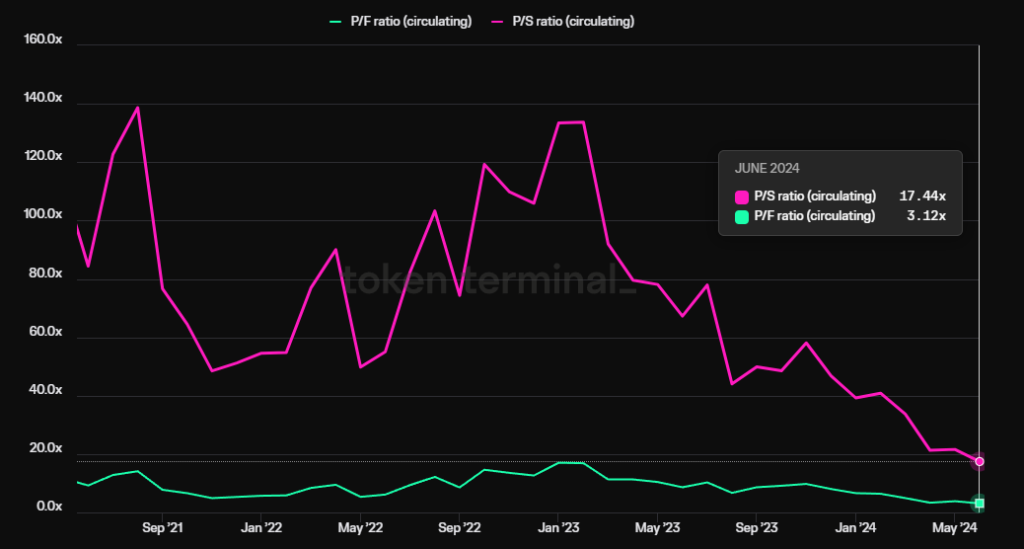
Source: Tokenterminal
1.4 Risks and Challenges
While Aave continues to gain market share, a notable competitor is emerging: Morpho Blue, a modular lending platform. Morpho Blue provides third parties with a customizable protocol stack, allowing them to define collateral types, borrowable assets, oracles, and risk parameters to create tailored lending markets.
This modularity enables more participants to enter the lending space. For instance, Gauntlet, formerly Aave’s risk provider, chose to terminate its relationship with Aave to launch its own market on Morpho Blue.
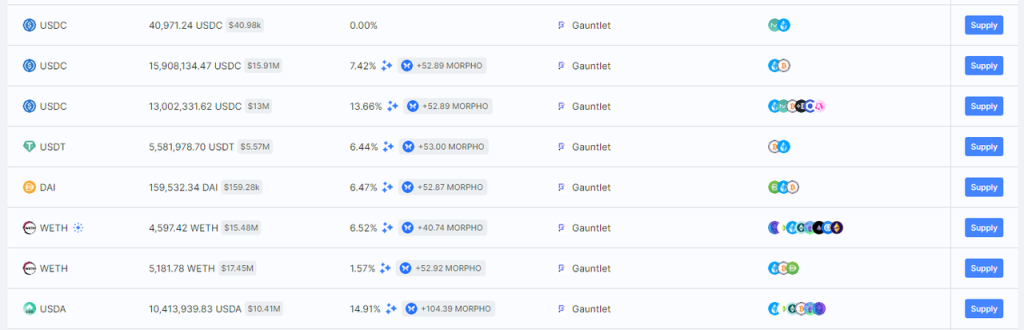
Source: https://app.morpho.org/?network=mainnet
Source: https://morpho.blockanalitica.com/
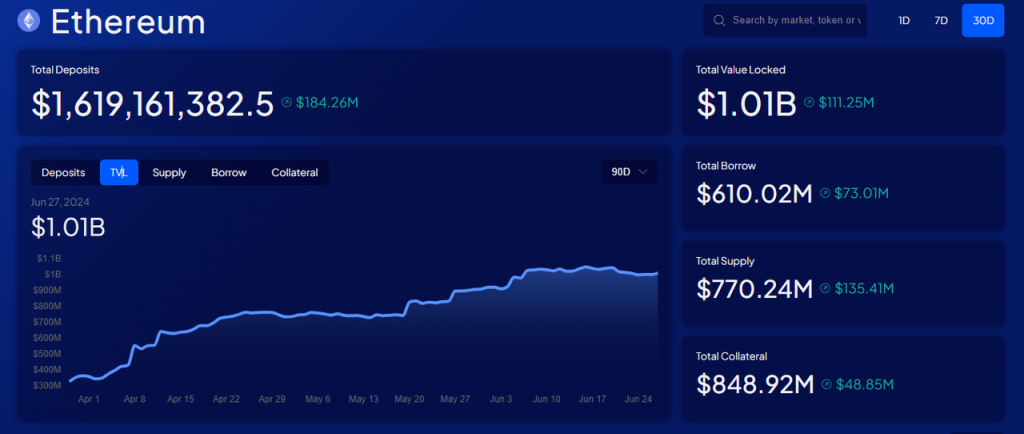
Launched over six months ago, Morpho Blue has grown rapidly and is now the fourth-largest lending platform by TVL, trailing only Aave, Spark (MakerDAO’s Aave v3 fork), and Compound.
Its growth on Base has been particularly explosive—just two months after launch, TVL reached $27 million, compared to Aave’s ~$59 million on Base.
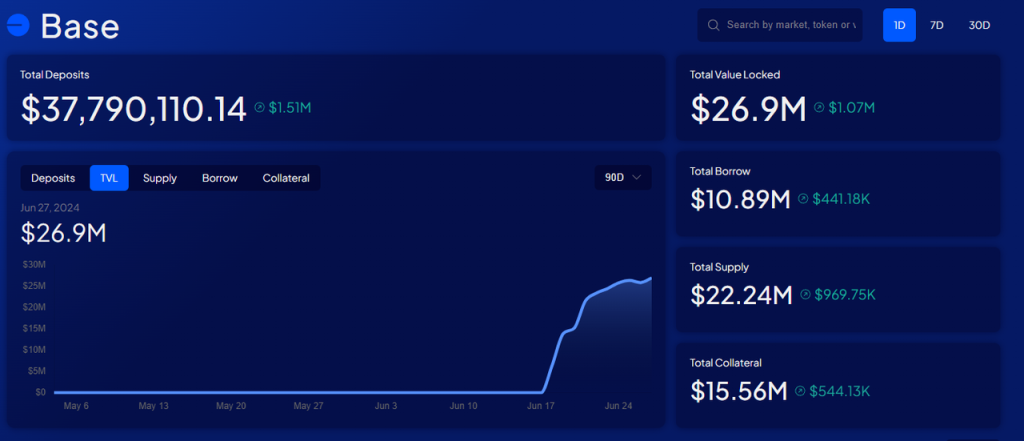
Source: https://morpho.blockanalitica.com/
2. DEXs: Uniswap & Raydium
Uniswap and Raydium belong to the Ethereum-aligned EVM ecosystem and the Solana ecosystem, respectively. Uniswap launched its V1 version on Ethereum in 2018, but truly gained prominence with the V2 release in May 2020. Raydium launched on Solana in 2021.
We highlight both because they represent the two largest Web3 ecosystems today: Ethereum’s EVM ecosystem and the rapidly growing Solana ecosystem. Each has distinct strengths and weaknesses, which we analyze separately below.
2.1 Uniswap
2.1.1 Business Overview
Since the launch of Uniswap V2, it has almost consistently held the largest trading volume share among DEXs on Ethereum and most EVM chains. We focus on two key metrics: trading volume and fees.
The chart below shows Uniswap’s monthly DEX trading volume share since V2 launch (excluding non-EVM DEXs):
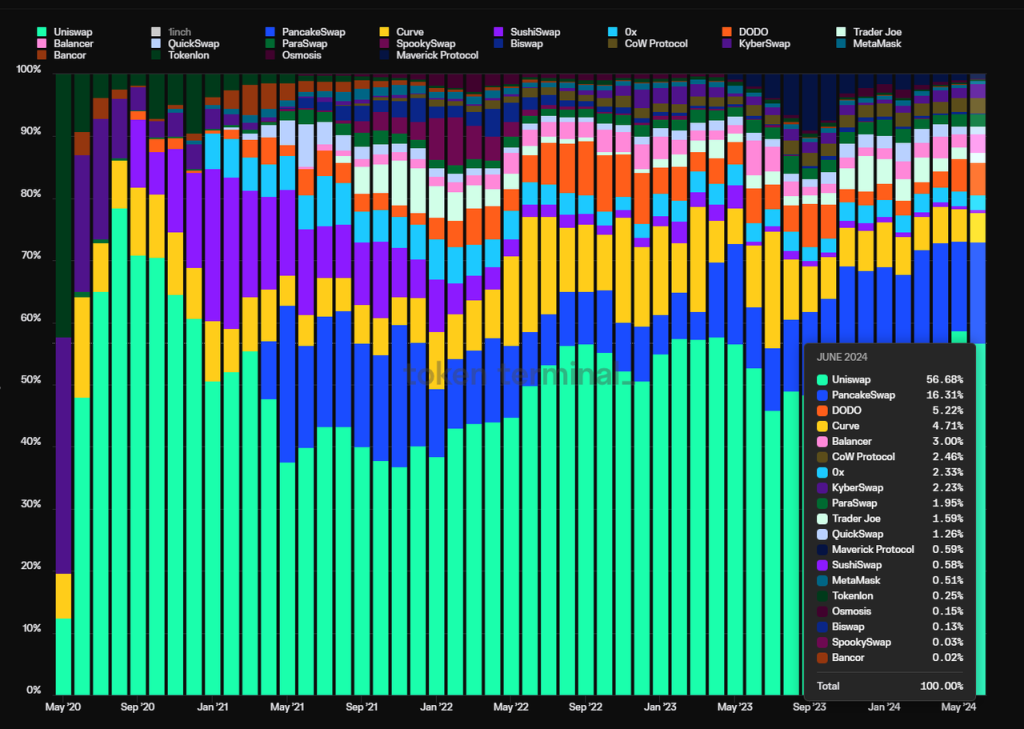
Source: Tokenterminal
From May 2020 to August 2020, Uniswap’s market share peaked at 78.4%, dipped to 36.8% in November 2021 during the height of DEX competition, and has since rebounded to 56.7%—proving its resilience and solidified position.
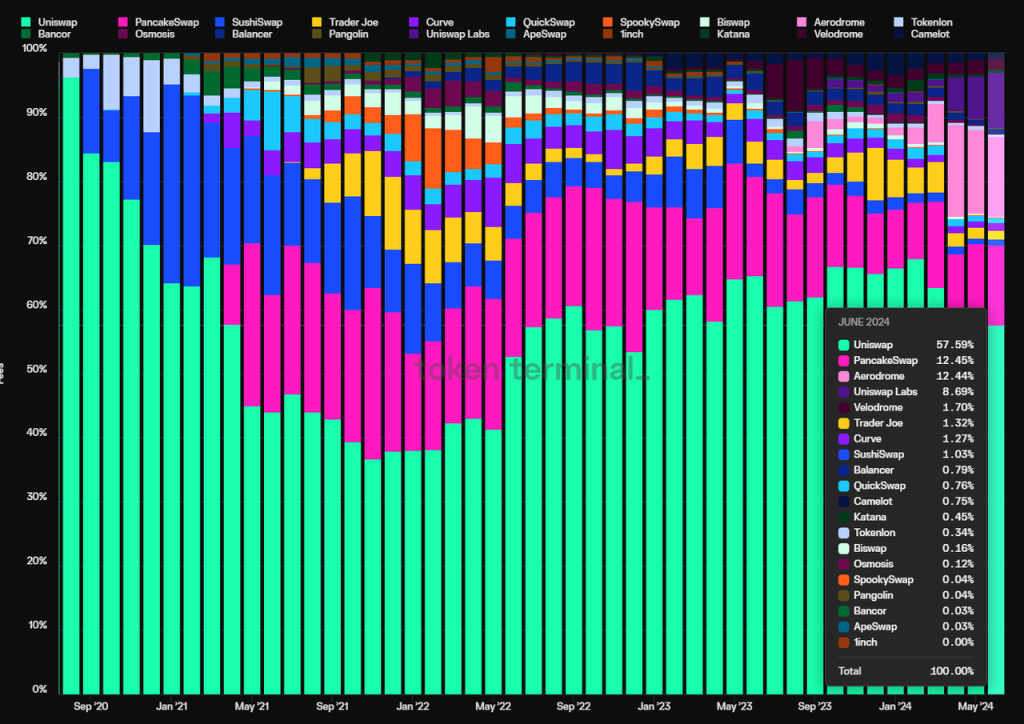
Source: Tokenterminal
Uniswap’s fee share follows a similar trend—bottoming at 36.7% in November 2021 and rising to 57.6% today.
Remarkably, aside from brief liquidity incentives on Ethereum (2020) and OP Mainnet (late 2022), Uniswap has never subsidized liquidity. Most other DEXs continue to rely heavily on such subsidies.
The chart below shows monthly incentive amounts across major DEXs. Projects like Sushiswap, Curve, Pancakeswap, and Base’s ve(3,3) platform Aerodrome have spent the most on incentives—but none have captured more market share than Uniswap.
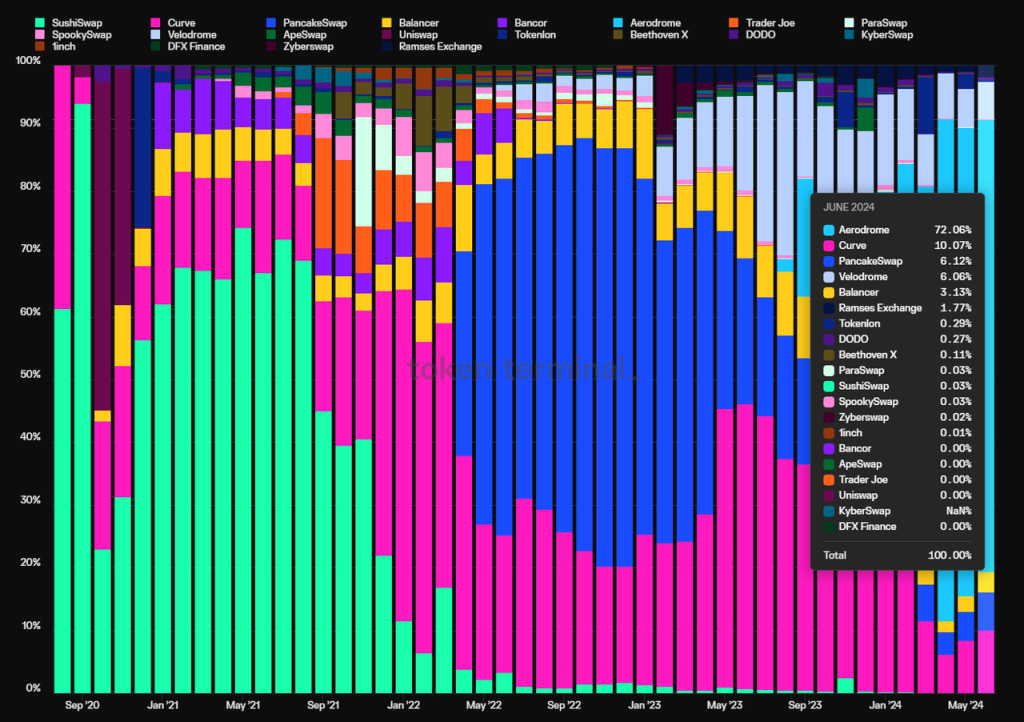
Source: Tokenterminal
However, Uniswap’s biggest criticism remains: despite zero token emissions, it captures no value at the protocol level—the fee switch remains off.
That said, in late February 2024, Uniswap developer and Foundation governance lead Erin Koen proposed upgrading the protocol to reward authorized UNI holders. The proposal sparked extensive debate. Originally scheduled for a formal vote on May 31, it has since been delayed. Nonetheless, this marks the first step toward enabling fee collection. The upgraded contracts have already been developed and audited. In the foreseeable future, Uniswap will begin generating standalone protocol revenue.
Moreover, Uniswap Labs began charging a 0.15% fee in October 2023 for users trading via its official frontend or Uniswap Wallet. This applies to ETH, USDC, WETH, USDT, DAI, WBTC, agEUR, GUSD, LUSD, EUROC, XSGD—but excludes stablecoin trades and WETH/ETH swaps.
Frontend fees alone have made Uniswap Labs one of the highest-revenue teams in Web3.
Once the protocol-level fee switch activates, based on H1 2024 fee projections, Uniswap’s annualized fees could reach ~$1.13 billion. At a 10% fee share, protocol revenue would be ~$113 million annually.
With Uniswap X and V4 launching later this year, the protocol is poised to further expand its trading volume and fee dominance.
2.1.2 Competitive Advantages
Uniswap’s moat stems from three main aspects:
1. User habit: When Uniswap first introduced frontend fees, many believed users would quickly migrate to aggregators like 1inch to avoid the extra cost. Yet, frontend revenue has continued rising—its growth rate even outpacing the overall protocol fee growth.
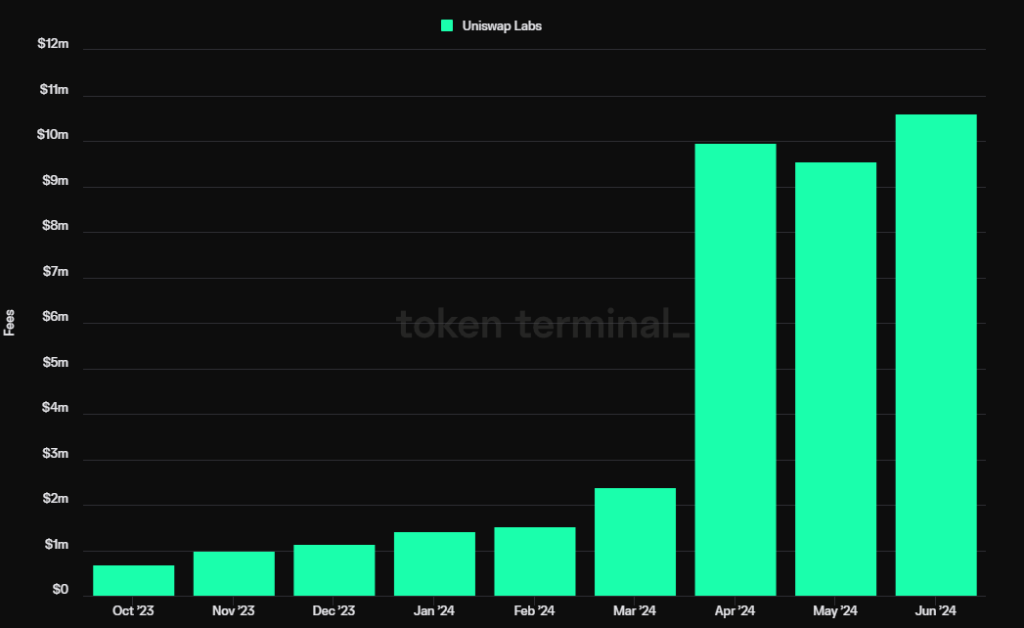
Source: Tokenterminal
This strongly demonstrates the
Join TechFlow official community to stay tuned
Telegram:https://t.me/TechFlowDaily
X (Twitter):https://x.com/TechFlowPost
X (Twitter) EN:https://x.com/BlockFlow_News


