
Coinbase: Letting the Data Speak — The Rise of Its Market Position in the United States
TechFlow Selected TechFlow Selected
Coinbase: Letting the Data Speak — The Rise of Its Market Position in the United States
After the approval of spot Bitcoin ETFs, the impact of the New York trading session on price volatility and trading volume has become more pronounced.
 Navigating Web3 tides with focused insights
Author: David Han, Institutional Research Analyst
Translation: DAOSquare
Overview
-
Following the approval of spot Bitcoin ETFs in the U.S., the impact of New York trading hours on price volatility and trading volume has become more pronounced.
-
While stablecoin usage appears more evenly distributed across European and U.S. daytime hours, on-chain trading volumes and fee distributions are more skewed toward U.S. time zones.
-
We believe this activity skew highlights substantial U.S. demand for crypto and the potential for further industry growth and capital inflows.
Although crypto is a global industry, trading volumes during U.S. market hours (and late European hours) have a significant impact on market liquidity and price volatility. This was true even before the approval of U.S. spot Bitcoin ETFs, and has since become more evident—particularly on centralized exchange (CEX) platforms. Increased trading volume has also translated into greater price volatility and wider daily price swings during U.S. and European trading sessions.
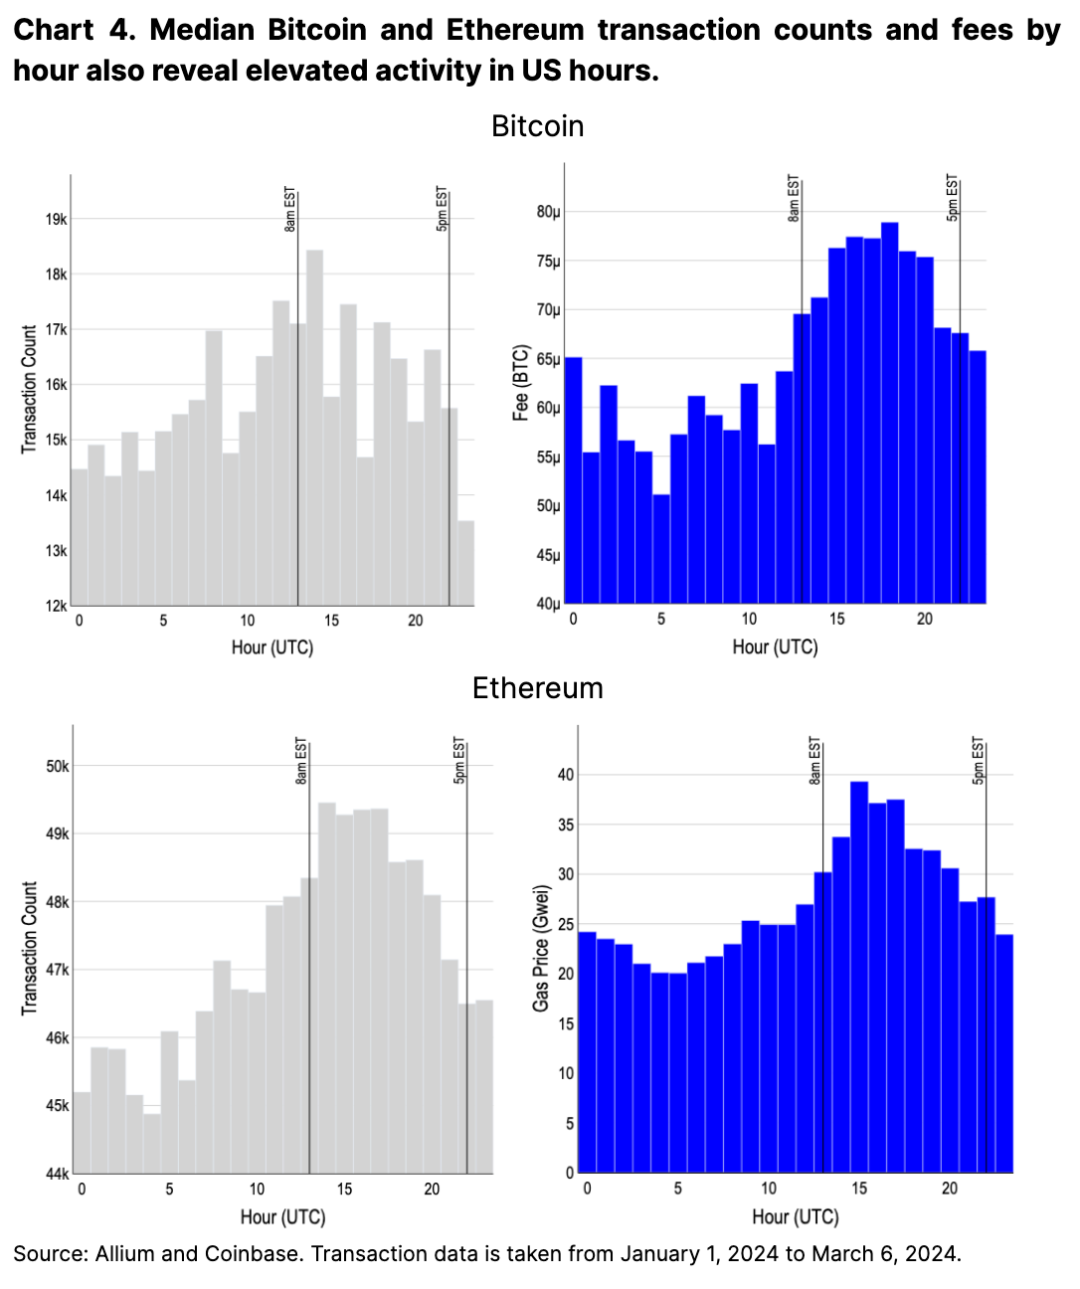
On-chain metrics reflect a similar pattern. Both Bitcoin and Ethereum transaction volumes peak during U.S. hours, with transaction costs rising over 50% compared to off-peak periods. Decentralized exchange (DEX) trading volumes also align with CEX trends, though U.S. dominance on-chain is less pronounced. In contrast, stablecoin usage—both in terms of transaction volume and active user counts—is evenly distributed across U.S. and European hours.
Overall, we believe these data clearly demonstrate the outsized influence of the U.S. on trading and on-chain activity despite ongoing regulatory challenges. The success of U.S. spot Bitcoin ETFs and their noticeable impact on the broader Bitcoin market further confirm that regulatory clarity in the U.S. plays a pivotal role in unlocking new capital inflows into the crypto market.
Centralized Exchanges
Beyond opening access to new pools of institutional capital, a second-order effect of U.S. spot Bitcoin ETFs has been an increased concentration of CEX trading volume during U.S. hours. Even prior to ETF approval, trading volume peaked during U.S. market open (9–10 AM Eastern Time), reaching approximately twice the volume seen at the start of Asian and European trading sessions (see Figure 1). However, following the launch of spot ETFs, U.S. trading volume across all spot, perpetual futures, and non-perpetual futures products has risen to nearly three times that of other regions.
Since January 11, spot CEX trading volume during U.S. hours has grown by 130–200%, significantly outpacing growth in Asian and European volumes, which rose by 80–120%. Perpetual futures volume during U.S. peak hours has surged nearly 70% (from $2.3B to $3.8B), while increases in Asia and Europe were 20% and 50% respectively ($1.0B to $1.2B and $1.0B to $1.5B). The rise in perpetual futures volume is particularly notable, as these instruments are almost entirely traded outside the U.S. We believe this may indicate offshore participants are leveraging stronger spot liquidity during U.S. hours, or that U.S. traders are accessing these markets through offshore entities.
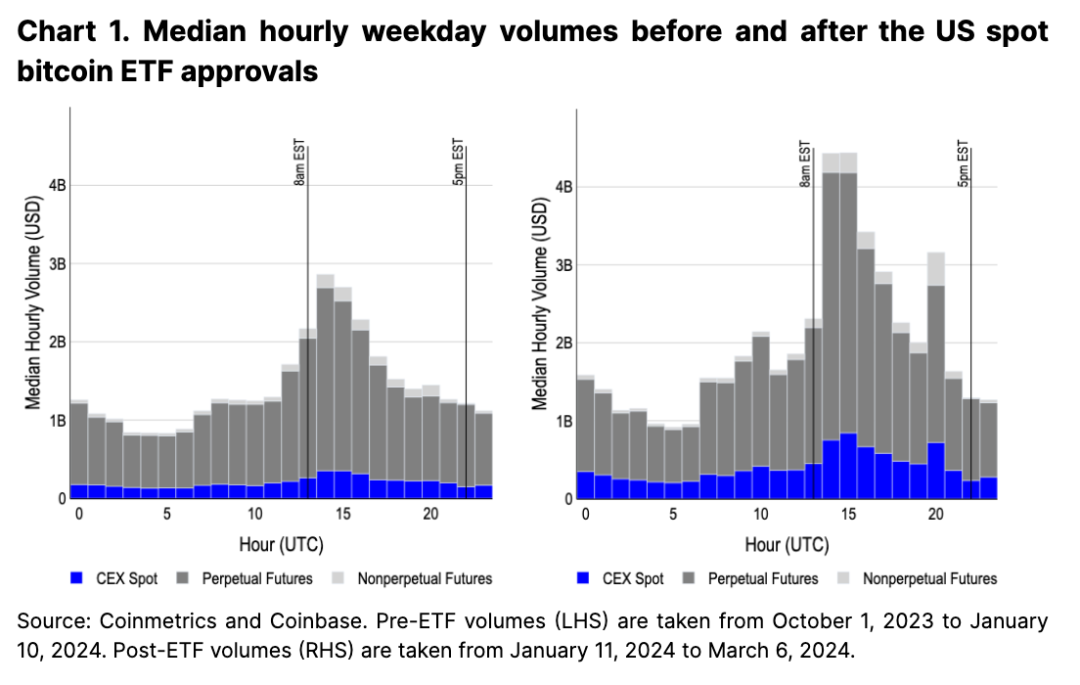
The launch of spot ETFs has also triggered a new spike in trading volume across all product categories at 3 PM New York time. This is primarily because ETF issuers aim to keep their fund prices aligned with the underlying benchmark. Six out of ten spot ETFs track the CME CF Bitcoin Reference Rate – New York Variant (BRRNY), which is calculated between 3 PM and 4 PM New York time. As a result, authorized participants acquire underlying Bitcoin as part of the cash creation (and redemption) mechanism, often hedging their exposure via regulated products like CME Bitcoin futures—especially if they lack access to offshore perpetual markets. Indeed, the period from 3 PM to 4 PM New York time is the most active for CME Bitcoin futures, exceeding trading volume in other periods by over 60%.
Return Volatility
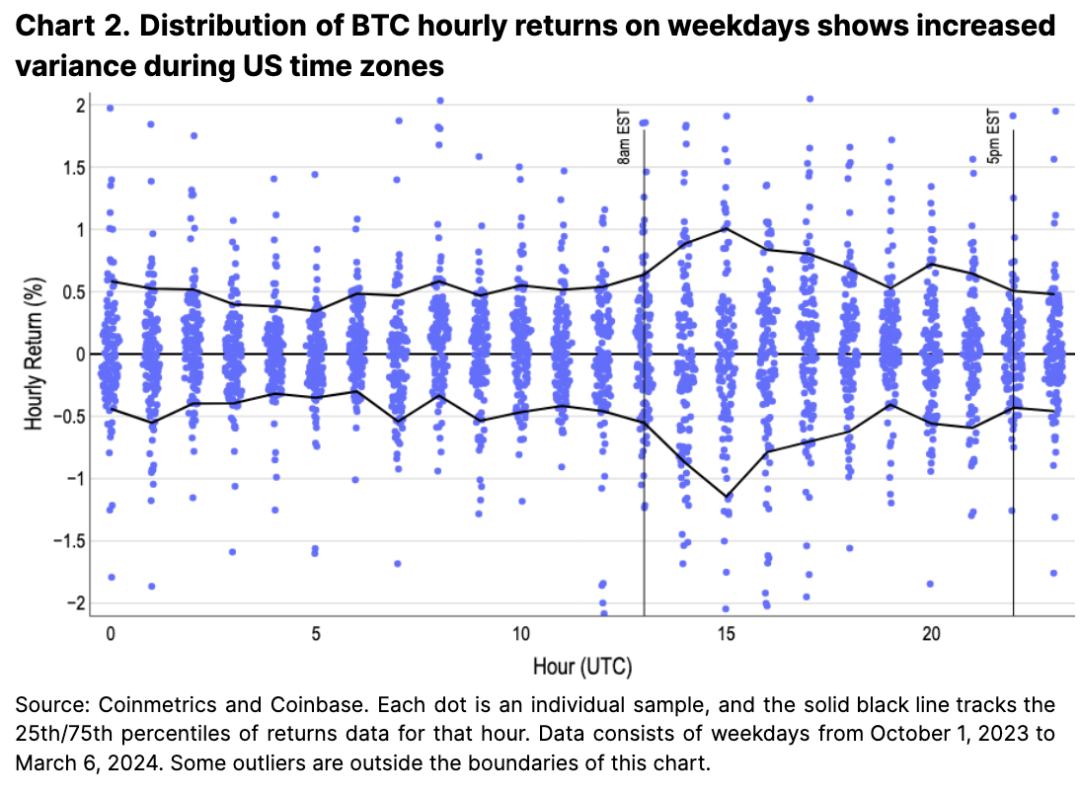
U.S. liquidity dominance is also reflected in Bitcoin’s price behavior. The blue bands in Figure 2 illustrate hourly return distributions (showing density), with black lines marking the 10th and 90th percentiles. Periods with wider return ranges correspond closely with earlier volume charts, indicating that high trading volume during early U.S. hours typically translates into greater price volatility. This suggests that, in terms of liquidity and volatility, the early U.S. trading session offers the best opportunities for intraday traders.
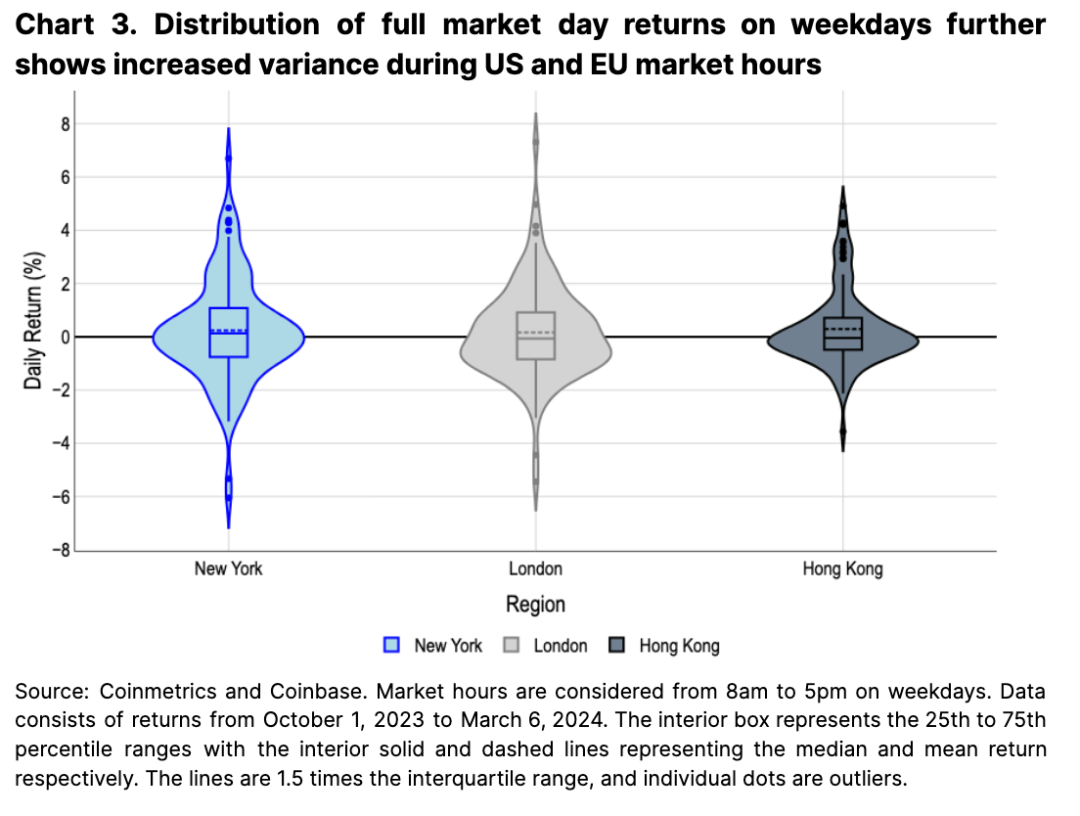
Measuring full-market daily returns across major financial centers (from 8 AM to 5 PM local time) further reveals regional disparities. The violin plots in Figure 3 show broader return distributions for New York and London (the width of the "violin" reflects the probability of a given return using kernel density estimation). In contrast, Hong Kong session returns are much more concentrated. We believe this further underscores the importance of U.S. traders—and to some extent European traders, whose closing hours overlap with U.S. opening hours—in driving Bitcoin price movements.
Global Distributed Networks
Despite the globally accessible and decentralized nature of Bitcoin and Ethereum, on-chain activity also peaks during U.S. hours. Transaction costs during U.S. hours rise over 50% from trough levels, confirming this trend (see Figure 4). We believe this surge in U.S.-hour usage stems partly from the U.S.’s large, tech-savvy, and capital-rich population relative to other regions. Additionally, this activity may be driven by U.S. traders managing positions across wallets and exchanges—consistent with increased CEX trading volume during these hours.
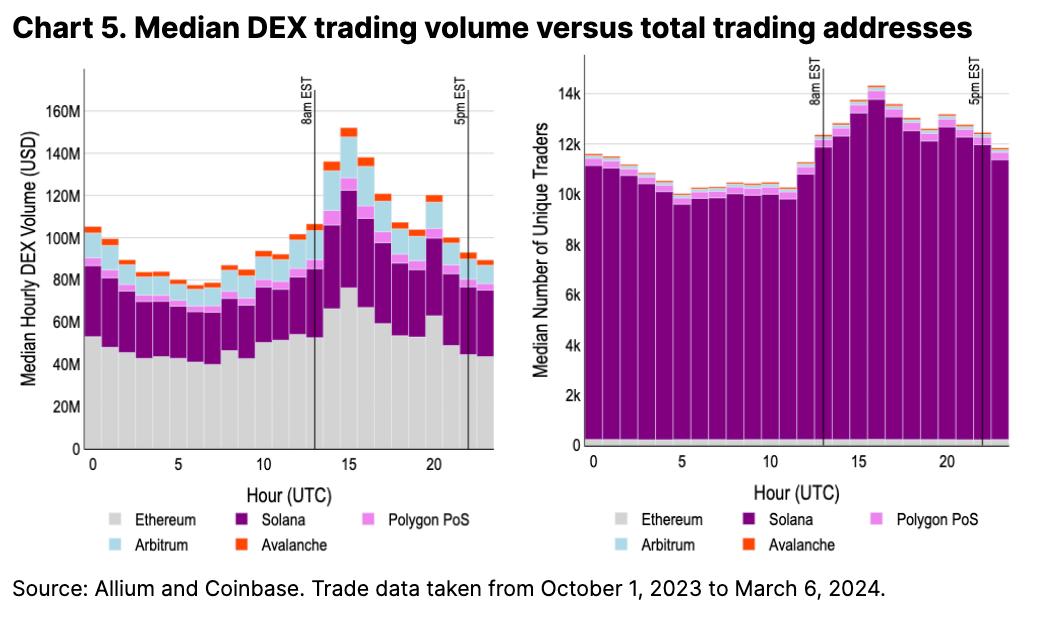
On-chain DEX volumes further support the model of peak activity during U.S. market hours, though the disparity is less pronounced than on CEXs. DEX volume at the start of the Asian session (UTC 0) surges to about 70% of U.S. peak volume, whereas CEX volume during the same period reaches less than 30% of U.S. highs (see Figure 5). This volume ratio has remained relatively unchanged before and after ETF approval.
We believe the smaller discrepancy in DEX volumes compared to CEXs stems from DEXs being relatively nascent and differing market structures—such as traditional centralized limit order books versus automated market makers. This has created a newer, more level playing field, one that only truly emerged following the seminal 2019 “Flash Boys 2.0” paper discussing favorable on-chain trading strategies (and more broadly, maximum extractable value).
Additionally, we do not view unique transacting addresses as a reliable proxy for regional usage. These figures are distorted by anticipated airdrops, especially on low-fee chains like Solana. For example, Jupiter, Solana’s leading DEX aggregator, has only released the first of four planned airdrop rounds, with future dates still unannounced. Therefore, we expect this metric to remain significantly biased for some time.
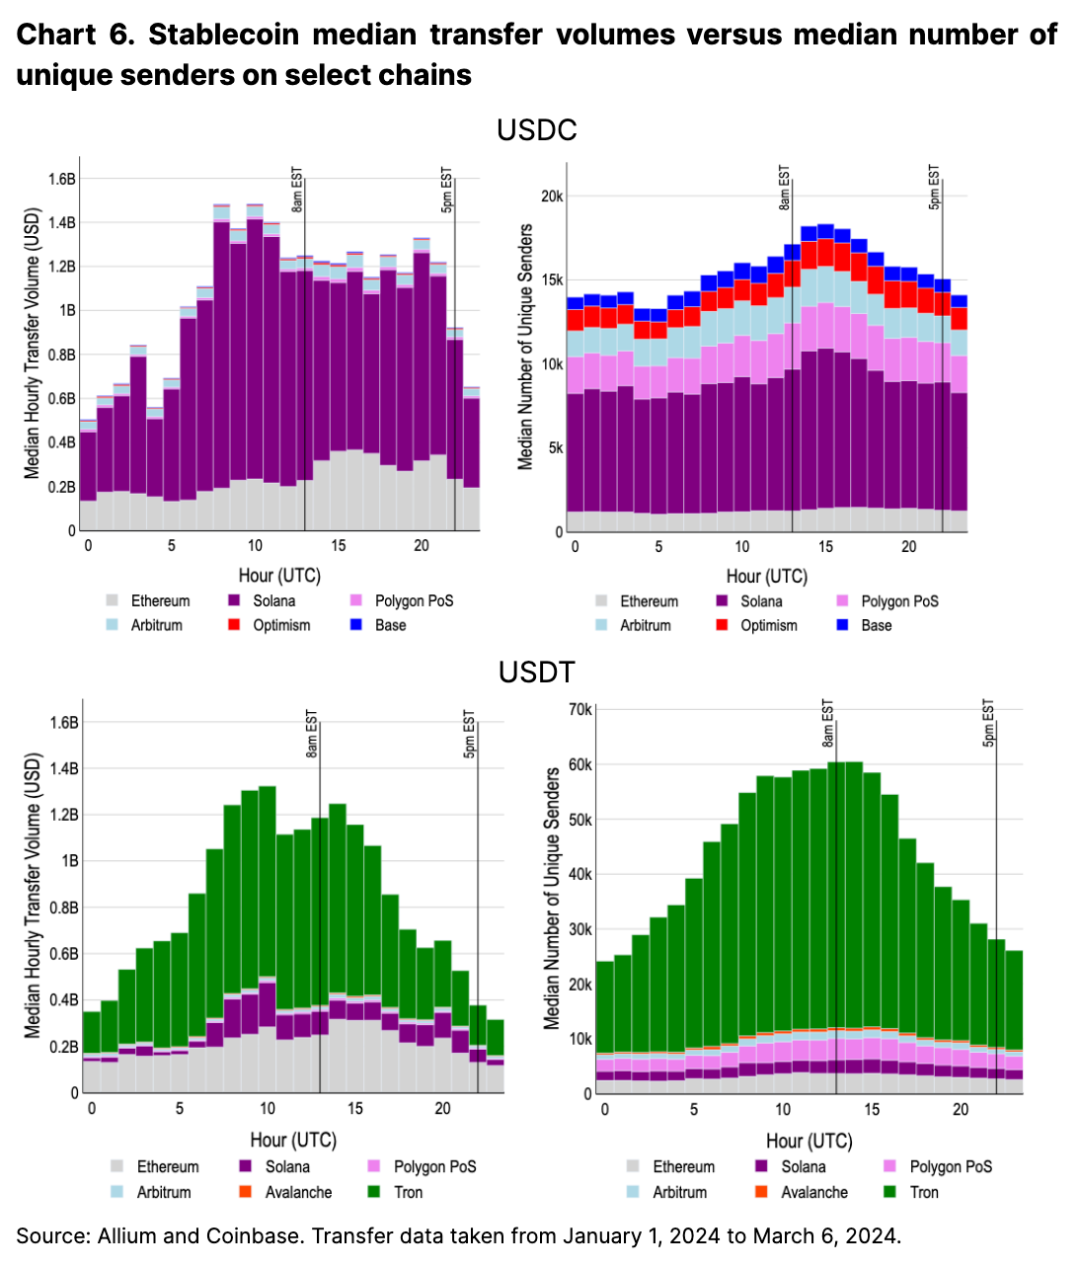
Beyond DEXs, we consider stablecoin transfers another key indicator for assessing crypto usage by time zone. Importantly, stablecoin transfer statistics are generally not distorted by short-term airdrop incentives like DEX activity. Interestingly, this is the first activity we observe that does not heavily favor U.S. market hours.
Solana-based USDC transfers, which account for a large share of volume, peak during European hours, while Ethereum-based volumes lean more toward U.S. hours (see Figure 6). That said, there is a modest uptick in total transfer counts during early U.S. hours (peaking at around 17,000 per hour vs. lows of 13,000). USDT transaction volume similarly peaks during European trading hours, with sustained high transfer counts throughout the European daytime. This suggests that dollar-denominated stablecoins have achieved broader global adoption, especially in regions where dollar assets are not seamlessly integrated into local financial systems.
Conclusion
Given the generally challenging U.S. regulatory environment over the past few years, the dominant position of the U.S.—and to a lesser extent Europe—in the crypto market may seem surprising. However, we believe the U.S.’s strong capital base, investment culture, and technologically adept population make its outsized influence on crypto both understandable and significant.
The approval of spot Bitcoin ETFs in the U.S. was a landmark event, unlocking a major new source of capital and drawing greater attention to U.S. market activity. We believe it underscores the critical role of U.S. regulation and policy in shaping the crypto market. Furthermore, these findings highlight the relevance of U.S. investor sentiment as a primary driver of market trends. As demonstrated by the approval of U.S. spot Bitcoin ETFs, we believe further regulatory clarity and frictionless access to crypto could continue to strengthen the U.S.’s dominance in the crypto market.
Join TechFlow official community to stay tuned
Telegram:https://t.me/TechFlowDaily
X (Twitter):https://x.com/TechFlowPost
X (Twitter) EN:https://x.com/BlockFlow_News