
2023 Annual TOP Review: Public Chain Tokens Lead Gains with INJ on Top, Lido Dominates Staking Volume
TechFlow Selected TechFlow Selected
2023 Annual TOP Review: Public Chain Tokens Lead Gains with INJ on Top, Lido Dominates Staking Volume
This article provides a comprehensive analysis of trading data and on-chain data, reviewing several sectors including token prices, public blockchains, DeFi, NFTs, and DApps.
 Navigating Web3 tides with focused insights
Author: Carol, PANews
In 2023, after a prolonged period of market volatility and adjustment, the crypto market surged at year-end. Amid these price fluctuations, popular narratives evolved throughout the year, with various sub-sectors experiencing new developments. Public blockchains regained attention due to the ordinals craze; the DeFi market developed steadily, with total value locked (TVL) fluctuating around $50 billion; NFT market capitalization shrank by 31%, with several blue-chip projects seeing their trading prices halved; Friend.tech sparked a brief boom in SocialFi... Among these sub-markets, which top projects deserve attention? PAData conducted a comprehensive analysis of trading and on-chain data, reviewing key areas including token prices, public blockchains, DeFi, NFTs, and DApps:
Secondary Trading Market:
-
Among the top 100 major tokens by market cap, the average price increase of the top 30 gainers reached 512.75%. INJ led with a surge exceeding 2994%, while KAS and RNDR each gained over 1000%, at approximately 1993% and 1037% respectively. BTC rose 153%, ranking 28th.
-
Most of the top 30 gainers ranked between 30th and 50th by market cap. Among them, 10 belonged to the Layer1 category, 4 to Layer2, and 6 to DeFi.
Public Blockchains:
-
Tron, BNB Chain, and Bitcoin had the highest daily active addresses; Solana [estimated], Tron, and Avalanche [estimated] recorded the most daily transactions. Avalanche saw the highest annual growth in active addresses, followed by Solana; NEAR had the highest growth in transaction count, followed by Bitcoin and Avalanche.
DeFi:
-
Among the top 30 protocols by TVL, Lido ranked first with approximately $20.52 billion. Maker, AAVE, and JustLend followed.
-
Protocols with significant TVL growth included Spark, Blast, EigenLayer, Jito, Marginfi, Marinade Finance, Benqi, Rocket Pool, Lido, Morpho, and Synthetix. Solana and Avalanche also secured positions among leading projects.
NFTs:
-
Among the top 30 NFTs by trading volume, BAYC led with over $1.7 billion, followed by MAYC with over $1.2 billion, and Azuki with over $900 million.
-
Among the top 30 NFTs by price appreciation, Opepen Edition, OnChainShiba, and Checks all surged over 5000%, with another 20 projects gaining more than 100%.
-
The top 30 NFTs by price decline included multiple well-known blue-chip projects: Doodles dropped over 74%, Beanz over 70%, cool cats over 64%, MAYC over 63%, BAYC over 61%, Azuki over 52%, and Otherdeed over 50%.
Gaming and Social DApps:
-
Highly active gaming and social applications shared two characteristics: lack of sustainability—nearly all projects maintained high activity only briefly—and explosiveness—most achieved explosive cold starts toward year-end, resulting in exceptionally high annual growth in active addresses and transaction counts.
01. Layer1 Tokens Lead Gains, INJ, KAS, and RNDR Top Performers
In 2023, among the top 100 tokens by market cap, the top 30 gainers averaged a 512.75% increase. INJ led with a surge exceeding 2994%, while KAS and RNDR gained approximately 1993% and 1037% respectively. Other tokens outperforming the average included MSOL, SOL, WEMIX, CFX, FET, and STX. BTC rose 153%, ranking 28th.
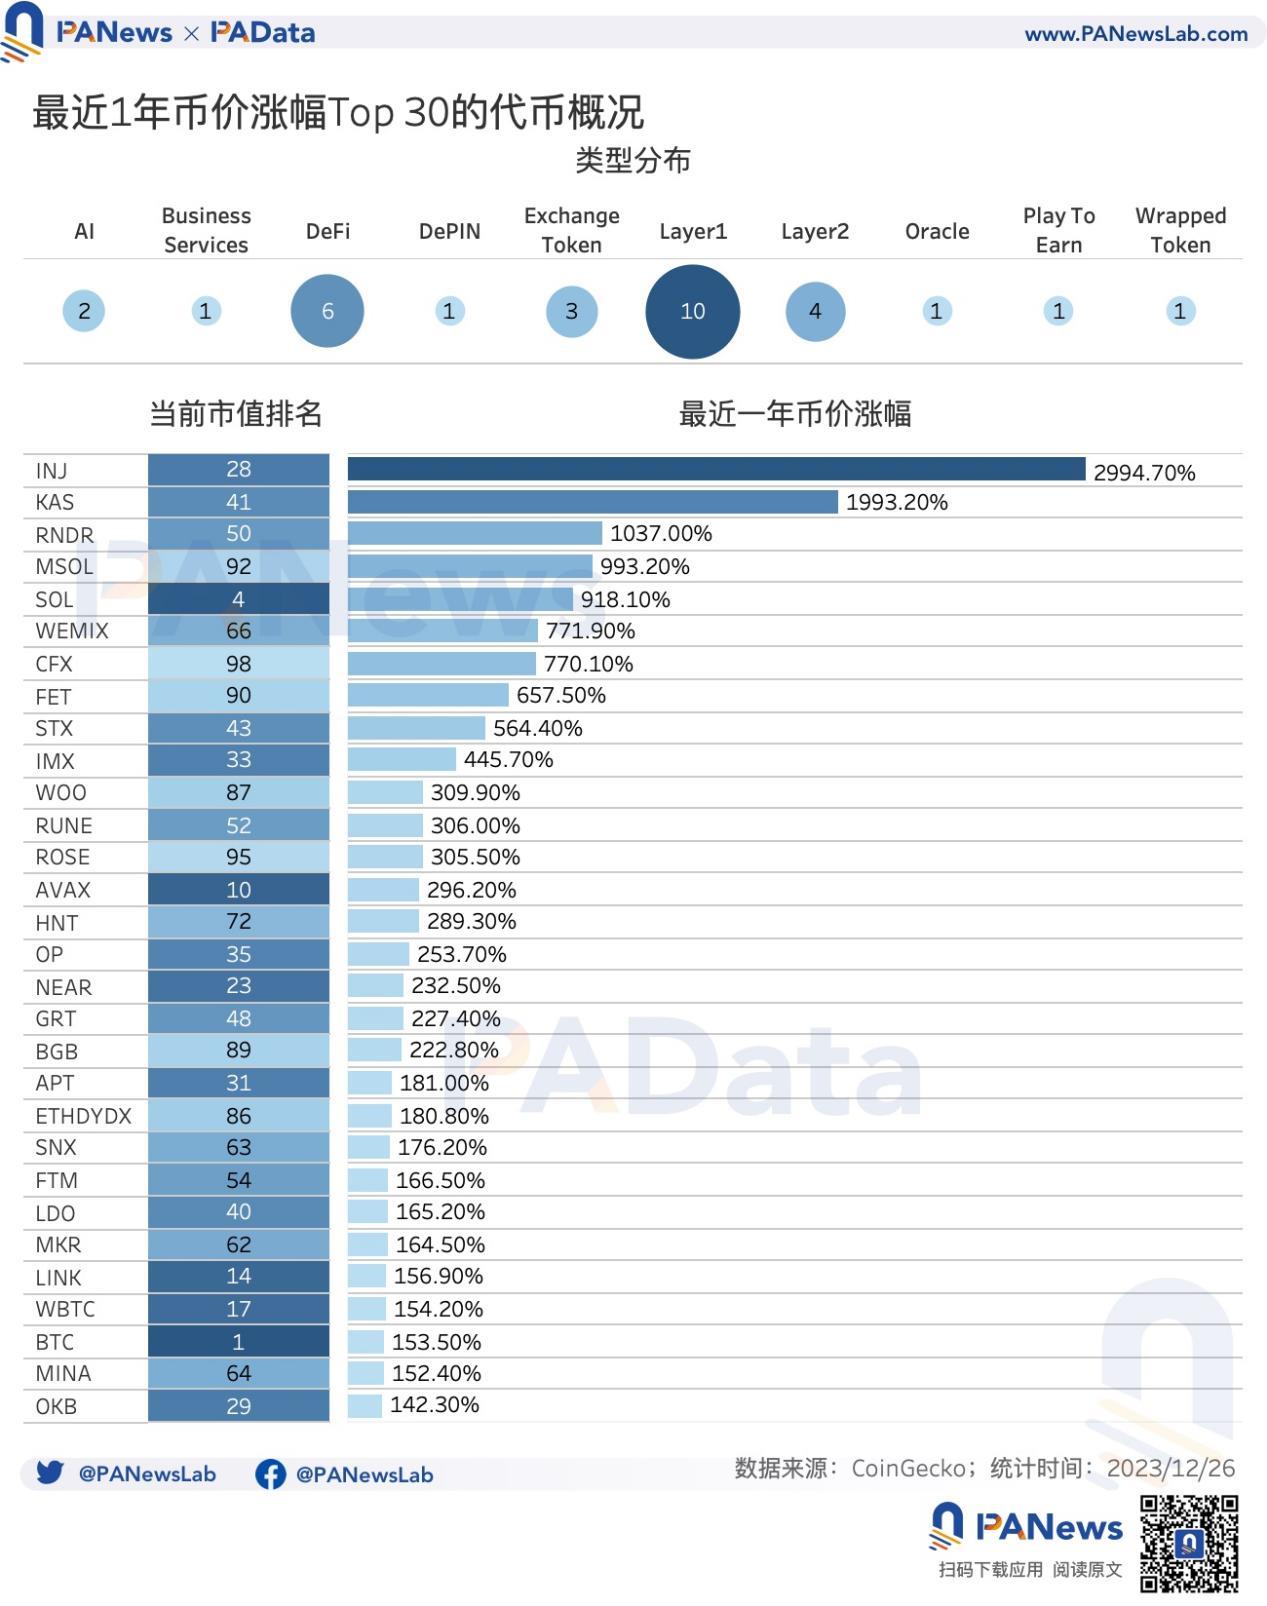
By market cap ranking, most of these top-performing tokens were mid-tier assets ranked between 30th and 50th, followed by lower-ranked assets beyond 50th place. Among the top 10, only BTC, SOL, and AVAX showed strong performance.
Based on token categories (using CoinGecko’s classification with minor manual adjustments), 10 of the top 30 gainers belonged to Layer1, and 4 to Layer2, collectively accounting for nearly half of the top gainers. Despite DeFi's relatively muted performance this year, it still contributed 6 tokens to the top 30. Other categories with multiple entries included AI and Exchange Tokens.
Higher-gaining tokens typically exhibited greater daily price volatility. The top gainer INJ had an average daily intraday amplitude of 1.15%, while the lowest gainer among the top 30, OKB, had only 0.36%. Overall, however, these tokens showed clear upward trends, with an average daily amplitude of just 0.58%.

Except for BTC, which had an average daily trading volume of $18.95 billion, most of the other top 30 gainers had average daily volumes under $100 million. KAS, up nearly 3000%, had an average daily volume of just $17 million; MSOL and WEMIX, both up over 700%, had average daily volumes below $10 million. Overall, these tokens had relatively small trading volumes.
02. Avalanche and Solana See Strong Growth in Active Addresses, Ethereum Remains Highest in Annual Transaction Fees
Considering transaction activity and market visibility, PAData selected 10 public blockchains—Polygon, BNB Chain, Ethereum, Avalanche, Fantom, Bitcoin, Solana, NEAR, Cardano, and Tron—as analytical samples. Due to inconsistent data dimensions provided by official explorers across chains, the following analysis is based on limited comparability.
From a user perspective, Tron was the most active chain, followed by BNB Chain and Bitcoin, with average daily active addresses reaching 1.811 million, 1.165 million, and 949,000 respectively—far exceeding Ethereum and Polygon, both at around 400,000.
Solana had 803,700 daily active addresses on December 26, up from 418,300 at the beginning of the year. Estimated annual average daily active addresses were roughly 600,000, possibly placing it between Bitcoin and Ethereum. Another chain that gained attention toward year-end was Avalanche (including all subnets), with 155,000 daily active addresses at year-end versus 45,700 at the start. Its estimated annual average likely remained significantly below Polygon’s level.
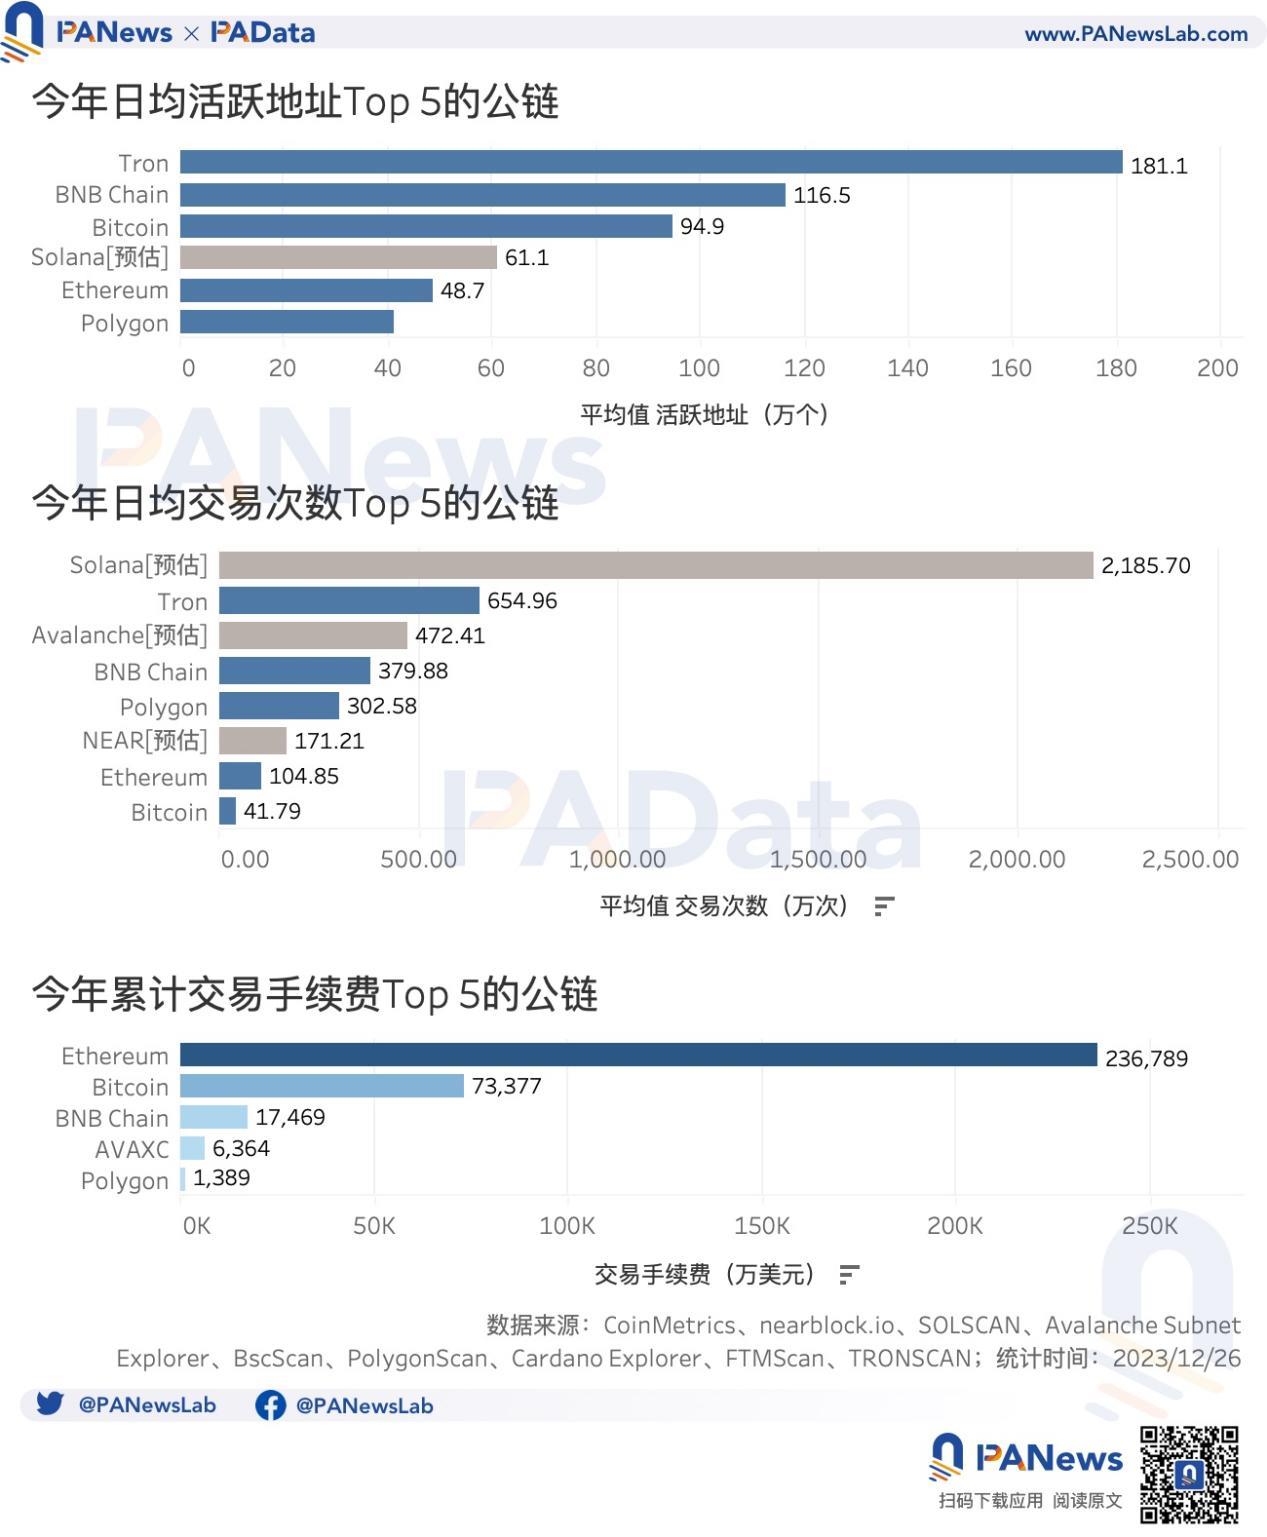
In terms of transaction count, Tron led with over 6.54 million daily transactions. However, Solana's non-voting transaction count exceeded 24.32 million at year-end (and was already at 19.39 million at the start), suggesting it may be the most transactionally active chain when projected annually. Avalanche also had a high estimated average daily transaction count, exceeding 4.72 million, while BNB Chain and Polygon both surpassed 3 million.
Regarding transaction fees, Ethereum remained the highest-fee blockchain for the year, generating $2.368 billion, followed by Bitcoin with $734 million. BNB Chain’s fees exceeded $170 million.
In terms of growth, Avalanche had the highest increase in daily active addresses, exceeding 239%, followed by Solana at over 92%. BNB Chain and Polygon also showed notable growth, while Bitcoin and Ethereum remained relatively stable.
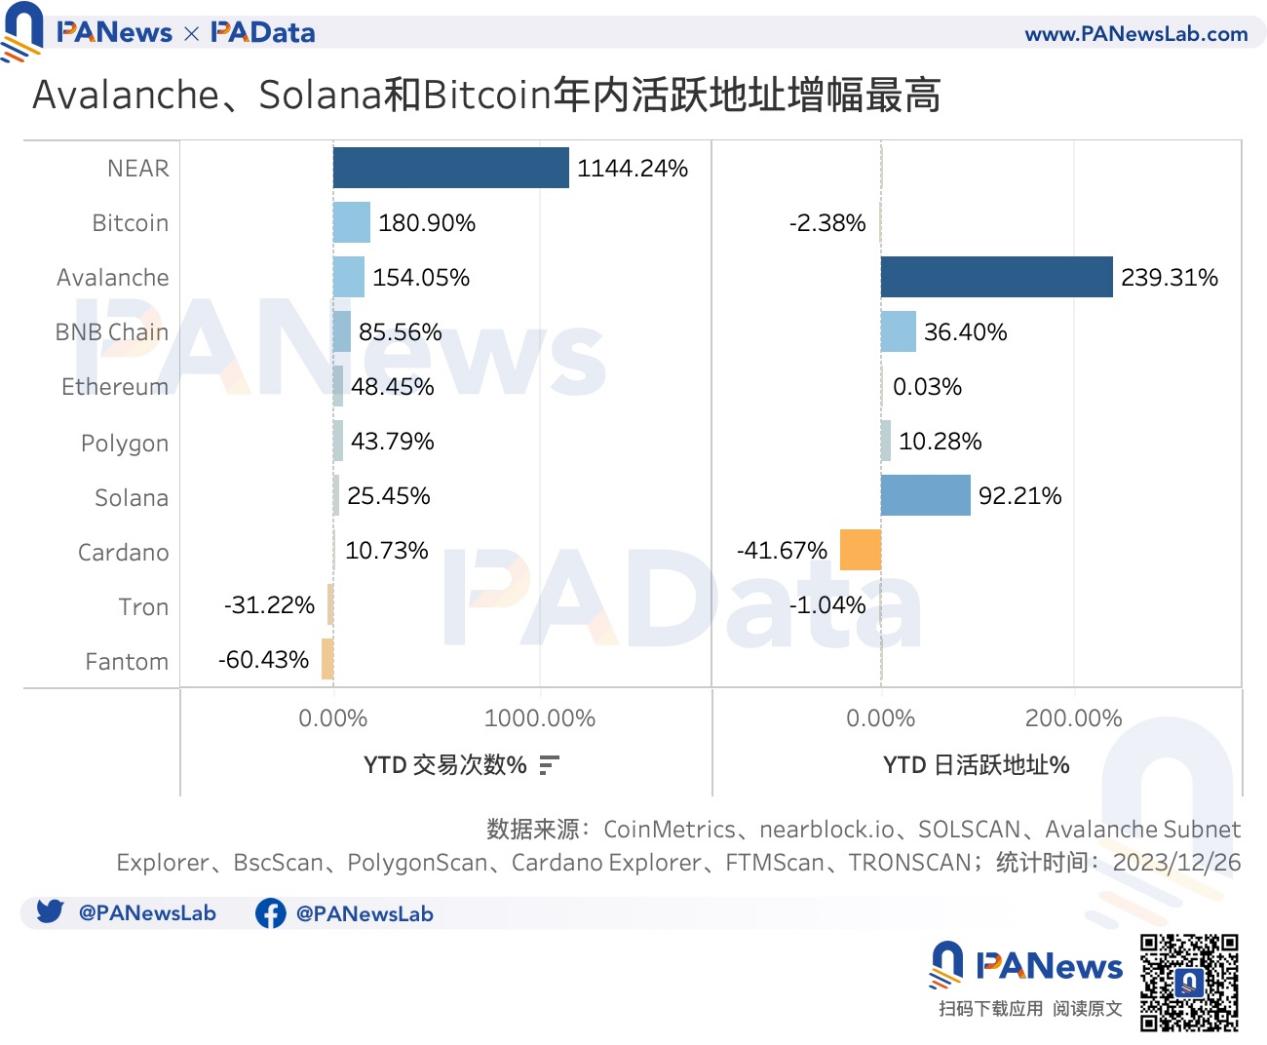
NEAR had the highest growth in daily transaction count, exceeding 1144%. Bitcoin and Avalanche also saw daily transaction count increases over 100%, likely influenced by the year-end ordinals craze. Additionally, Ethereum’s daily transaction count grew over 48%, and Solana’s increased over 25%. Overall, most blockchains showed increasing daily transaction counts.
03. Lido Leads with Over $20.5 Billion TVL, Seven New Protocols Enter Top 30
DeFi development in 2023 was moderate, with TVL rising from $3.8 billion at the start of the year to $5.45 billion by year-end (December 28), an increase of about 43%. This brings DeFi back to levels seen in mid-June 2022 and comparable to late March 2021, before the DeFi Summer began.
Among current TVL Top 30 protocols, Lido leads with approximately $20.52 billion, far ahead of others. Maker, AAVE, and JustLend follow with TVLs between $6.4 billion and $8.4 billion. Additionally, 14 protocols including Uniswap, Rocket Pool, and Summer.fi have TVLs exceeding $1 billion.
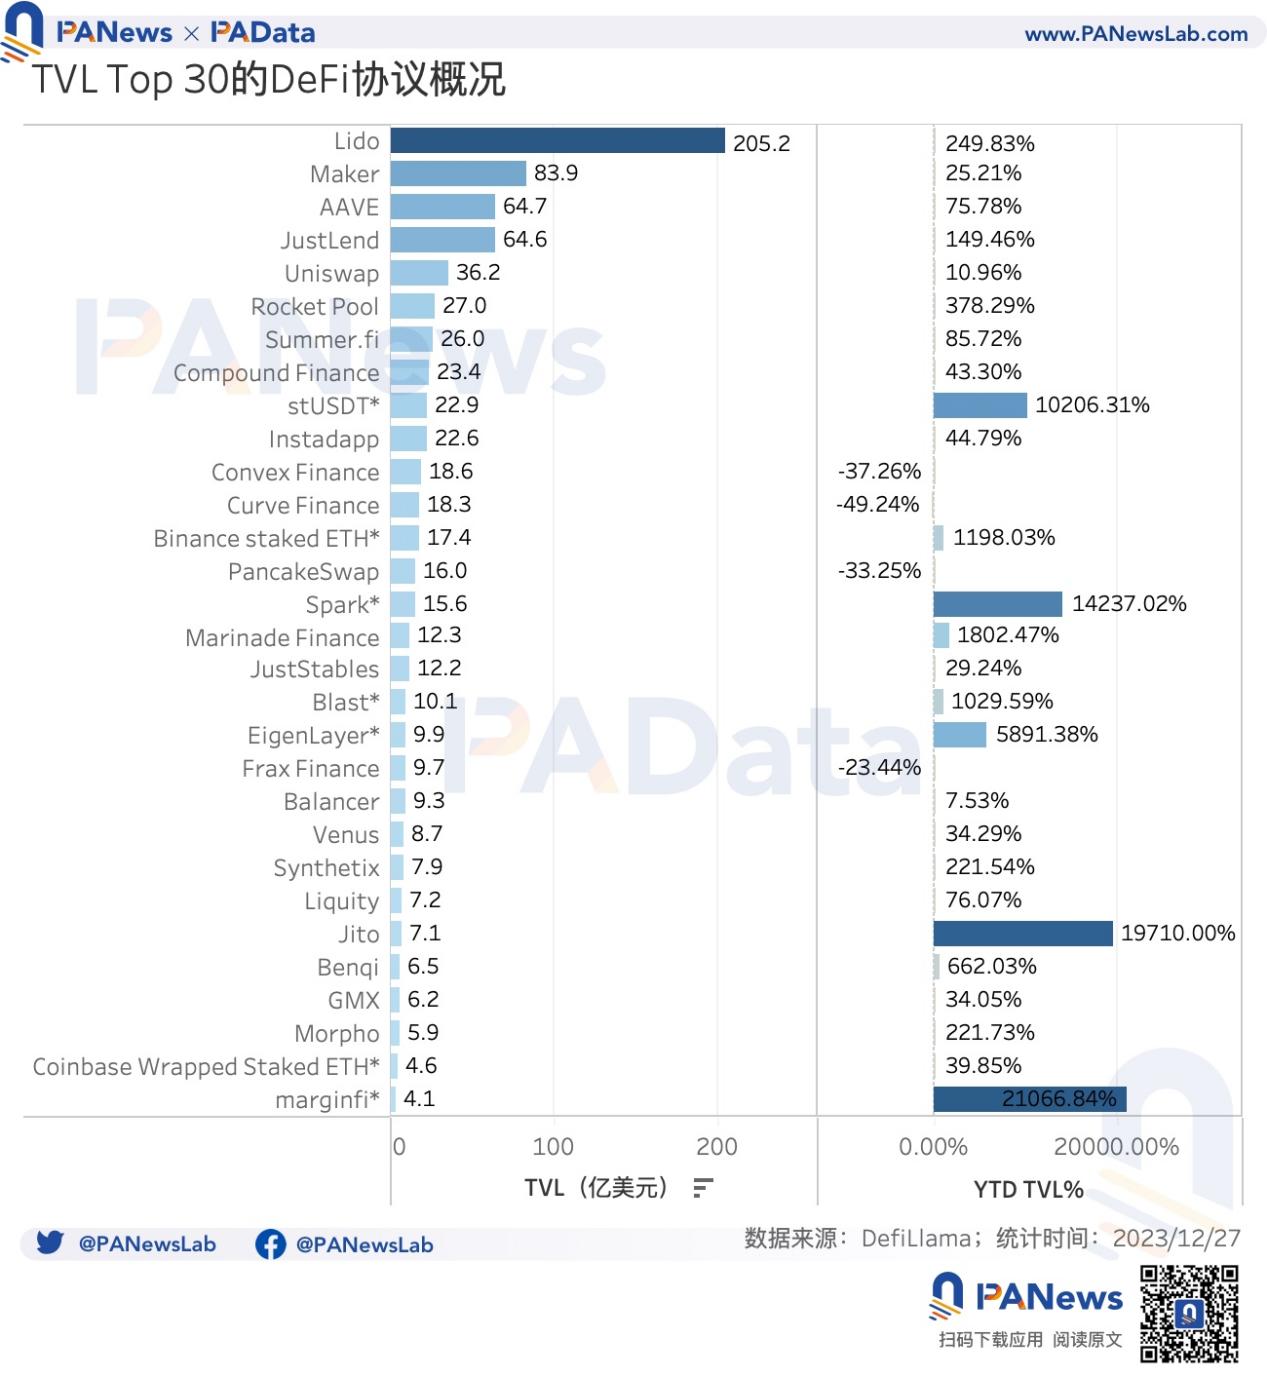
Among the TVL Top 30, seven new protocols (marked with *) achieved successful cold starts, including highly discussed ones like Blast, EigenLayer, and Spark. Excluding these newcomers, Jito saw the highest TVL growth at 19,710%, though it launched in late November 2022, so its 2023 growth reflects early-stage accumulation. Other protocols with strong growth include Marinade Finance (1802%), Benqi (662%), Rocket Pool (378%), Lido (249%), Morpho (222%), and Synthetix (221%).
Notably, Jito and Marinade Finance are deployed on Solana, while Benqi operates on Avalanche. Although most Top 30 TVL protocols remain on Ethereum, Solana and Avalanche have rapidly advanced and now hold prominent positions.
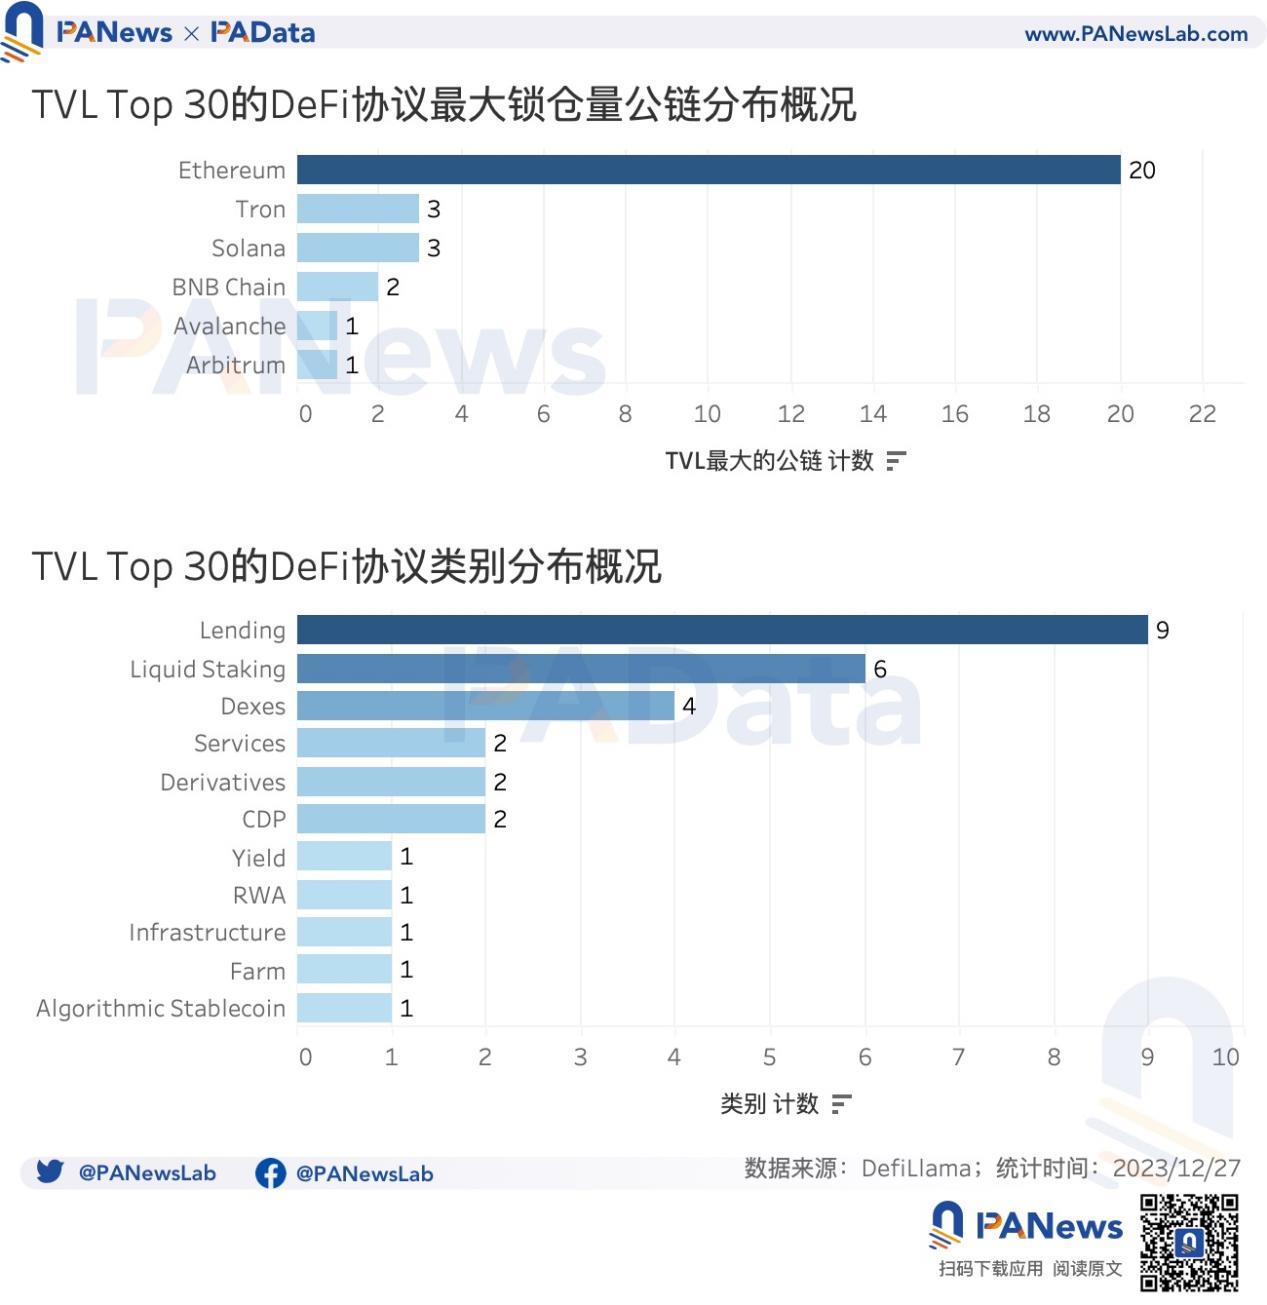
By category, the Top 30 includes nine lending protocols, six liquid staking protocols, and four decentralized exchanges (Dexes). These represent the dominant DeFi types. Other noteworthy categories in 2023 include derivatives and RWA (real-world assets). Though only one or two protocols in each made the Top 30 by TVL, market expectations for these sectors remain high.
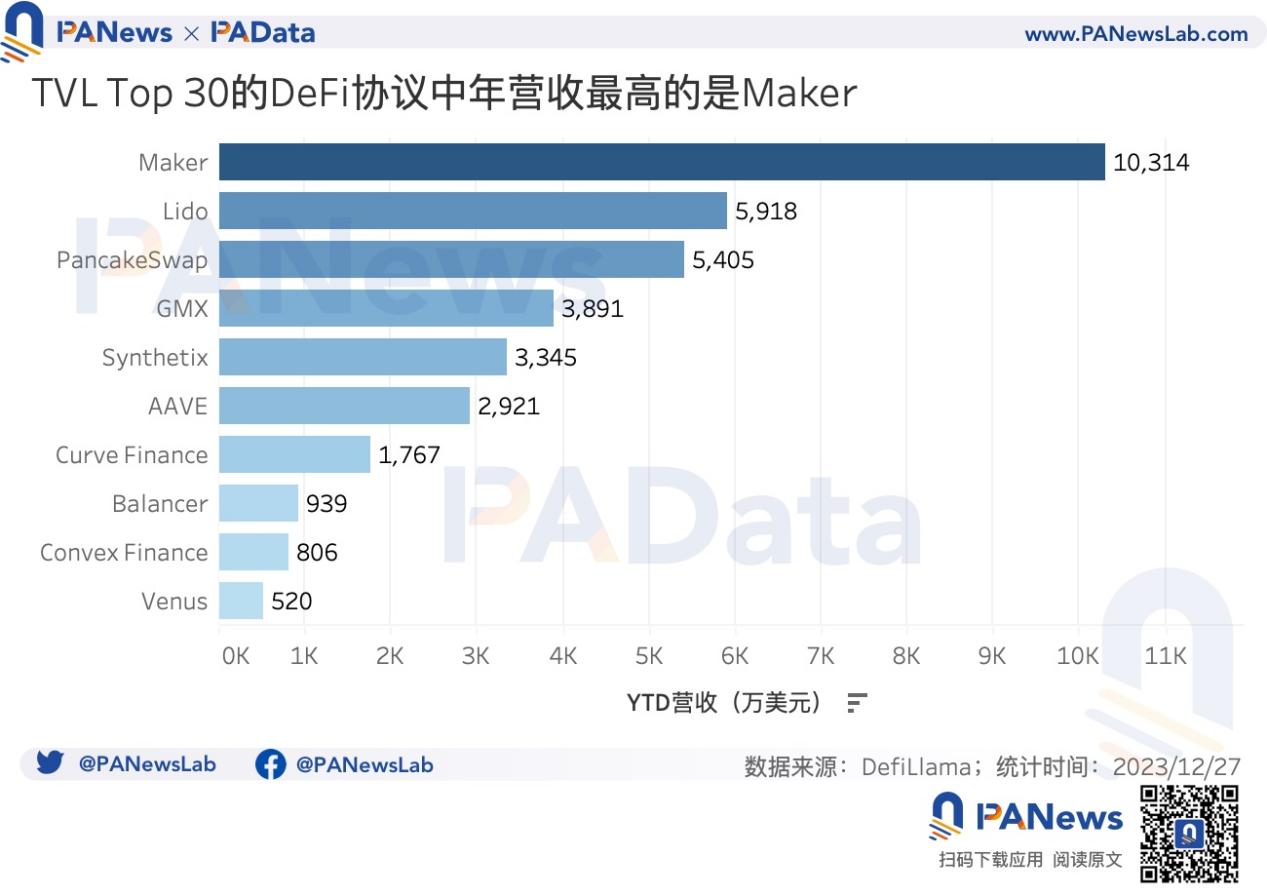
In terms of revenue, among the TVL Top 30, Maker generated the highest annual revenue at $103 million, followed by Lido and PancakeSwap, both exceeding $50 million. GMX, Synthetix, and AAVE each earned over $15 million.
04. NFT Market Cap Shrinks but Trading Volume Rises 28%, Blue-Chips Like BAYC Drop Over 50%
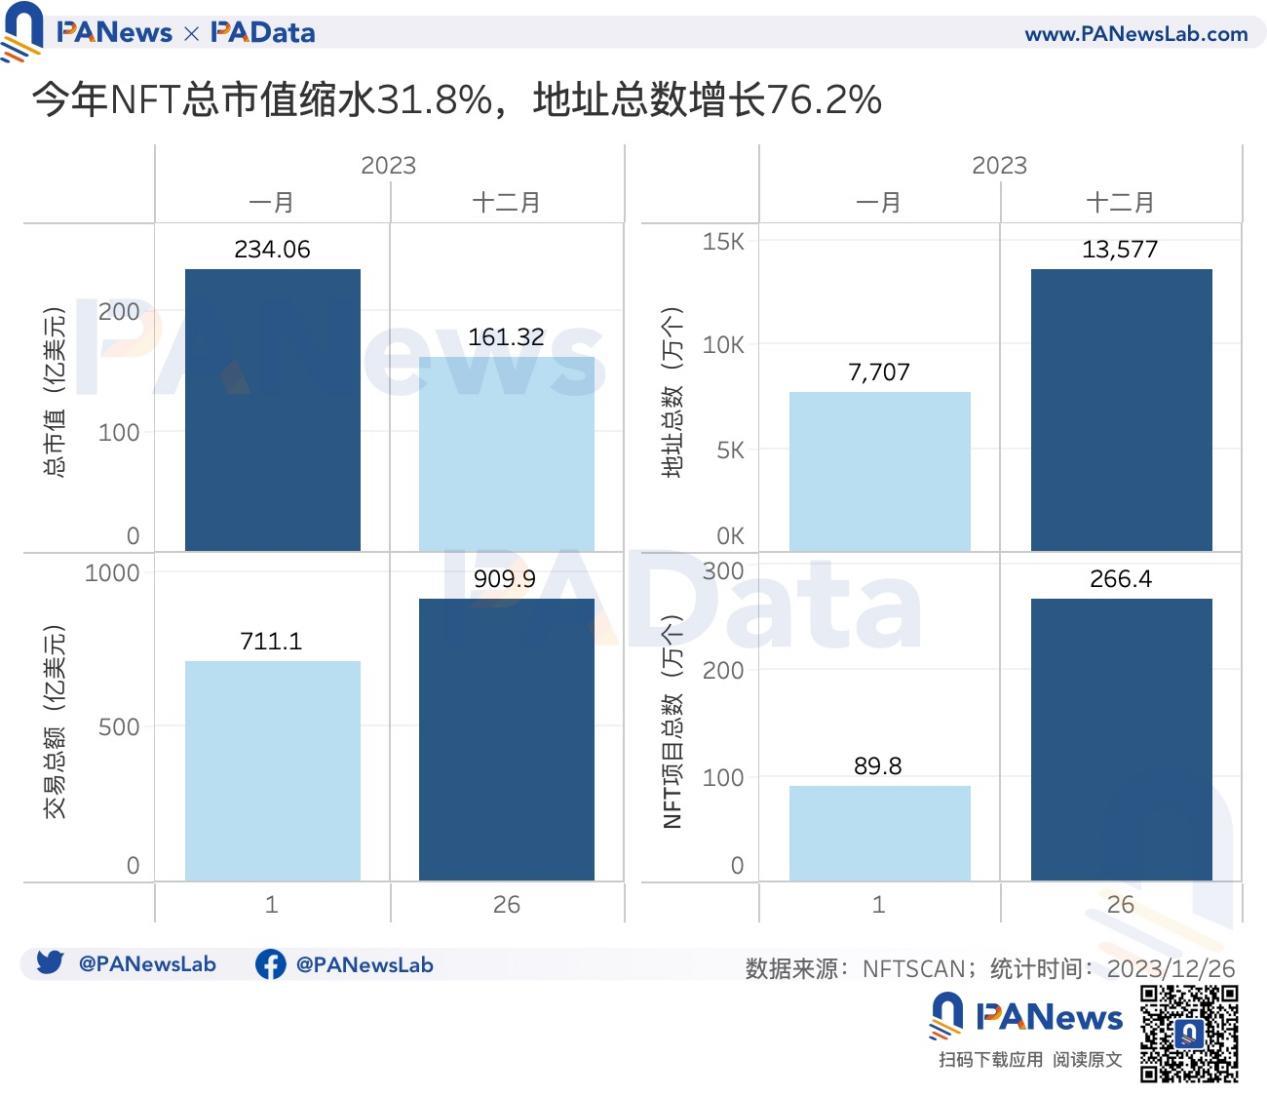
The NFT market cooled in 2023. According to NFTSCAN data, the total market cap of NFTs on Ethereum, Solana, Polygon, and BNB Chain declined from $2.34 billion to $1.61 billion, a drop of approximately 31.08%.
However, trading activity increased. NFT trading volume grew by 27.95%, the number of addresses increased by 76.16%, and the total number of NFT projects surged by 196.76%. More NFT projects launched this year, and more people began holding NFTs.
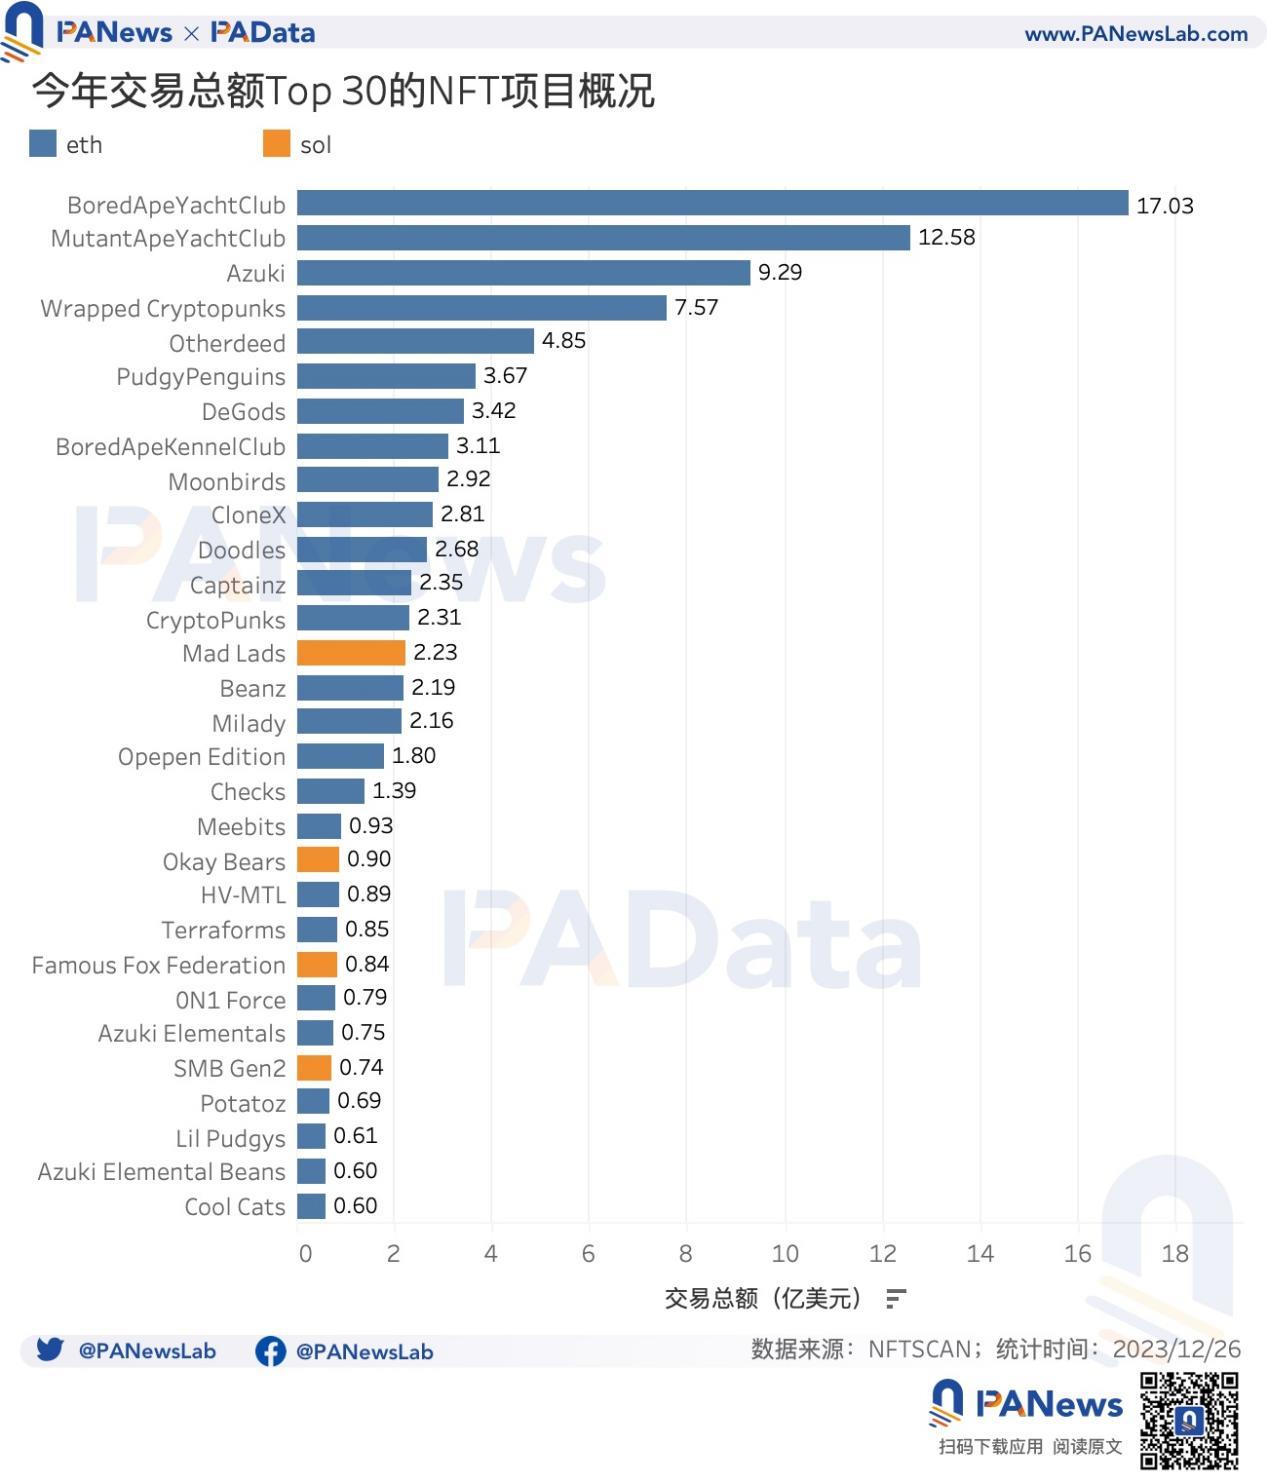
Among the top 100 NFT projects by market cap, BAYC had the highest trading volume (converted to USD using December 26 token prices) at $1.703 billion. MAYC followed at $1.258 billion. No other project surpassed $1 billion.
Other high-volume projects included Azuki and Wrapped Cryptopunks at $929 million and $757 million respectively. Fourteen other projects exceeded $100 million in trading volume, including Otherdeed, Doodles, CloneX, and Moonbirds.
Despite the overall market decline, some projects performed remarkably. Among the top 30 by actual price appreciation, Ethereum-based Opepen Edition, OnChainShiba, and Checks led with gains of approximately 6969%, 6035%, and 5363% respectively. On Solana, Crypto Duck Punkz also surged, gaining over 2144%.
Among the rest of the top 30 gainers, 19 projects rose over 100%, including XEN Torrent, Mad Lads, and ElectricSheep.
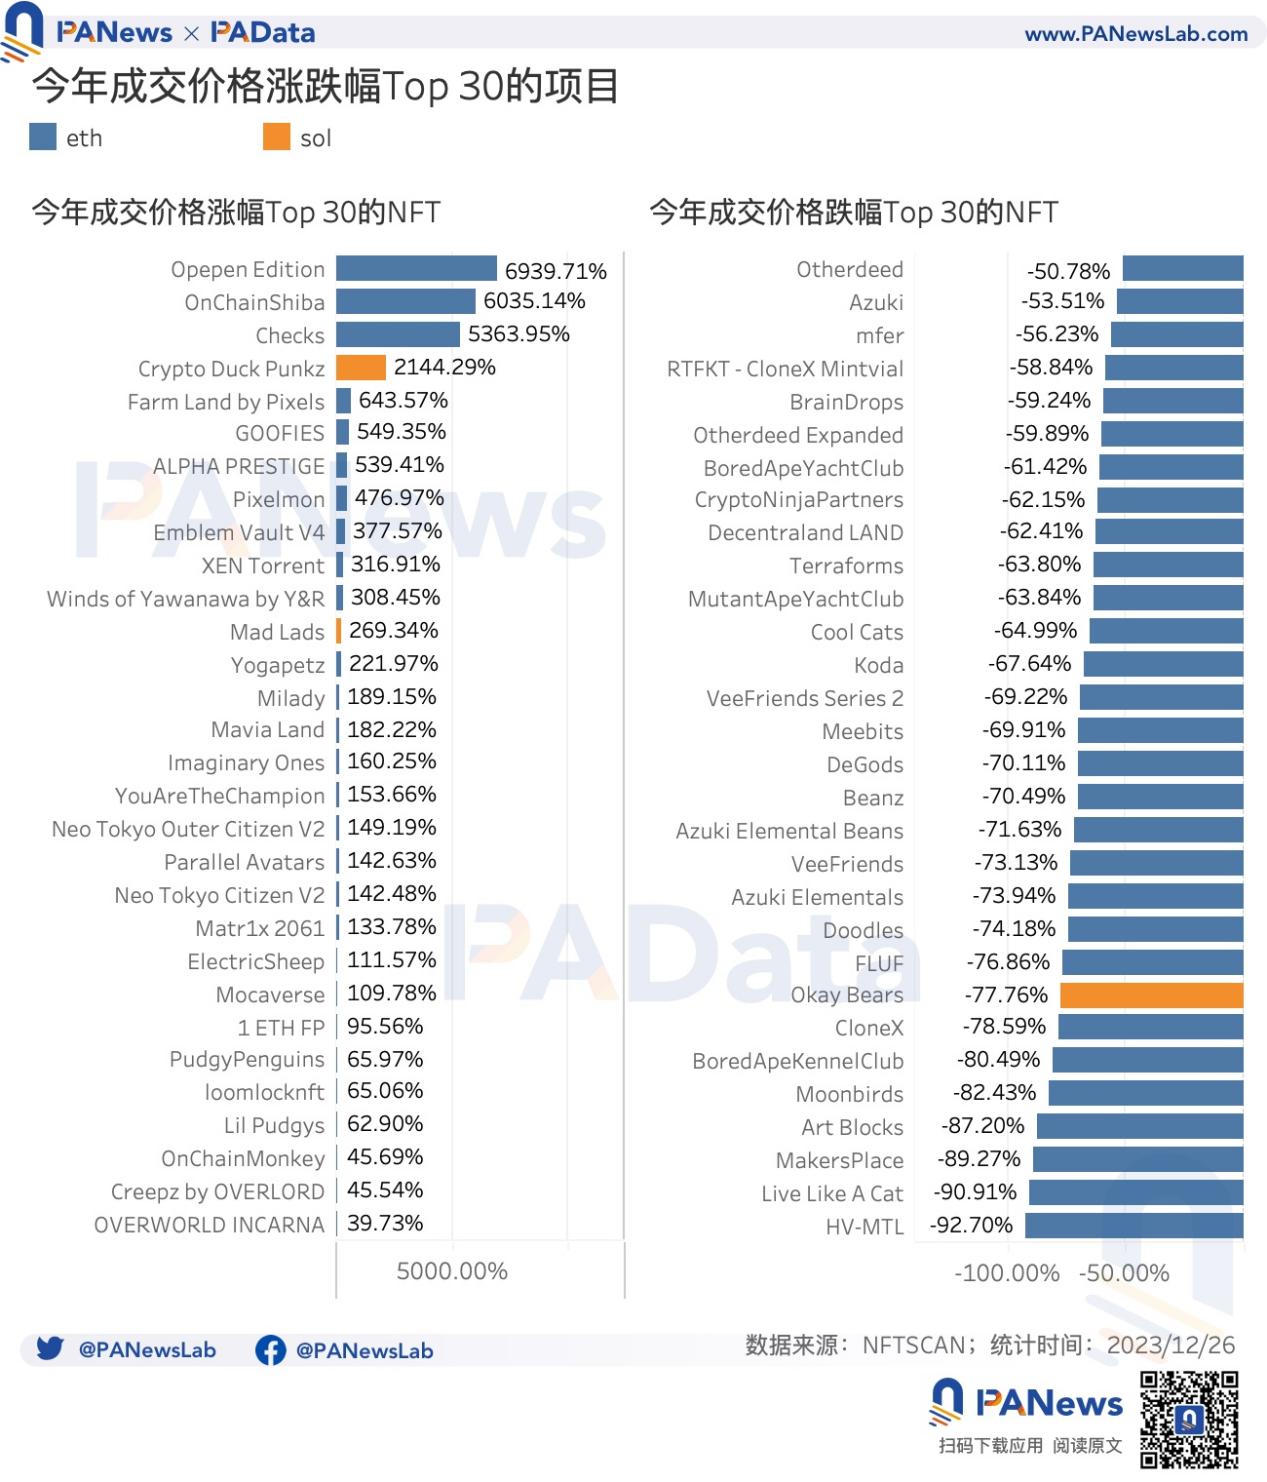
Among the top 30 decliners, HV-MTL fell the most, over 92%. Others dropping over 80% included Live Like A Cat, MakersPlace, Art Blocks, Moonbirds, and BoredApeKennelClub.
Many well-known blue-chip projects saw prices fall by more than half: CloneX down over 78%, Doodles over 74%, Beanz over 70%, cool cats over 64%, MAYC over 63%, BAYC over 61%, Azuki over 52%, and Otherdeed over 50%.
05. New Gaming and Social Apps Show High Activity, Multiple Active Applications on Polygon, Ethereum, and BNB Chain
Beyond DeFi and NFTs, gaming and social DApps attracted significant attention in 2023. Based on estimates from DappRadar (annual estimated active addresses = last 30-day average daily active addresses × 365), the top 10 gaming apps by estimated annual active addresses include motoDEX, PlayEmber, Sweat Economy, PipeFlare, Trickshot Blitz, Gamifly, Farmers World, 5TARS, Pixels, and Solitaire Blitz. The top 10 social apps include Dmail Network, Galxe, Hooked, CARV, QuestN, Arkana, Near Social, Friend.tech, RabbitHole, and SingSing.
Overall, gaming apps had far higher active address counts than social apps. The average estimated annual active addresses for the top 10 gaming apps was 9.83 million, compared to just 2.16 million for the top 10 social apps.
In practice, these projects shared a common trend: lack of sustainability. Nearly all maintained high activity only during short periods before declining sharply. Most DApp activity trends aligned with broader market cycles, meaning peak activity likely occurred toward year-end. Assuming high activity lasted only three months per year, the adjusted average estimated annual active addresses would drop significantly—to 2.42 million for gaming and just 530,000 for social apps.
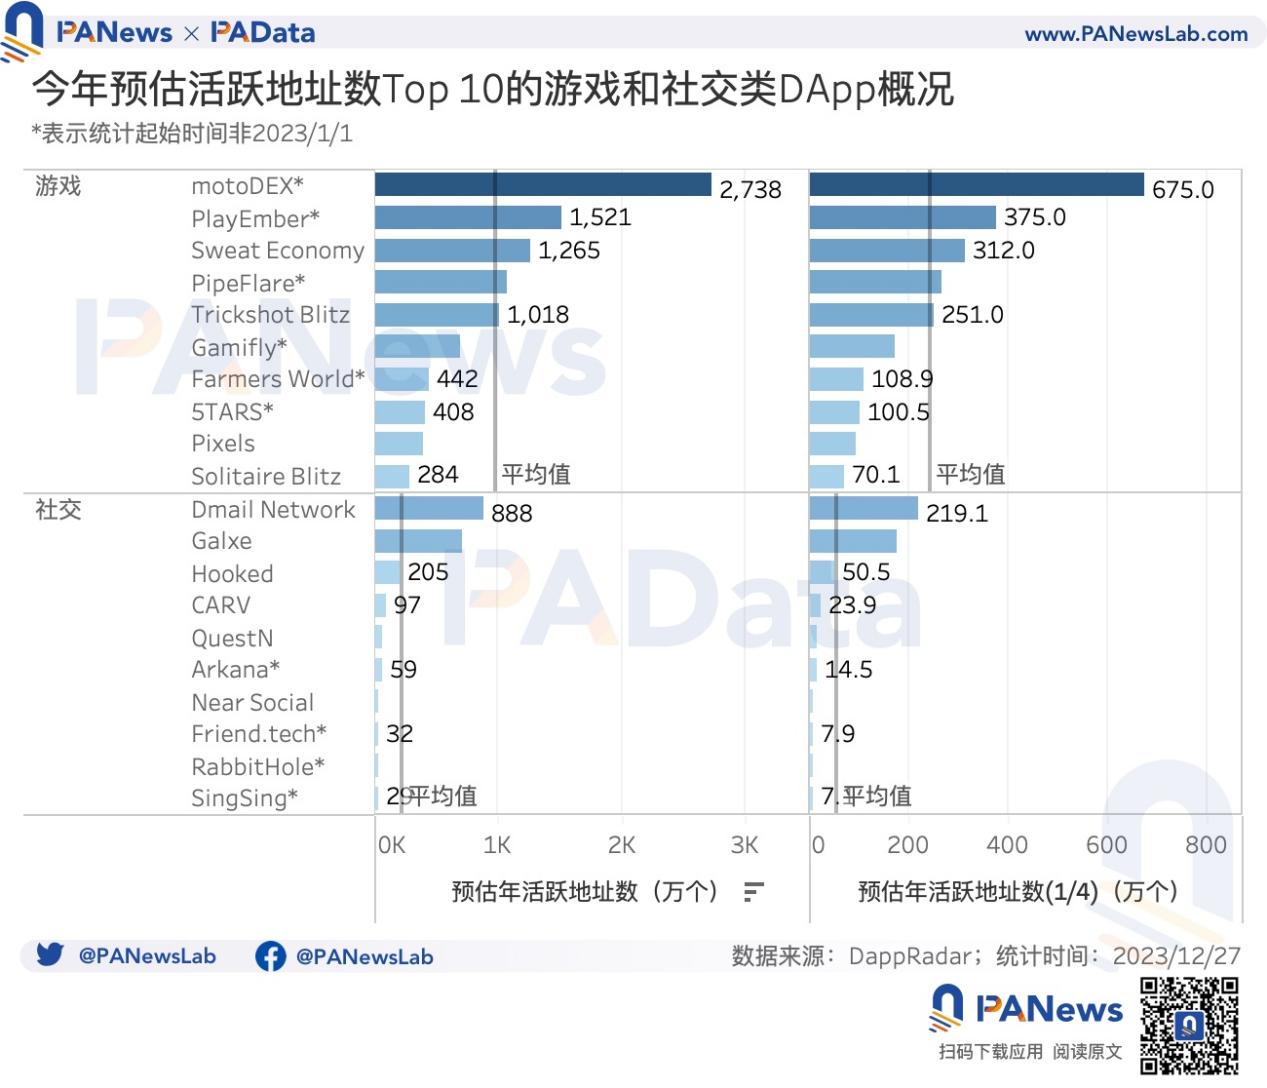
Beyond sustainability issues, these DApps also exhibited explosiveness. Most of the top 10 gaming and social apps achieved explosive cold starts toward year-end, resulting in extremely high annual growth in active addresses and transaction counts. For example, motoDEX saw active address growth of 2,134,650% and transaction count growth of 1,413,614%; Dmail Network achieved 22,094% growth in active addresses and 23,222% in transaction counts.
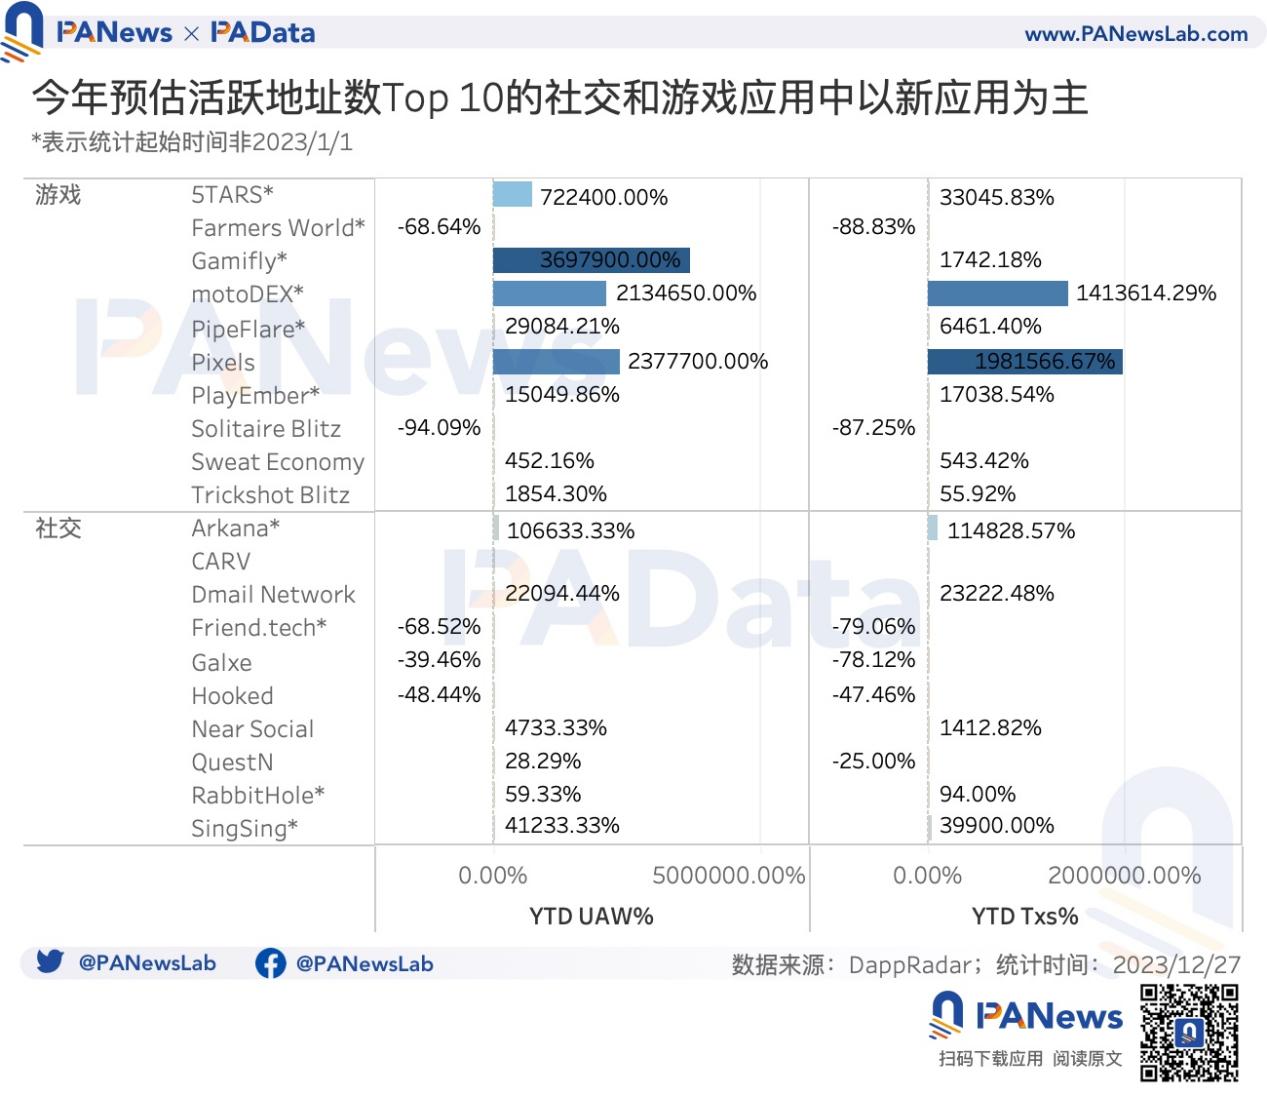
Additionally, the launch of new projects contributes to high annual growth metrics. Examples include Gamifly and 5TARS in gaming, and Arkana and RabbitHole in social.
Notably, Friend.tech differed from most new projects. After launching in August, it peaked in activity in October, reaching 73,700 active addresses on October 15, then declined steadily in both active addresses and transaction volume, showing a downward trend throughout the year.
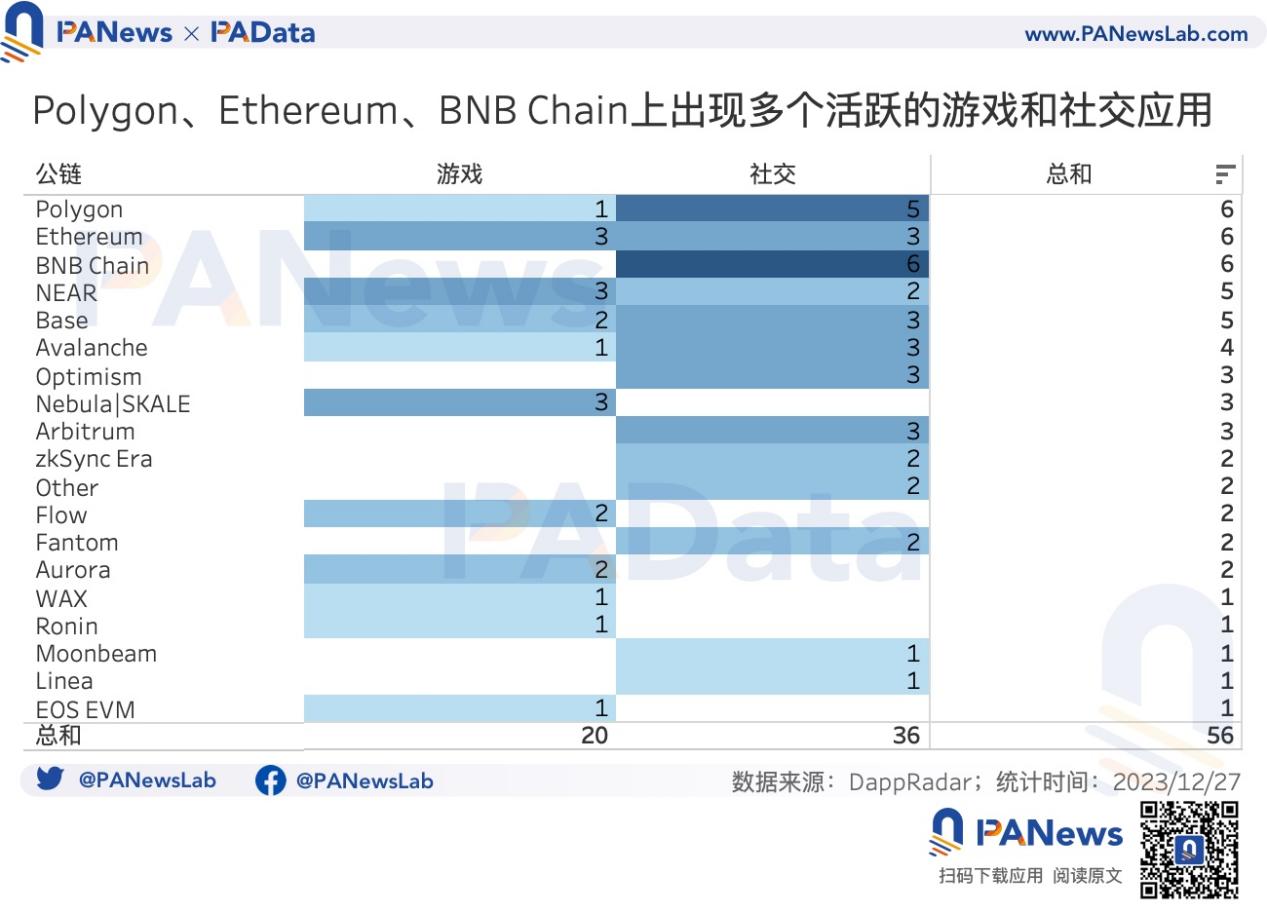
In terms of blockchain distribution, gaming projects showed more cross-chain deployment than social apps. Moreover, Polygon, Ethereum, BNB Chain, NEAR, and Base hosted a larger number of active projects.
Join TechFlow official community to stay tuned
Telegram:https://t.me/TechFlowDaily
X (Twitter):https://x.com/TechFlowPost
X (Twitter) EN:https://x.com/BlockFlow_News
 PANews