The First Crypto Market Bloodbath of 2024: Unveiling the TRB Whales' Pump-and-Dump Tactics
TechFlow Selected TechFlow Selected
The First Crypto Market Bloodbath of 2024: Unveiling the TRB Whales' Pump-and-Dump Tactics
The inside story of the first brutal "bloodbath" in 2024
Author: AICoin
Who would have thought that on January 1st we'd witness the first brutal "bloodbath" of 2024, leaving the market in collective agony!
In this silent battle, the whales once again deployed their classic pump-and-dump strategy. Many users may not understand the mechanics behind it—let us break it down in detail.
1. TRB is a heavily manipulated coin
First and foremost, it's crucial to recognize clearly: TRB is a coin tightly controlled by powerful whales!
So how can one identify such heavily manipulated coins? The best approach is on-chain data analysis, because large holders don’t keep most of their coins on exchanges—they move them on-chain.

On December 29, Spot On Chain tweeted that about 95% of TRB tokens are held by whales. While they mention 20 whale addresses, we can interpret this as extremely concentrated holdings.
Now, here’s a question for you: compared to Bitcoin’s 21 million supply, what is the total supply of TRB?
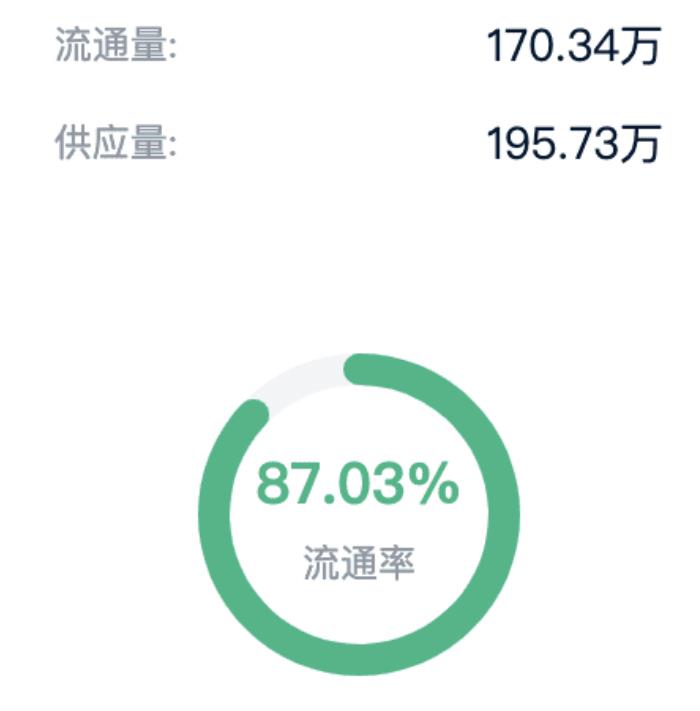
The answer: only 1.95 million coins!
Bitcoin, with its 21 million supply, has reached $40,000. So why couldn't TRB reach $1,000? That doesn't seem unreasonable. If $1,000 seems too high, then surely $500 should be achievable, right?! (Last night on OKX, TRB was already pumped to $700.)
But merely knowing it’s a whale-controlled coin isn't enough. Why?
Because without understanding the whale’s intentions—whether they plan to pump or dump—it's impossible to predict moves; everything depends entirely on the whale’s discretion.
That’s why we need the next tool:
2. Market Sentiment
How do we analyze market sentiment?
Here, we offer three key indicators: ① Open Interest; ② LSUR; ③ Funding Rate.
(1) Open Interest
How do we interpret open interest?
Below is the open interest trend just before the sharp rally:
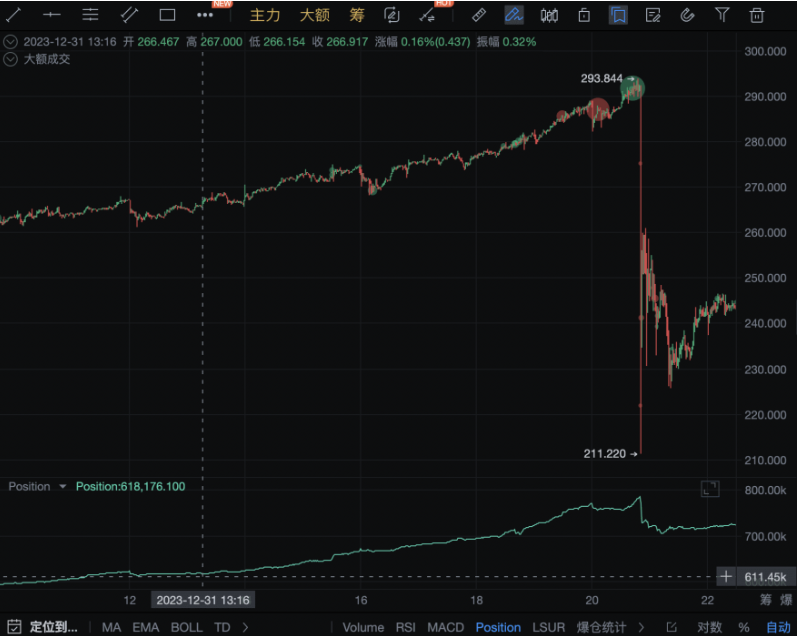
Price rising alongside increasing open interest indicates strong inflow of capital from large bulls.
But how can we distinguish whether these large positions are initiated by whales or retail traders?
This is where the second indicator—LSUR—comes into play.
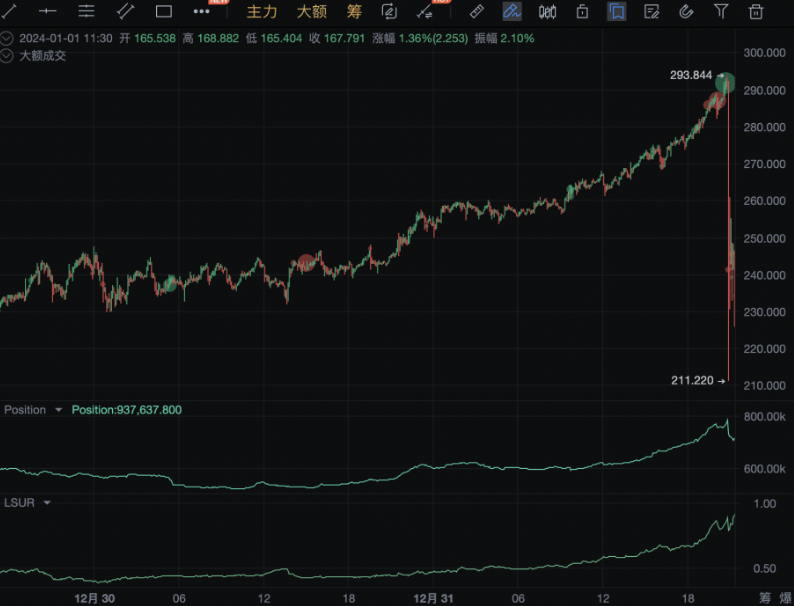
(2) LSUR
LSUR is an incredibly useful metric: LSUR > 1 means retail traders are long; LSUR < 1 means retail traders are short.
The chart below shows that during TRB’s price surge, LSUR also rose in tandem—indicating retail traders were joining the long side.
Now, imagine you're the whale holding TRB. What would you do?
Exactly—you’d initiate a shakeout. The severity depends solely on your conscience!
And so came last night’s first classic scene: a sudden plunge of 30% within minutes!
This shakeout was extremely brutal! A 30% drop wipes out any 3x leveraged long position. Even if you used conservative 3x leverage, you’d still get liquidated!
Why 3x leverage?
Because historically, Okcoin’s margin trading defaulted to 3x leverage, and over time people got used to using 3x for arbitrage, assuming it was safe.
After this shakeout, how many positions were liquidated? Look at how much open interest dropped—it roughly corresponds to around $30 million in liquidations.
Then, after TRB crashed 30%, what happened?
Right—major media outlets started reporting “TRB plunges 30%,” making headlines everywhere with soaring discussion volume!
What does this mean? TRB suddenly entered the public spotlight. Many who previously ignored TRB now became aware of it and began trading.
Traders’ attention is critical—without hype, even a pump cannot lead to successful distribution. But once attention peaks, the real game begins!
We continue relying on the LSUR indicator because it's simply too effective at revealing the positioning of whales versus retail traders.
Whales and retail traders are natural opponents—the more retail traders pile in, the better the whales eat. Let’s examine how retail sees TRB.
After the crash, most believed a rebound was imminent, so they went long. Following the dip, we saw clear retail long buildup confirmed by a sharp rise in the LSUR indicator.
Our analysis aligns with LSUR data—TRB had bullish momentum ahead.
What happens next?
Now we bring in our whale order flow indicator!
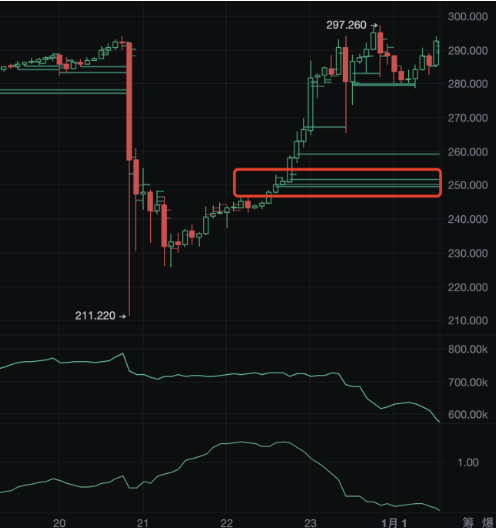
$250 was a key threshold. Whale order data showed that beyond this level, large buyers consistently placed buy orders below the current market price.
Why operate like this?
To attract market-making bots and high-frequency trading algorithms that rely on OBI (order book imbalance) strategies. By placing massive buy walls, the whales induced these bots to aggressively buy at market price, effectively pushing the price upward—a classic tactic seen last night.
At 11 PM last night, after TRB returned to its previous levels, what occurred?
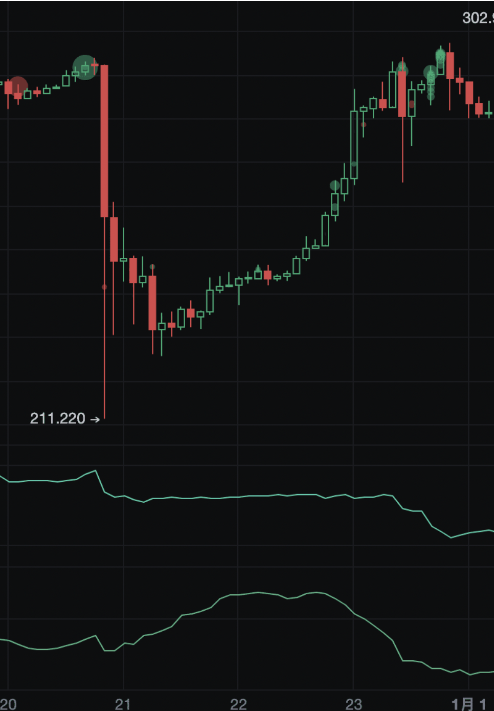
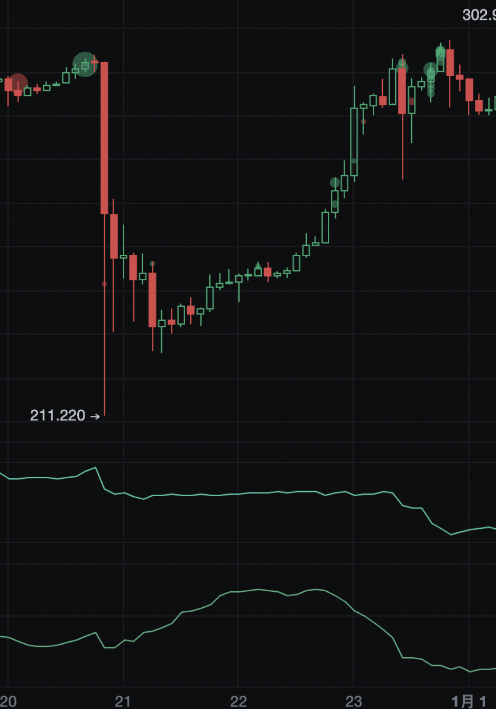
Price consolidation, declining open interest, and falling LSUR. What does this signal?
It suggests traders believed TRB had peaked and began closing longs. As positions unwound, open interest dropped. Meanwhile, retail started shorting, causing LSUR to fall.
After hovering near $290 for an extended period, we naturally assumed resistance above. All signs indicated bearish retail sentiment—if price rose, retail would stubbornly short.
At this point, a clear divergence emerged: whales bullish, retail bearish.
Hunting season began!!!
And remember—it was late at night, New Year’s Day. People were spending time with family, celebrating, sleeping... This is precisely why the explosive rally launched at midnight and ended by morning—to target users in the UTC+8 timezone!
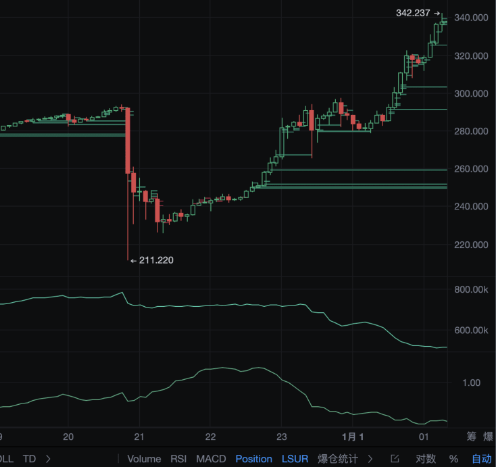
This chart is textbook: massive whale buy orders propping up price while LSUR keeps dropping.
Why didn’t the price fall?
Because whenever retail tried to buy, the whale had already bought ahead and was ready to sell at higher prices.
From $250 to $464—an 80% surge—how much capital did the whale deploy?
Answer: $40 million! With just $40 million in large limit orders, the whale pushed the price from $250 to $464. Any further pumps afterward were part of the distribution phase. The main impulse wave—from $250 to $464—cost the whale approximately $40 million.

The whale’s playbook is always: accumulate, shake out, pump, distribute, and dump. The pump phase has ended; now enters the distribution phase. And the best way to distribute? Pump and dump!
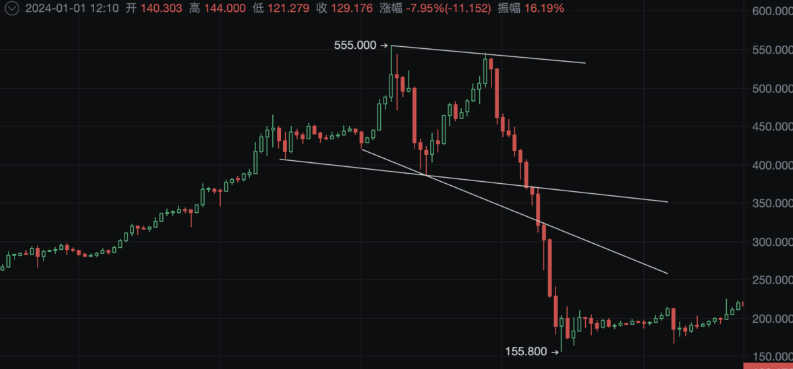
Let me sketch a simple pattern: after the pump ends, the whale starts distributing. After sideways consolidation, a sudden spike pulls in technical analysts, then a rapid drop triggers stop-losses. This tests the mental strength of TA traders. When price fell back to ~$464, it was clearly distribution. Now, deep pullbacks lure retail buyers back in, gradually pushing price higher. But since the whale keeps selling, price advances slowly and fails to break previous highs.
However, note that in crypto markets, the second top often breaks the prior high to trigger short stops before collapsing. In this case, the whale showed some mercy—otherwise, breaking the high to liquidate shorts before crashing would’ve caused unbearable pain.
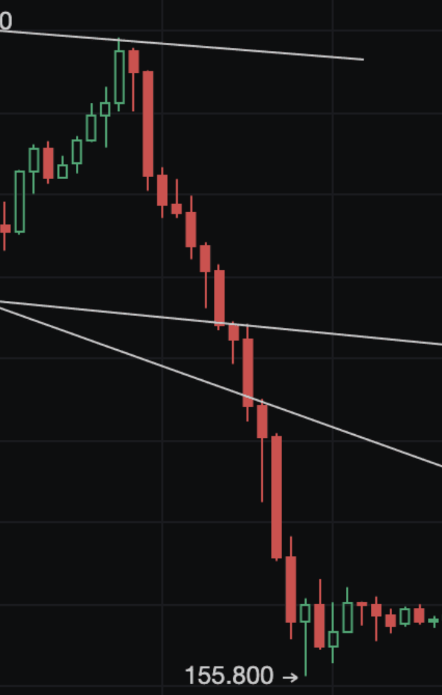
Mercy exists—but barely. Because he delivered a devastating 70% crash! This drop exceeded 99% of traders’ expectations!
How could this happen? Because this is a capital-controlled coin, not one driven by fundamentals or technicals.
So how did retail react during the decline?
Back to LSUR and open interest analysis: retail loves buying the dip and holding through drawdowns. During the drop, both open interest and LSUR rose—confirming retail was accumulating longs.
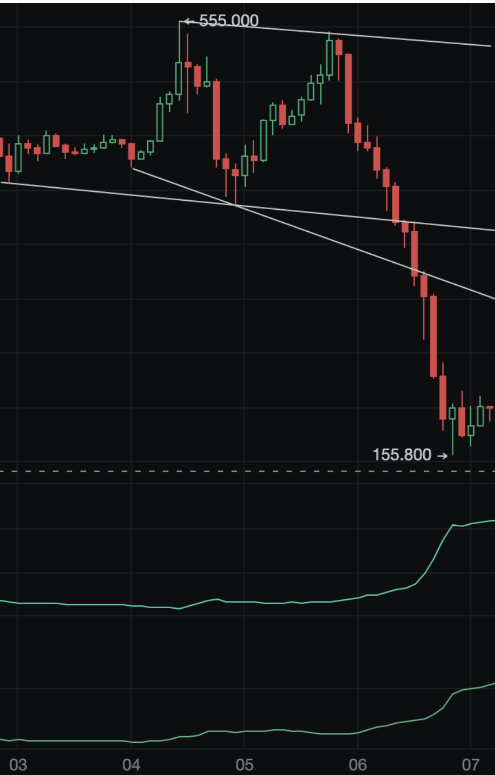
Also, notice the peak at $555—isn’t that humorous? (Think of it as order book language: 555 means “crying” in Chinese internet slang—“I’m dumping, go cry.” A similar scenario happened earlier on OKX BTCUSDT perpetual at $44,444.)
Now let’s discuss the explosive funding rate!
3. Funding Rate
Last night, Binance collected funding fees every 4 hours, with TRB capped at ±2%. A -2% funding rate, collected every 4 hours, was highly tempting.
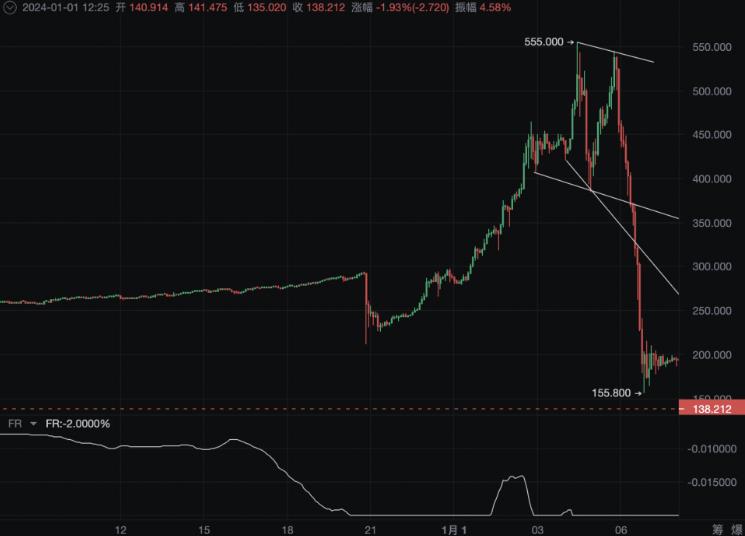
A -2% funding rate means most in the futures market were shorting TRB, driving its price below spot value.
Retail was short, so whales must have been long. LSUR data confirmed this—multiple data sources converged on the same conclusion.
But most directional traders rarely pay attention to funding rates. Who does?
Correct—arbitrageurs!
What arbitrage opportunity emerged last night? With negative funding on TRB, reverse cash-and-carry arbitrage seemed viable. But it requires holding actual TRB. Whales typically borrow all available supply beforehand to prevent interference—so reverse arbitrage usually fails. Thus, arbitrageurs resort to dual-exchange strategies.
Applied to TRB: go long TRB/USDT on Binance, short TRB/USDT on OKX.
Why? To capture the funding rate differential every settlement:
Binance funding: -2% per 4h → -8% over 8h
OKX funding: -1.5% per 8h → -1.5% over 8h
Net 8-hour gain: 6.5%. Since it's hedged, risk appears low. Hence, most arbitrageurs jumped in last night.
But arbitrage carries risks—especially cross-exchange. Key risks: exchange withdrawal suspension (causing uncontrollable spread), or extreme price moves blowing up one leg. If quickly closed, losses are manageable. But if left open, it creates massive unilateral exposure.
Then we saw OKX hit $700+. Due to shallow depth and arbitrageurs being short there, cascading short liquidations drove OKX far above Binance. That $700+ price on OKX was essentially created by chain-reaction short squeezes among arbitrageurs.
Of course, there are other spread-trading strategies that, if executed well, can be highly profitable.
Arbitrageurs are vital market participants, but poor risk management leads to disaster. Last night, TRB became an arbitrageur’s nightmare—many got wiped out. Always enforce strict risk controls, set hard stop-losses, avoid letting small losses become catastrophic. Alternatively, following whale order flow could have yielded substantial gains.
TRB has now completed its distribution and dump phase. Given the massive number of liquidations, no significant new movement is expected soon. Any future rally would require fresh accumulation and another shakeout cycle.
Summary
The post-mortem of TRB’s bloodbath concludes here. To profit from such events, leverage these methods:
1. Identify heavily manipulated coins
2. Detect anomalies in funding rate, LSUR, and open interest
3. Analyze whale capital flows using large trade data
4. Enforce strict stop-loss discipline
Tracking whale order flow is the optimal way to follow smart money. Whether buying or selling, large moves eventually appear on the order book. As long as there are orders and trades, we can monitor them—so make sure to use these tools wisely!
Join TechFlow official community to stay tuned
Telegram:https://t.me/TechFlowDaily
X (Twitter):https://x.com/TechFlowPost
X (Twitter) EN:https://x.com/BlockFlow_News