
Glassnode: Bitcoin Embarks on a "Round-Trip Journey," Rally Appears to Encounter Resistance
TechFlow Selected TechFlow Selected
Glassnode: Bitcoin Embarks on a "Round-Trip Journey," Rally Appears to Encounter Resistance
Bitcoin faces short-term trend adjustment this week as demand saturation signals emerge from significant profit-taking by short-term holders following the new high突破.
 Navigating Web3 tides with focused insights
Author: CryptoVizArt, Glassnode
Translation: Baihua Blockchain
Key Takeaways: Bitcoin's strong upward trend encountered resistance this week, breaking out to a new yearly high of $44,500 before experiencing the third-largest sell-off of 2023. Some on-chain pricing models suggest that "fair value," based on investor cost basis and network throughput, is lagging and may hover between $30,000 and $36,000 in the coming period. In response to the strong price surge over recent months, short-term holders (STHs) have taken profits at statistically significant levels, contributing to a pause in Bitcoin’s rally. The market completed a round-trip this week, opening at $40,200, rebounding to an annual high of $44,600, then sharply selling off back to $40,200 by Sunday night. The move toward the yearly peak included two daily rallies exceeding +5.0% (a +1 standard deviation move). The subsequent sell-off was equally forceful, dropping over $2,500 (-5.75%), marking the third-largest single-day decline in 2023. As we reported last week, Bitcoin has performed exceptionally well this year, up more than 150% year-to-date, outperforming most other assets. With this in mind, as year-end approaches, it becomes increasingly important to monitor how investors respond to newly realized paper gains.
1. Navigating Cycles with On-Chain Pricing Models
A useful set of tools for navigating market cycles involves investor cost basis metrics derived from on-chain transactions across different cohorts. The first such model we consider is Active Investor Realized Price, which calculates a comparative “fair value” for Bitcoin under our Cointime Economics framework. This model applies a weighting factor to realized price based on supply scarcity (HODLing) across the entire network. Large-scale accumulation restricts supply, increasing the estimated “fair value,” and vice versa. The chart below highlights periods when spot prices traded above the classic Realized Price (lower-bound model) but below cyclical all-time highs. From this, we draw several observations: Historically, the time interval between a successful breakout above Realized Price and the creation of a new ATH ranges from 14 to 20 months (11 months so far in 2023). The path to a new ATH always involves large oscillations of ±50% around the Active Investor Realized Price (shown as oscillators per cycle). If history serves as a guide, it suggests a roadmap of volatility over the coming months centered around this “fair value” model—currently around $36,000.
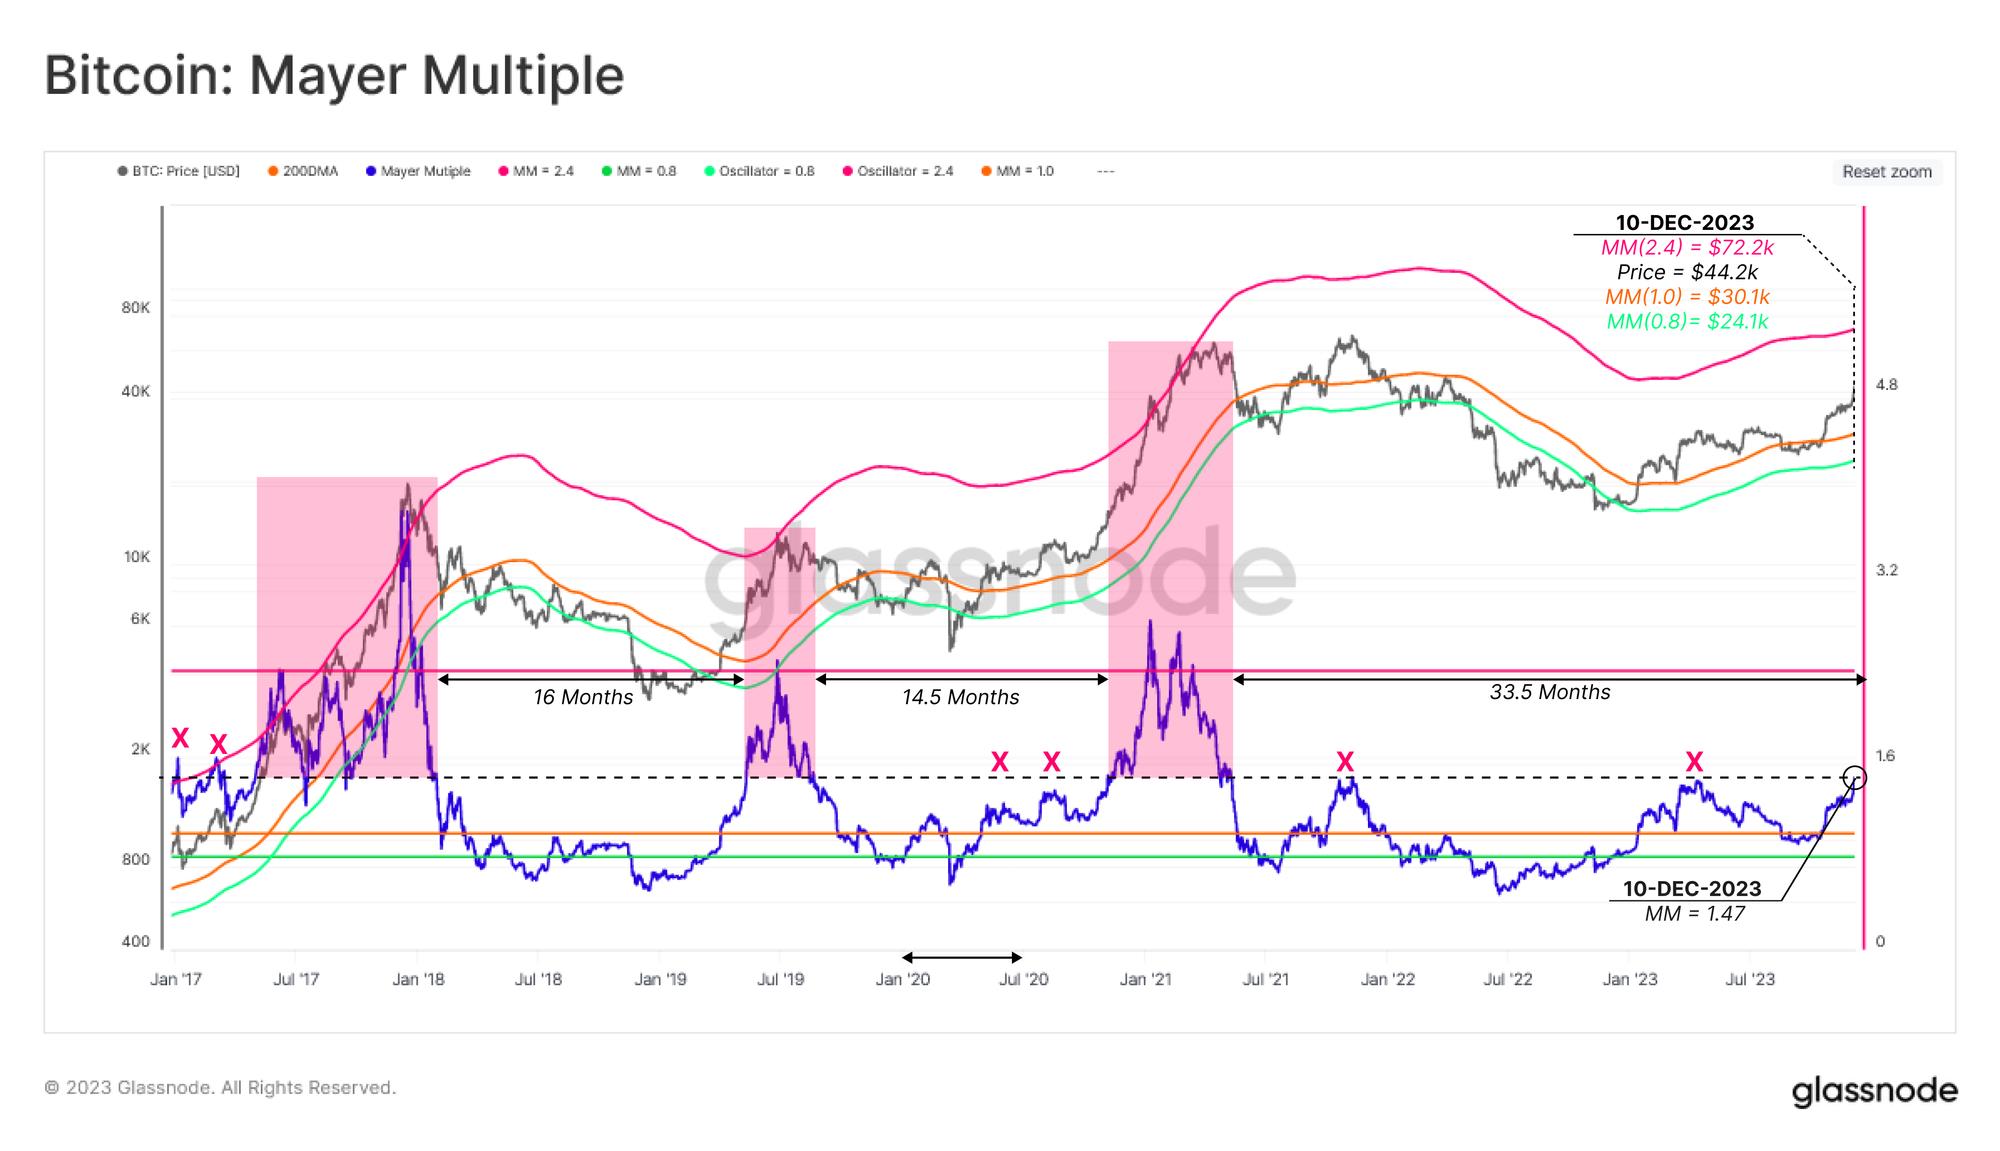
The Mayer Multiple is another popular technical pricing model for Bitcoin, simply describing the ratio between price and its 200-day moving average. The 200-day MA is widely recognized as a benchmark for establishing macro bull or bear market bias, making it a useful reference point for assessing overbought and oversold conditions.
Historically, overbought and oversold conditions align with Mayer Multiple values above 2.4 or below 0.8, respectively.
The current value of the Mayer Multiple indicator is 1.47, approaching the ~1.5 level, which typically acted as resistance in prior cycles—including during the November 2021 ATH. Perhaps as an indicator of the severity of the 2021–22 bear market, it has now been 33.5 months since this level was last breached—the longest such period since the 2013–16 bear market.
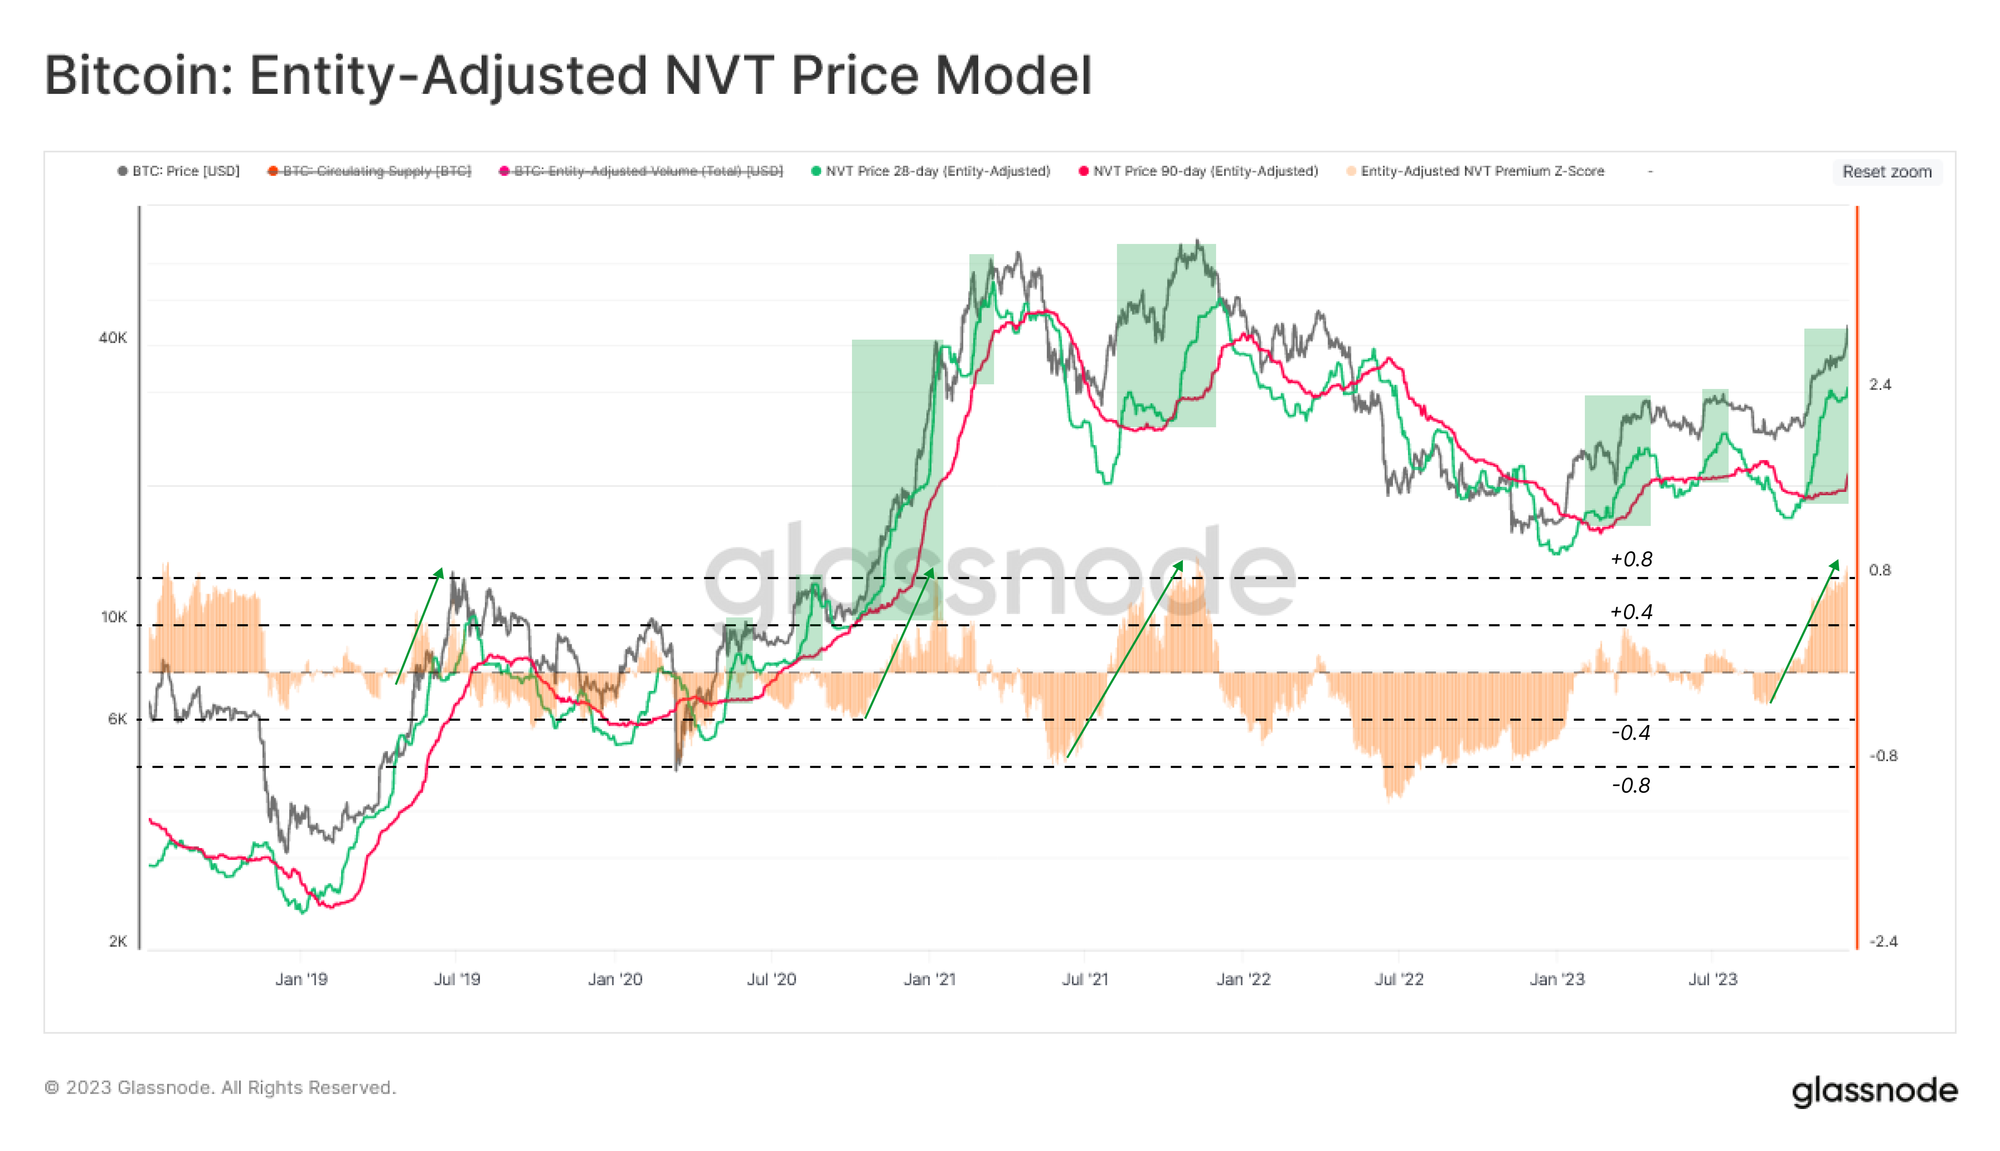
Another perspective on assessing Bitcoin’s “fair value” is through the NVT Price model, which translates on-chain activity into the price domain. The NVT Price seeks fundamental valuation of the network based on its utility as a dollar-denominated value settlement layer.
Here, we examine both the 28-day and 90-day variants, providing a pair of fast and slow signals. A typical bear-to-bull transition phase sees the 28-day variant trading above the 90-day model—a condition that has held since October.
NVT Premium can also be used to assess spot pricing relative to the slower 90-day NVT Price. The recent rally marked one of the most extreme spikes in the NVT Premium indicator since the market peaked in November 2021, suggesting a potential signal of short-term “overvaluation” relative to network throughput.
2. Marginal Investors
Previously, we explored how new investors—also known as Short-Term Holders (STHs)—exert significant influence in shaping short-term price movements, such as local tops and bottoms. Conversely, long-term holder activity tends to dominate when markets reach macro extremes, such as breaking new ATHs or during painful capitulation events and bottom formations.
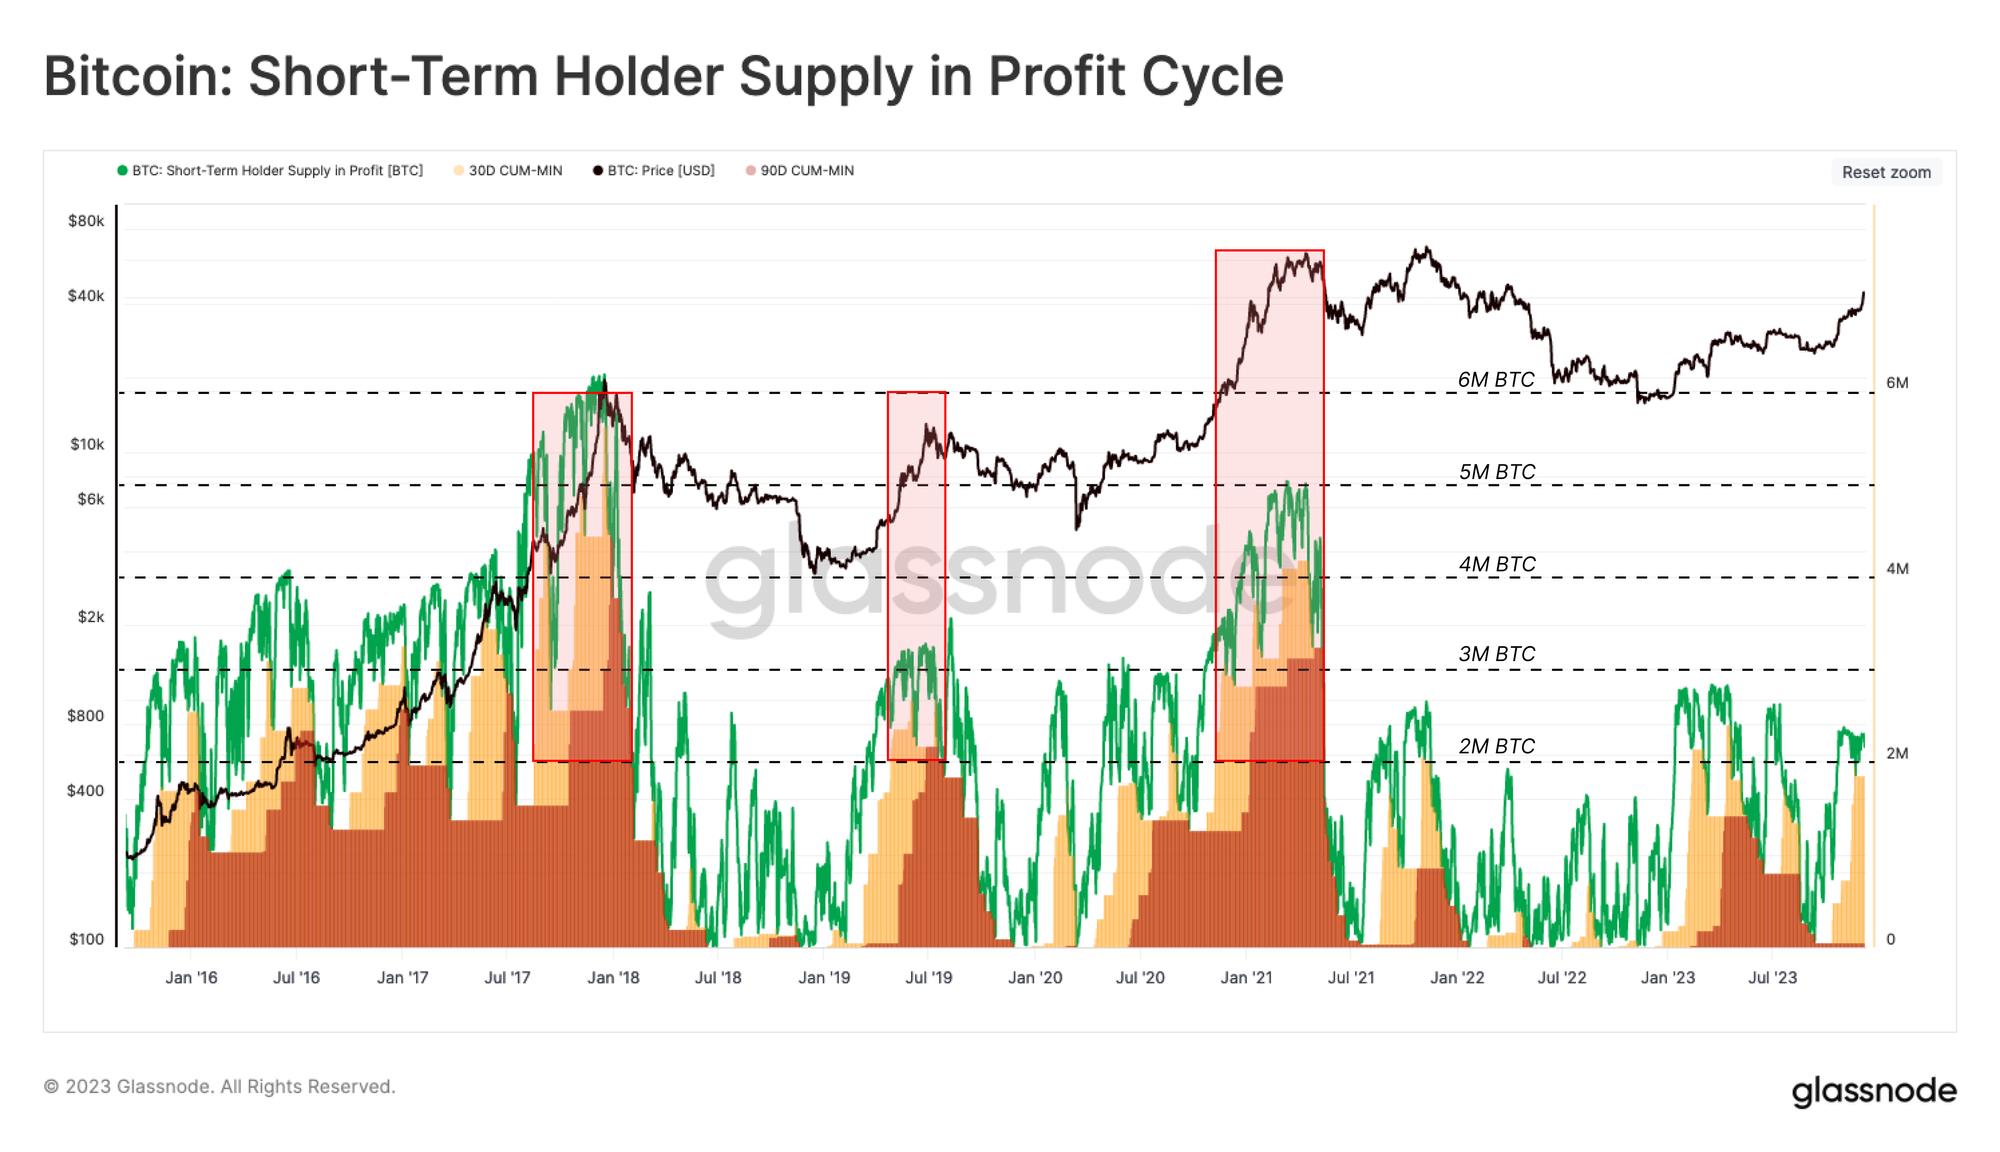
To reinforce the impact of STH behavior, the chart below highlights the relationship between price movements (trend and volatility) and changes in profitability within this investor cohort:
STH Profitable Supply: The number of tokens held by STHs that are “in profit,” meaning their cost basis is below the current spot price.
-
30D-Floor: The lowest level of “profitable” STH token supply observed within the past 30 days.
-
90D-Floor: The lowest level of “profitable” STH token supply observed within the past 90 days.
These 30D and 90D indicators allow us to measure the proportion of STH capital that is “in profit” across different time windows. In other words, we can compare these traces to gauge how many STH tokens are in profit within 30 days, between 30 and 90 days, or beyond 90 days.
Historically, rallies to new ATHs coincide with the 90-day holding metric reaching above 2 million BTC, indicating this cohort holds with moderately longer holding durations (a strong investor base). The rally since October has primarily lifted the 30-day variant, suggesting a solid STH base has yet to form since trading above the mid-cycle level of $30,000.
We also note that traces in 2023 are relatively low compared to past cycles, reinforcing the tight supply conditions discussed earlier.
3. Short-Term Fear and Greed
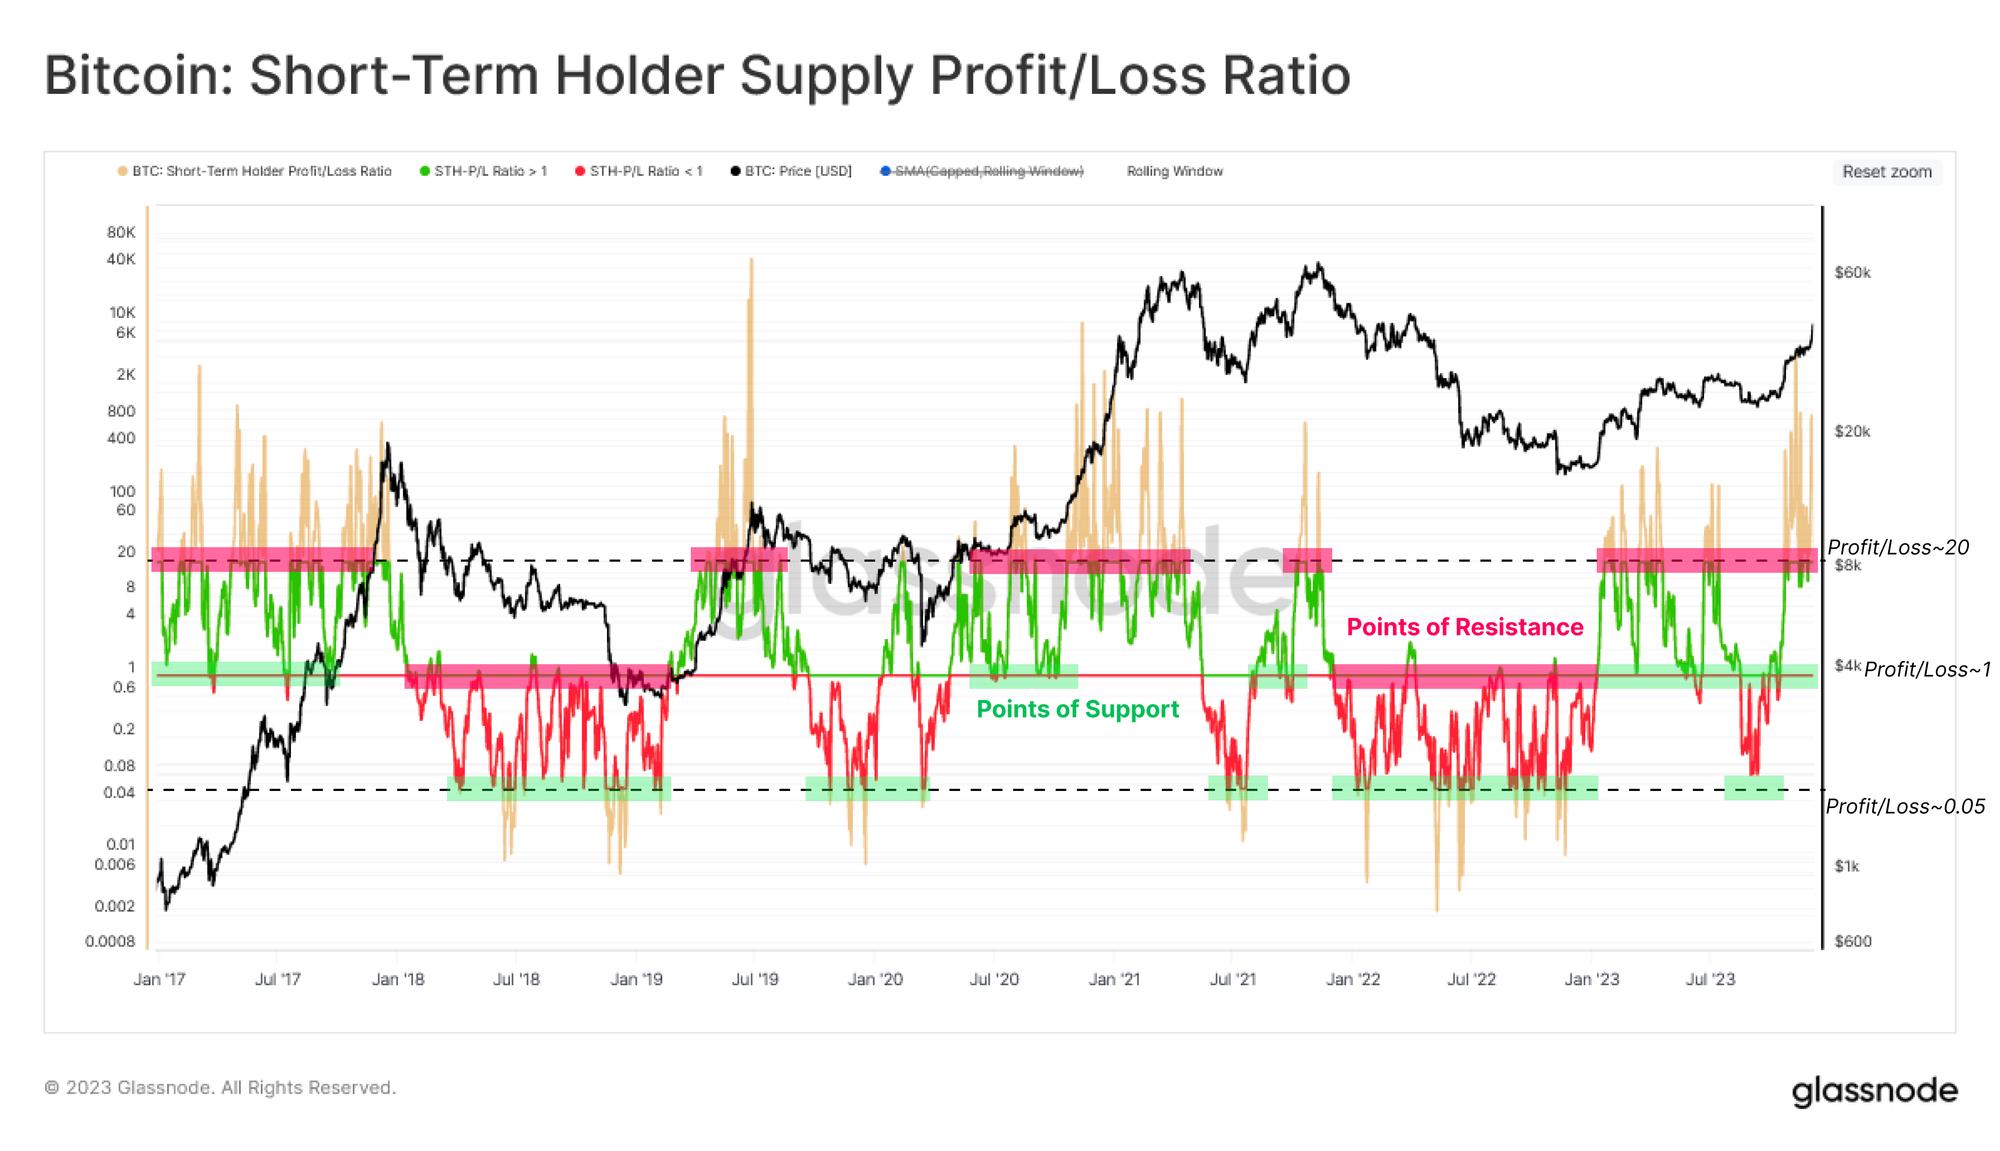
Next, we build a tool to identify periods of heightened fear and greed among these new investors, focusing on overbought (tops) or oversold (bottoms) signals. We previously discussed the STH Supply Profit/Loss Ratio, which provides the ratio of unrealized gains to losses. As shown in the chart below:
Historically, a profit/loss ratio > 20 corresponds with overheated conditions.
Historically, a profit/loss ratio < 0.05 aligns with oversold conditions.
A profit/loss ratio ~1.0 indicates breakeven and often coincides with support/resistance levels within the prevailing market trend.
Since January, this indicator has traded above 1, undergoing multiple retests and finding support at this level. Historically, such patterns are associated with the “buy-the-dip” investor behavior typical during uptrends.
We also note that the October rally pushed this indicator far above the overheated threshold of 20, indicating elevated risk conditions and a “hot” state similar to the NTV-Premium indicator.
The above oscillator illustrates the unrealized profit/loss held by STHs, which can be seen as their “spending incentive.” The next step is to assess whether these new investors act by realizing profits (or losses), returning supply to the market and creating seller-side resistance.
The chart below depicts four different measures of STH Realized Profit/Loss (all normalized by market cap):
-
STH Exchange-Traded Profit Volume and STH Realized Profit
-
STH Exchange-Traded Loss Volume and STH Realized Loss
The key insight from this analysis is identifying periods when readings of realized profit/loss and exchange-traded volume diverge significantly. In other words, when STHs send large volumes of tokens to exchanges and the average difference between acquisition and disposal prices is substantial.
With this in mind, this week’s rise to $44,200 triggered intense profit-taking activity, indicating this group responded to liquidity demand by acting on paper gains.
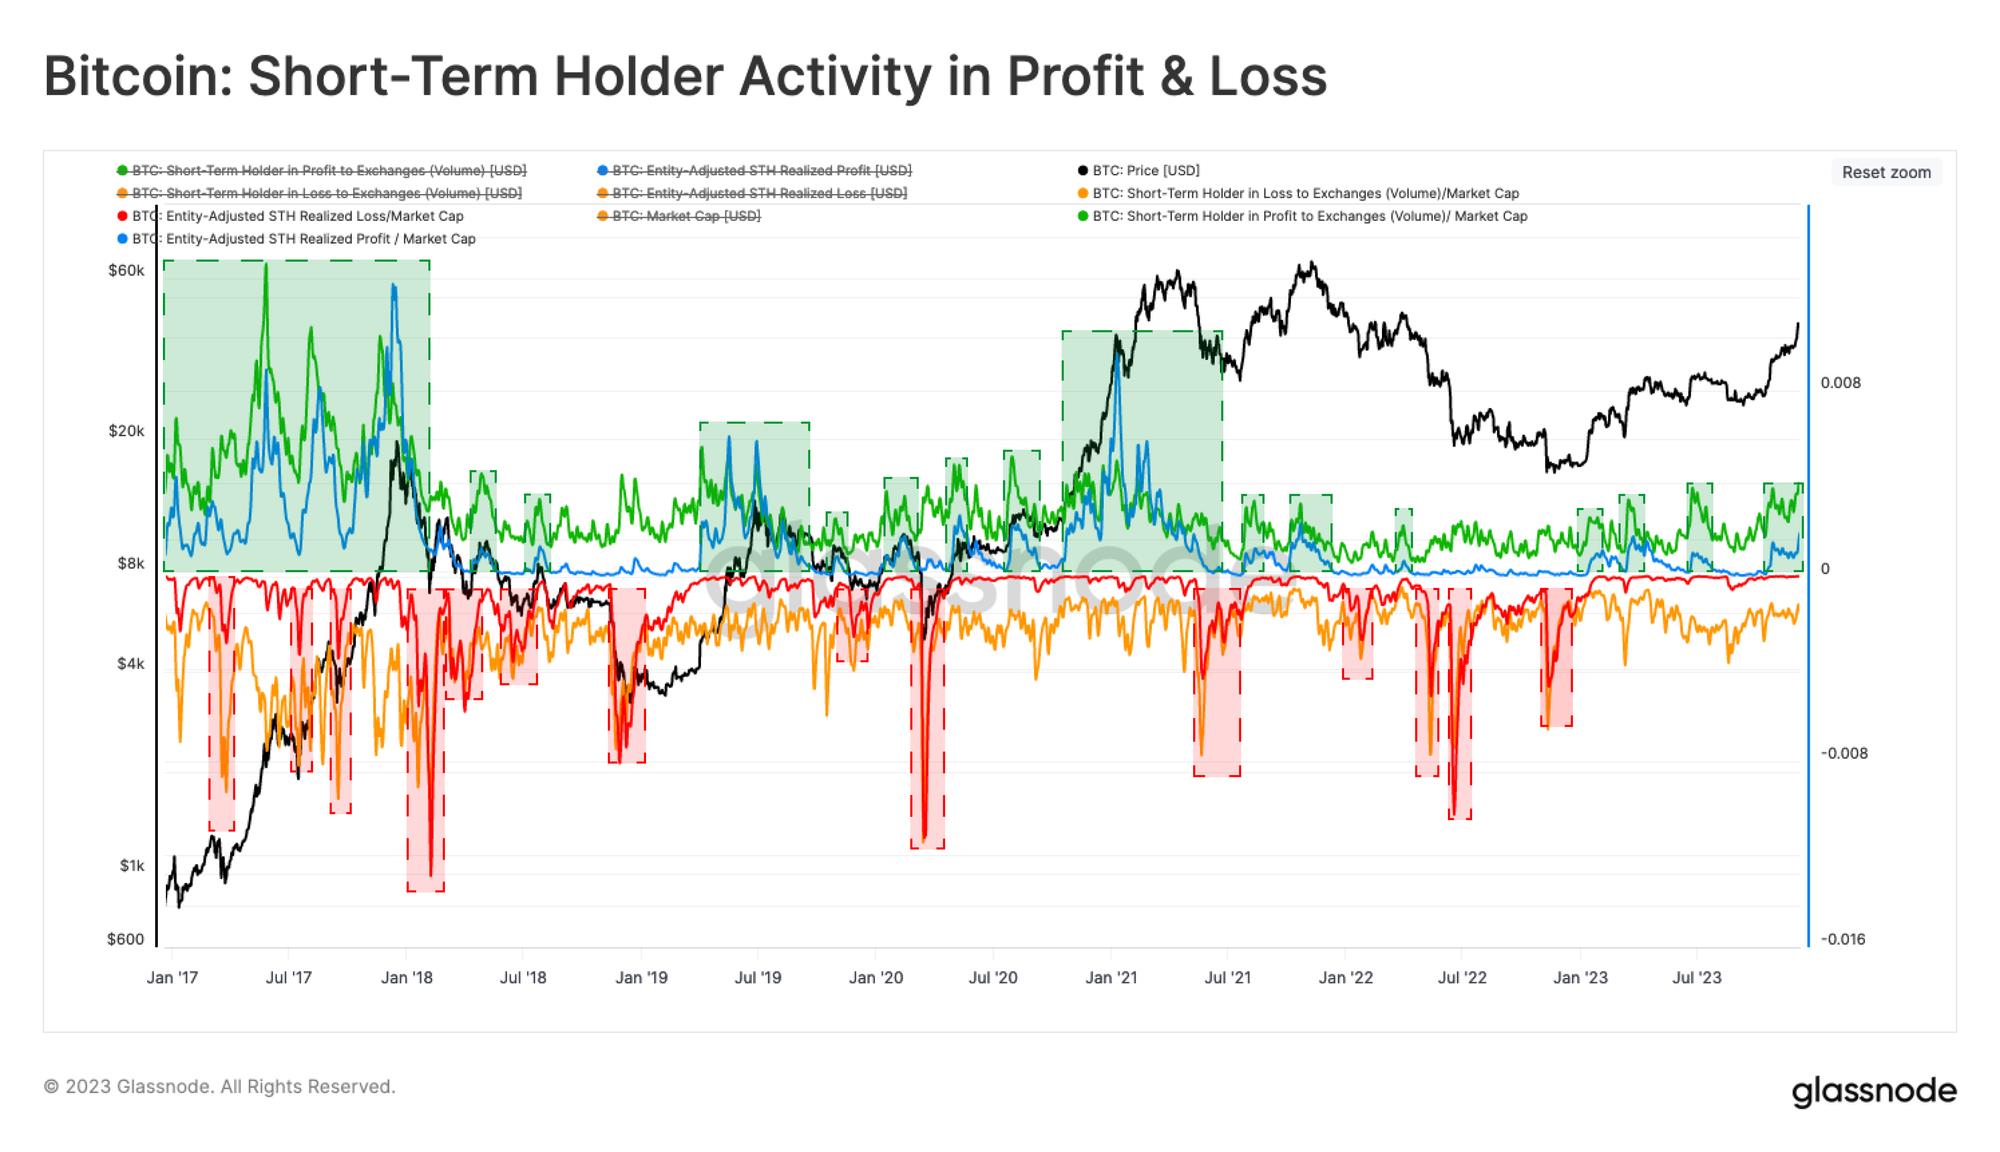
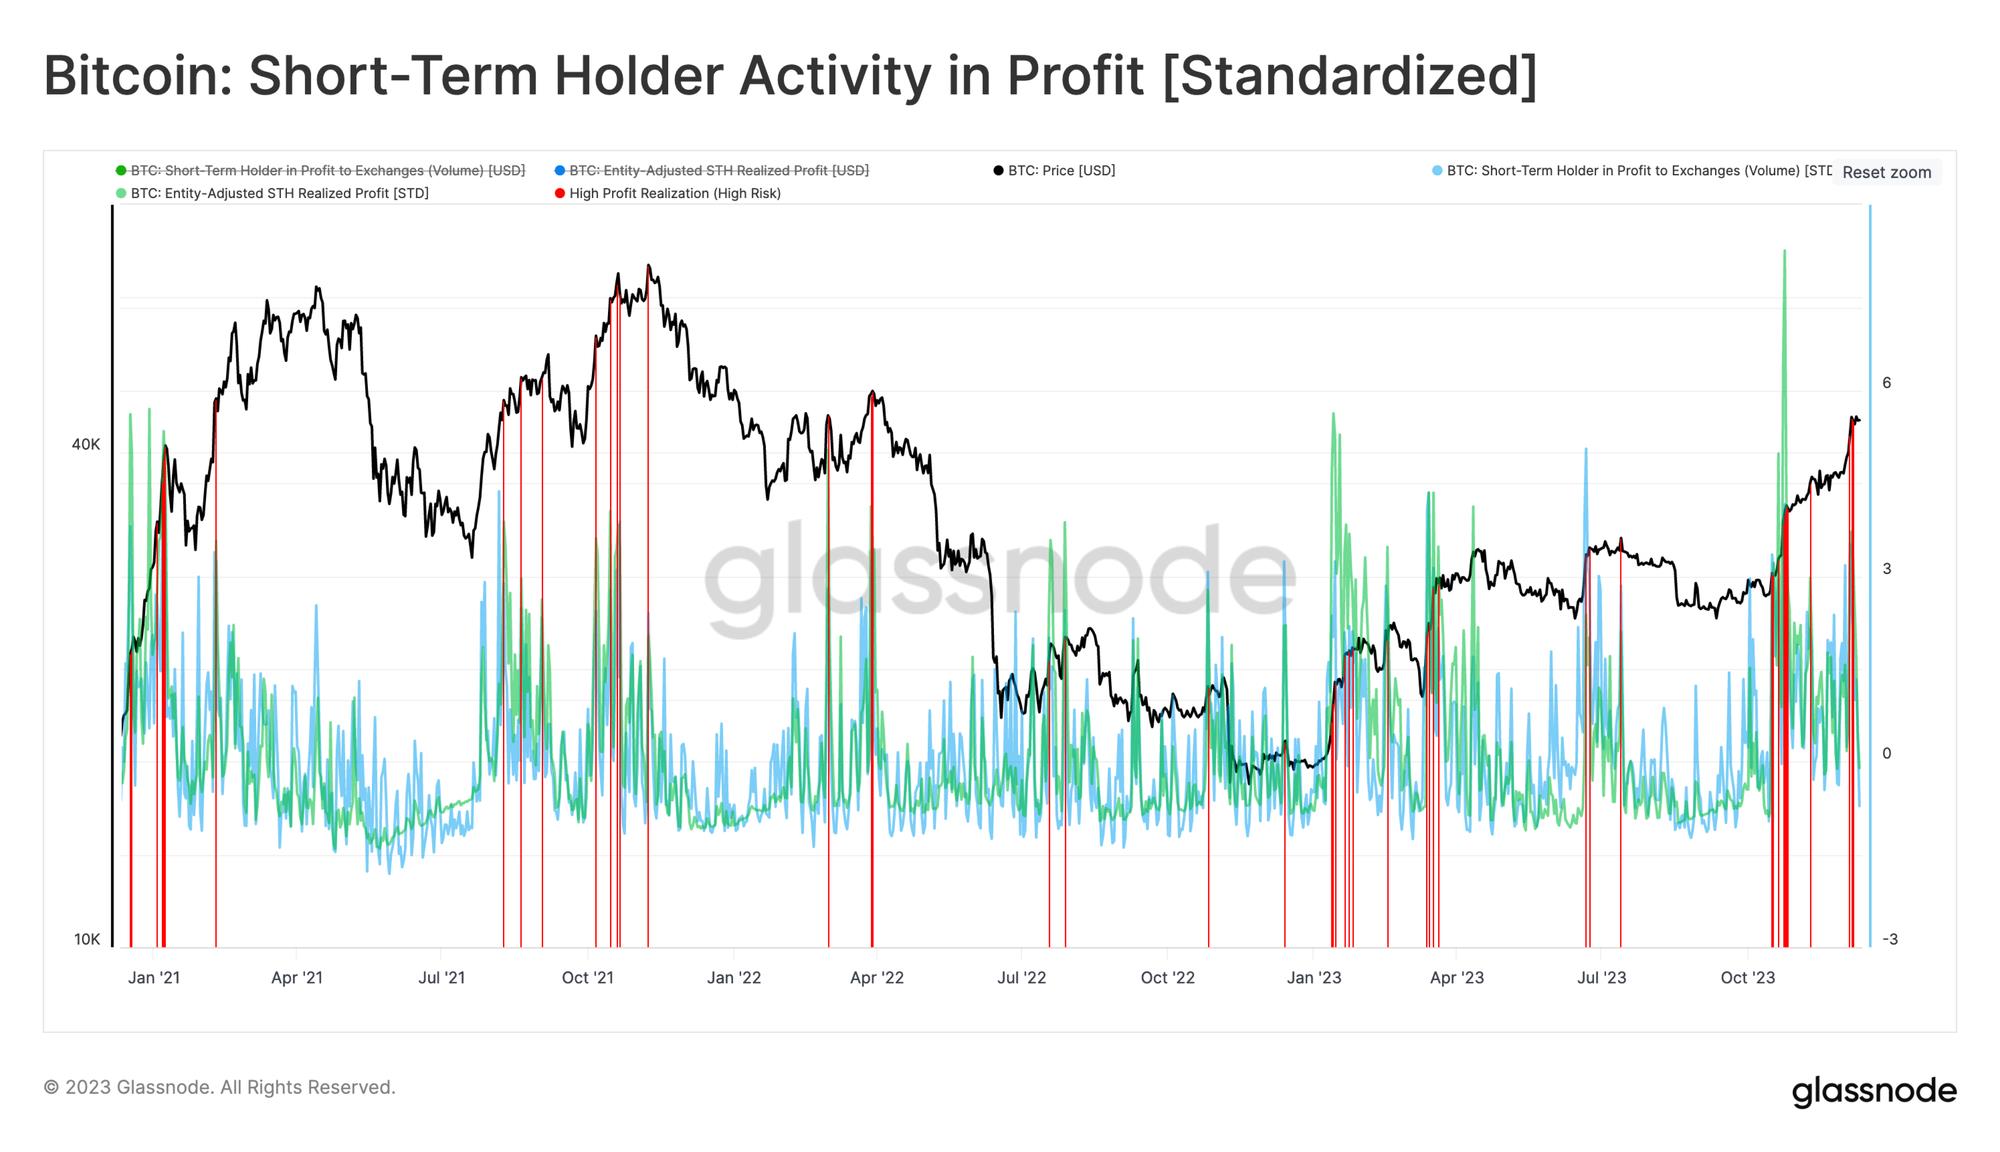
We can further refine this observation by highlighting days when STH realized profit exceeds the 90-day average by more than one standard deviation. We can see that this metric reached local peaks over the past three years.
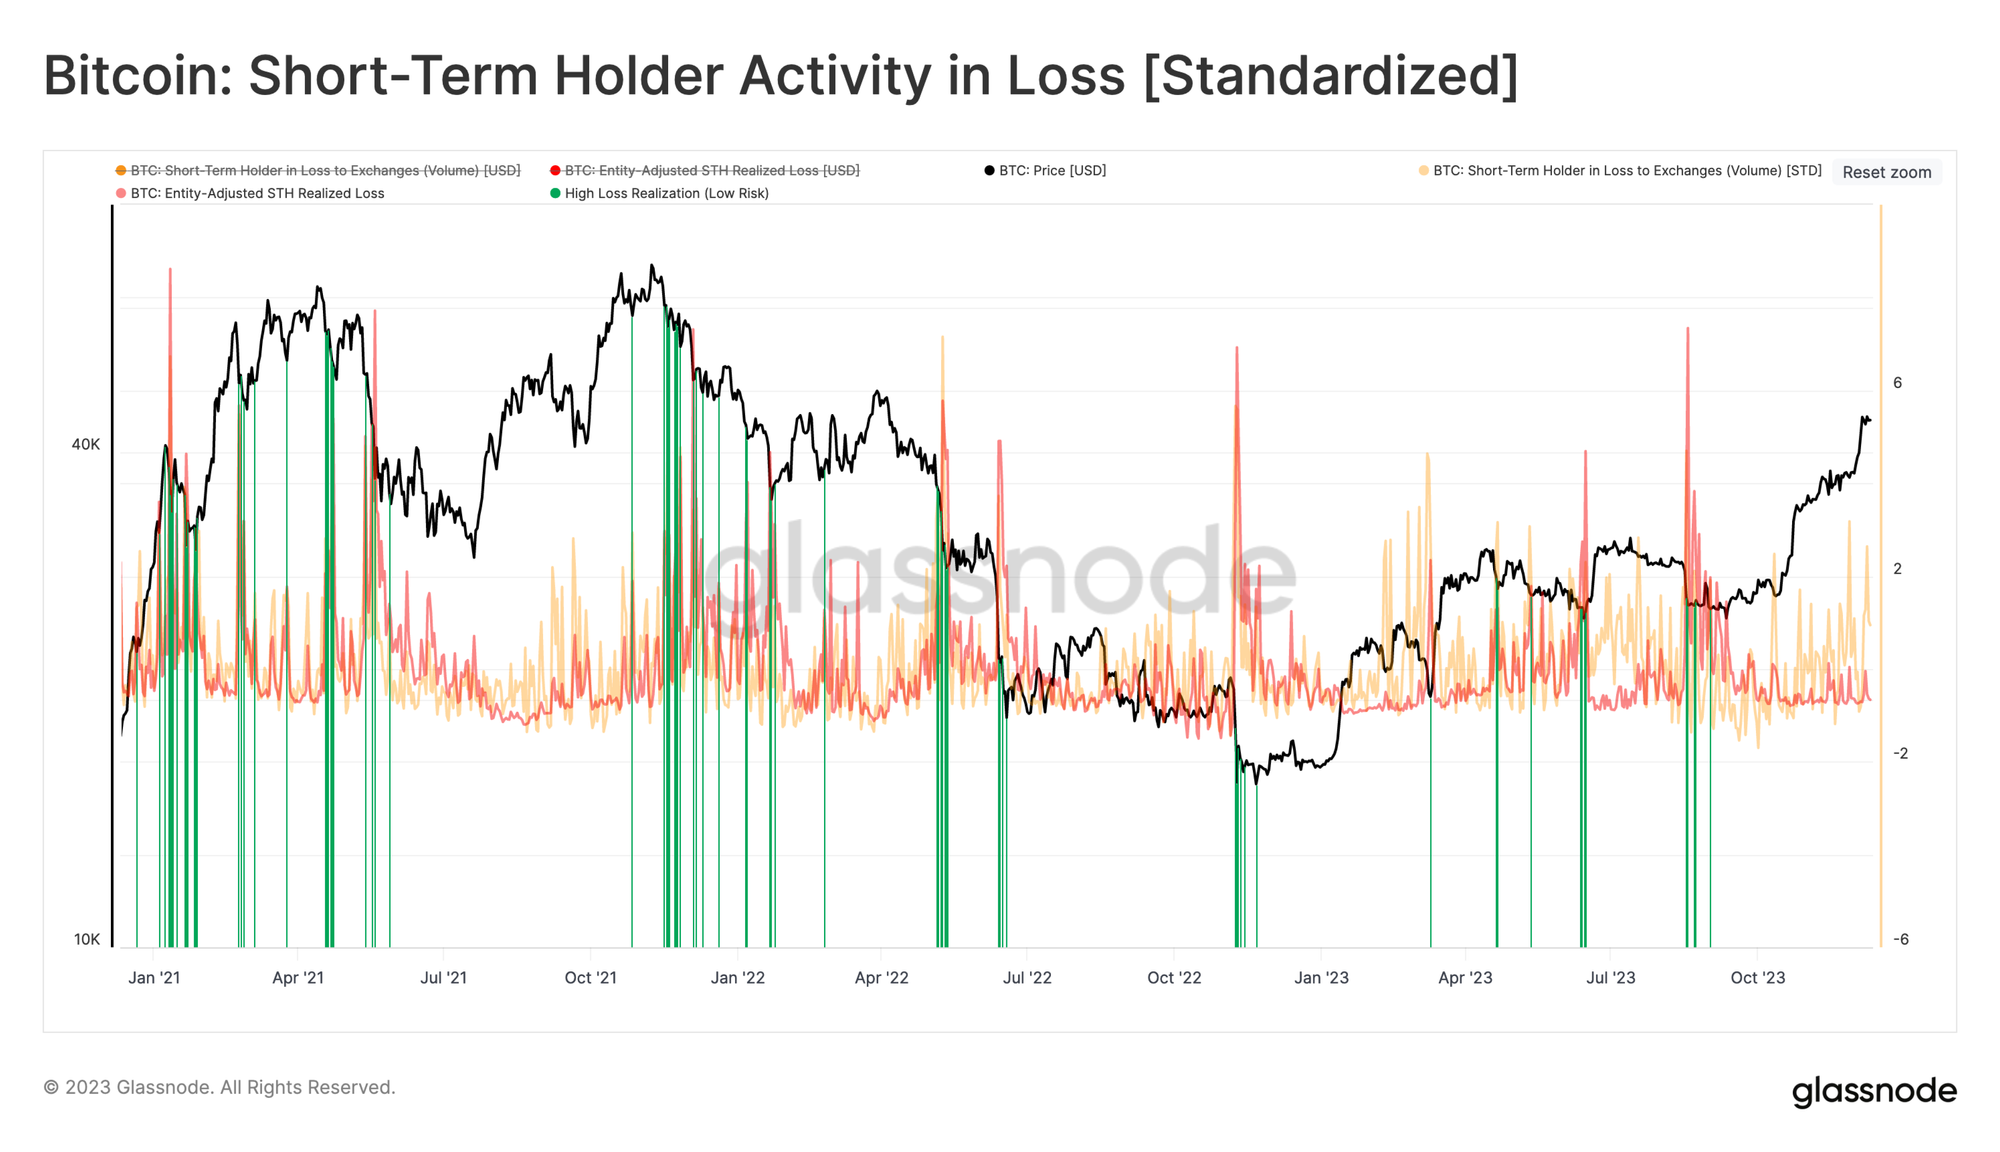
Using the same methodology, periods of high STH losses typically reach one standard deviation levels during major sell-offs, indicating panic among investors who return recently acquired tokens to exchanges for loss realization.
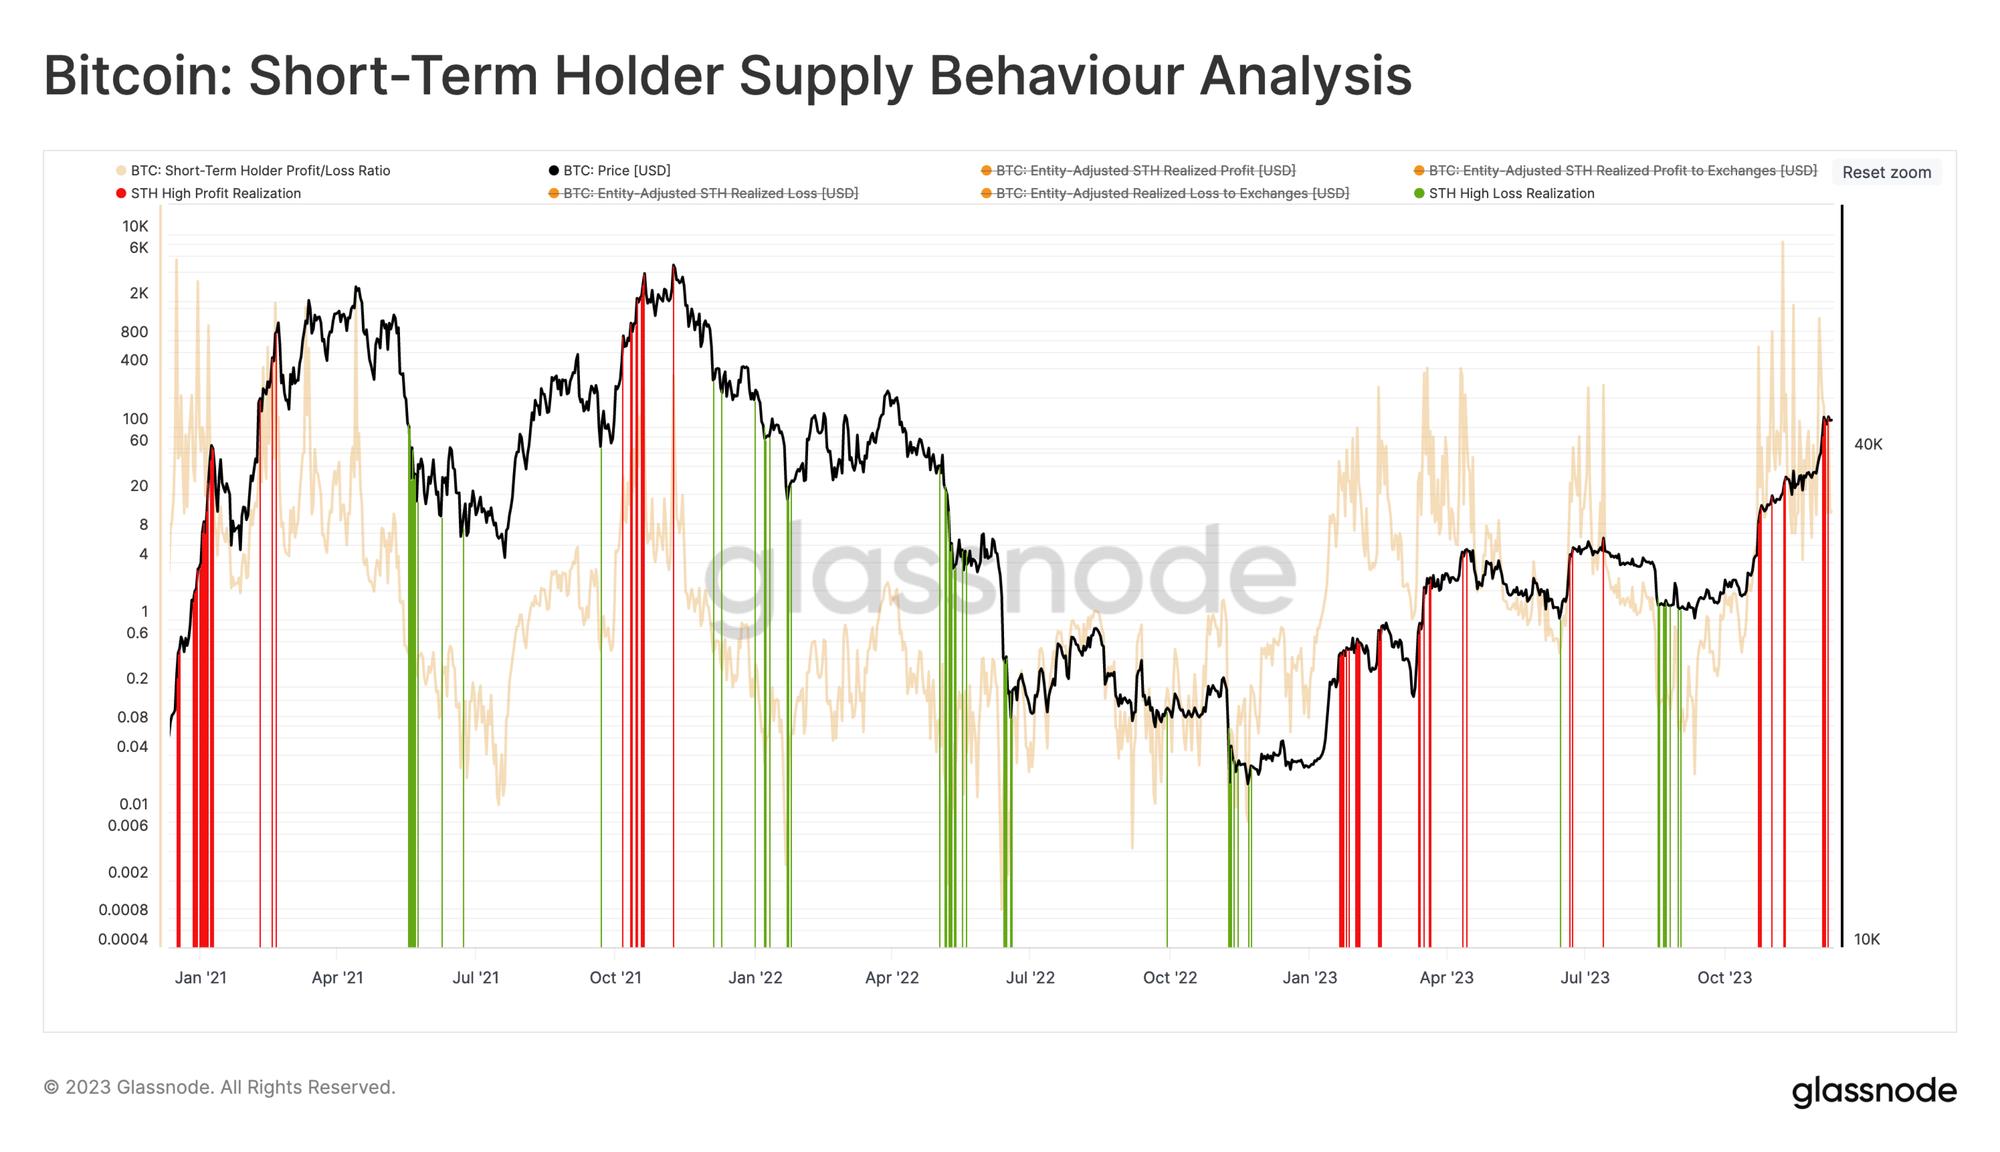
Of course, we can combine these two metrics into a single chart, creating a tool to help identify recent overbought/oversold conditions based on the spending behavior of the STH cohort.
As we can see, the recent rise to $44.2k coincided with statistically significant profit-taking by STHs. Alongside NTV Premium and the extended profit/loss ratio, we observe a confluence of factors suggesting that potential demand saturation (exhaustion) may be taking effect.
4. Conclusion
Bitcoin completed a round-trip this week, rallying to a new yearly high before retracing back to its weekly opening price. After such a strong performance throughout 2023, this latest rally appears to have met resistance, with on-chain data suggesting STHs were a key driving factor.
We presented a series of indicators and frameworks emphasizing local overvaluation and undervaluation in Bitcoin. These metrics draw from on-chain fundamentals such as investor cost basis, technical averages, and volume. We can then seek convergence in unrealized profit/loss indicators, which reveal when investors begin to take chips off the table.
Join TechFlow official community to stay tuned
Telegram:https://t.me/TechFlowDaily
X (Twitter):https://x.com/TechFlowPost
X (Twitter) EN:https://x.com/BlockFlow_News
 @glassnode