
Grayscale: Cryptocurrency's Supply-Side Dynamics
TechFlow Selected TechFlow Selected
Grayscale: Cryptocurrency's Supply-Side Dynamics
Teams managing token releases should adopt a strategic approach, opting for smaller, more frequent unlocks to stabilize the price.
 Navigating Web3 tides with focused insights
Author: Michael Zhao
Translation: Lynn, Mars Finance
It's no secret that the concept of supply plays a pivotal role in capital market dynamics. This is evident not only in traditional equities—where issuances of circulating shares can affect a company’s stock price—but also in the rapidly expanding world of crypto.
Grayscale Research has analyzed major supply events such as Bitcoin halvings and Ethereum’s Merge and Shapella upgrades, as these have historically served as catalysts for shifts in the supply dynamics of these assets. We believe these events are more than just technical milestones—they are turning points with the potential to reshape future supply and, consequently, how markets react in terms of pricing.
With the introduction of Grayscale’s cryptocurrency division, we extend this analysis to other crypto assets. Unlike public equities, where supply changes are typically more gradual relative to respective market caps, crypto assets may experience sudden shifts, leading to equally rapid market reactions.
What Is Cryptocurrency Supply, and Why Does It Inflate?
At its core, supply inflation is an intentionally implemented feature. Its primary function is to align incentives among three key groups: development teams, investors, and the broader user community:
-
For development teams: Controlled supply inflation serves as a critical funding mechanism. By gradually increasing supply, projects can ensure access to the resources needed for ongoing development, maintenance, and innovation. A steady inflow of resources is essential for ensuring long-term growth and viability, which in turn helps bolster confidence among investors and users.
-
For investors: Incremental supply growth can translate into direct returns. In ecosystems where staking or holding cryptocurrencies generates rewards, the increase in supply can provide tangible returns to investors. This mechanism not only incentivizes initial investment but also encourages long-term engagement with the project.
-
For the community: From the perspective of broader users and participants, supply inflation helps promote active ecosystem participation. Portions of newly minted supply are often allocated toward community initiatives, grants, and programs. These efforts aim to stimulate growth, foster innovation, and enhance the overall value of the ecosystem.
While supply inflation offers potential benefits, achieving the right balance is crucial. Excessive inflation could lead to asset devaluation, potentially undermining trust among the community and investors. This delicate equilibrium remains a key consideration in the crypto space, especially given the varied examples of supply inflation and distribution across different crypto assets:
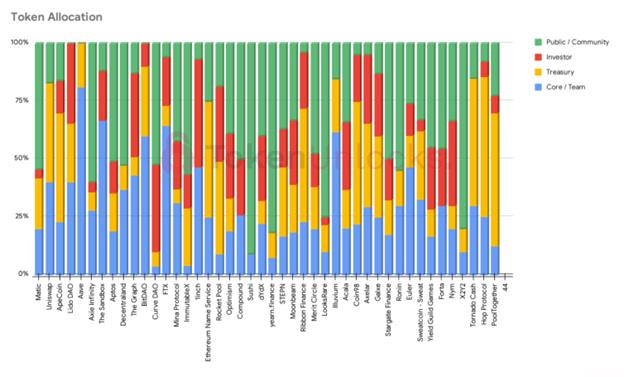
Source: token.unlocks.app, data as of December 2022
In the following sections, we will delve into how different forms of supply inflation have historically impacted prices, explore which sectors have experienced more severe inflation, and uncover nuances beyond supply alone.
A Year in Review: Token Supply Inflation
As shown in Chart 1, there is a general trend of token supply inflation across various crypto sectors. An increase in supply has been consistently observed across all industries. This trend aligns with the ongoing development within the crypto space, where some projects are actively scaling and expanding their operations. Meanwhile, other blockchain networks are systematically distributing tokens to validators or miners as part of their operational models.
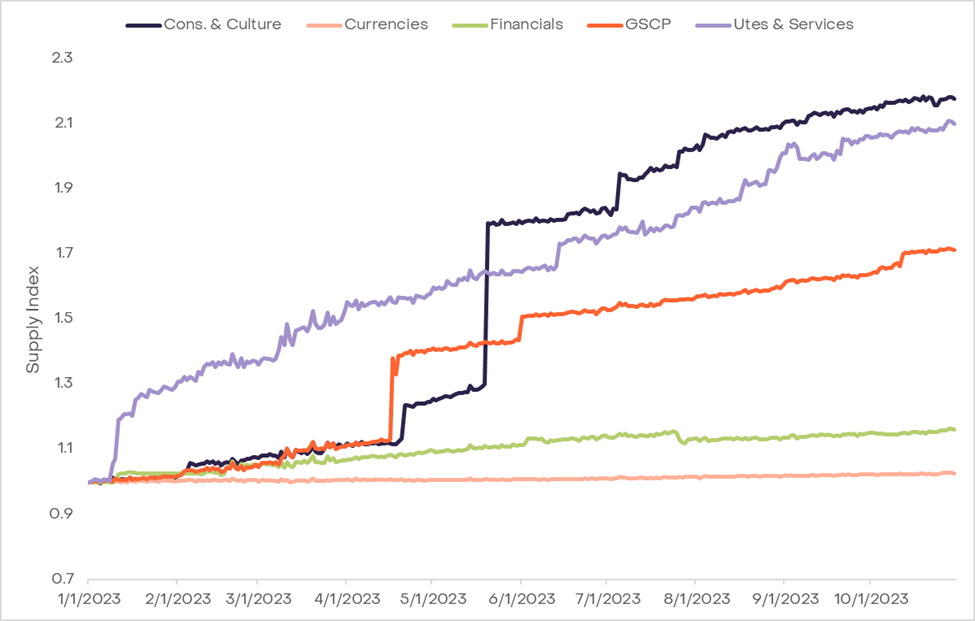
Chart 1: Most crypto sectors have generally increased supply year-to-date (YTD), Source: Coingecko, Grayscale Research, data as of December 1, 2023. For illustrative purposes only. Indexes are unmanaged and it is not possible to invest directly in an index. Allocations are subject to change.
The chart reveals several notable trends. First, the consumer and culture, utilities and services, and smart contract platform (SCP) sectors have exhibited the highest weighted average inflation levels YTD, while the currency sector shows the lowest. This observation aligns with expectations: the currency category includes Bitcoin, the oldest crypto asset, whose majority of inflation occurred in earlier years. In contrast, sectors like consumer and culture and utilities and services include relatively newer assets, often in the early stages of their lifecycle. As such, any inflation in these emerging sectors, starting from a smaller circulating supply base, results in relatively larger percentage increases. Another interesting aspect is sudden surges in circulating supply—we will explore this in detail. But first, it is worth examining the overall performance YTD and how it relates to sector performance (Chart 2).

Chart 2: Sectors with higher inflation tend to show lower prices YTD, Source: Coingecko, Grayscale Research, data as of December 1, 2023. For illustrative purposes only. Indexes are unmanaged and it is not possible to invest directly in an index. Allocations are subject to change.
Unsurprisingly, the results indicate a significant relationship between supply inflation and price trends: sectors with higher supply inflation generally exhibit lower prices over the year. This finding sets the stage for a deeper investigation into the notable spikes in circulating supply observed across sectors.
Cliff Vesting
In Chart 1, we observe sudden and significant increases in token supply, strikingly similar to steep cliffs. These are instances of “cliff vesting” or “cliff unlocks,” a term used to describe the sudden release of large volumes of tokens. While some projects may gradually release tokens—reflecting a stable growth strategy or aligning with predefined reward schedules for network participants—others may immediately release substantial amounts, often during major events such as the completion of a development phase or a funding round.
These large releases are typically predefined in the token’s smart contract or governance protocol, resulting in the “cliffs” observed in supply charts. A practical example is a blockchain startup initially locking its tokens for one year before releasing 20% of the total supply to its core team in a single event. Such a release would appear as a sharp spike in the supply chart, contrasting sharply with the gradual increases or stable supplies of other tokens. Just as the sudden reintroduction of wolves into Yellowstone National Park provided scientists with a unique opportunity to study predator roles in natural ecosystems, the sudden introduction of new blocks of tokens provides us with a chance to examine tokenomics across various blockchain ecosystems where experimental variables have been adjusted.
While more gradual distributions may be influenced by multiple factors, making their price impact difficult to isolate, cliff events offer a clearer case. Their sheer scale and direct impact on circulating supply make them useful signposts, allowing easier identification and understanding of how supply changes influence pricing patterns.
In our analysis of crypto sectors, we specifically focused on approximately 400 individual instances where circulating supply unlocks ranged between 5% and 10%. This examination covered the period from January 1, 2021, to December 1, 2023. We plotted the average price difference with 95% confidence intervals to observe market reactions (Chart 3). The analysis included price comparisons 30 days before and after each unlock event, offering a comprehensive view of how these significant supply unlocks impact market prices at an aggregate level.

Chart 3: Prices tend to be higher before unlock dates and lower afterward, consistent with expectations. Source: Coingecko, Grayscale Research, data as of December 1, 2023. For illustrative purposes only. Past performance does not guarantee future results.
An interesting pattern emerges: prices often rise in the 30 days leading up to a supply unlock event, indicating anticipatory market behavior. Conversely, a noticeable decline occurs within the 30 days following the unlock. Breaking down this chart further by sector (Chart 4) reveals that this trend applies across different areas of the crypto market:
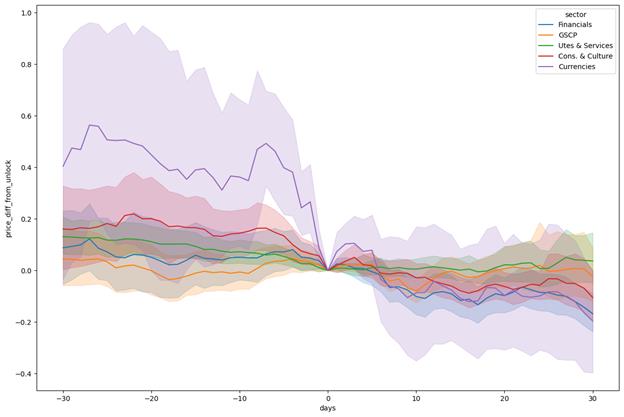
Chart 4: Price differences before and after, broken down by crypto sector. Source: Coingecko, Grayscale Research, data as of December 1, 2023. For illustrative purposes only. Past performance does not guarantee future results. Indexes are unmanaged and it is not possible to invest directly in an index. Allocations are subject to change.
Although it may initially seem surprising, the currency sector showed the most pronounced price movements both 30 days before and after cliff unlock events. However, it is important to note that this sector experienced only nine such cliff unlocks. In contrast, sectors like utilities and services experienced 191 cliff unlocks (Chart 5). The significant disparity in unlock frequency across sectors suggests that the currency sector’s data may be skewed due to the small number of instances compared to others. Nevertheless, as seen in Chart 2, the currency sector has already undergone most of its inflation overall.
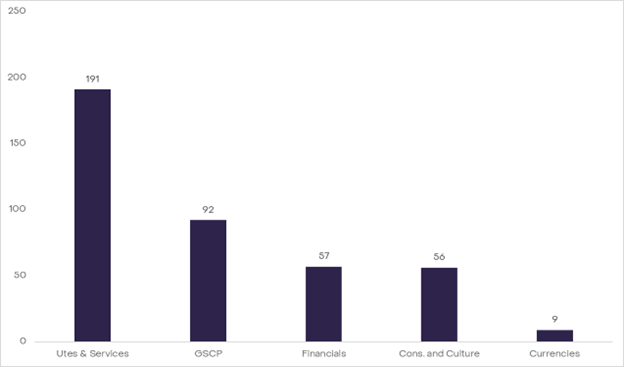
Chart 5: Number of cliff unlocks by sector. Source: Coingecko, Grayscale Research, data as of December 1, 2023. For illustrative purposes only. Past performance does not guarantee future results. Indexes are unmanaged and it is not possible to invest directly in an index. Allocations are subject to change.
Following larger unlock events, negative price movements tend to be more pronounced—a finding consistent with expectations. Comparing the impact of unlocks ranging from 5% to 10% versus those from 2% to 5%, it becomes clear that larger unlocks exert a greater downward pressure on prices (Chart 6).

Chart 6: Larger unlock sizes have a more pronounced effect on pre- and post-event prices. Source: Coingecko, Grayscale Research, data as of December 1, 2023. For illustrative purposes only. Past performance does not guarantee future results.
Deep Dive and Other Considerations
While our aggregate analysis generally indicates that rising inflation tends to correlate with price declines, it is important to recognize that this trend is not universal. A notable example within the utilities and services sector is Chainlink’s LINK, which significantly contributed to the sector’s inflation in 2023. LINK underwent three major cliff unlock events in 2023, releasing tokens worth over $500 million. Based on the general trend outlined in this article, one might expect a sharp drop in LINK’s price. Surprisingly, this did not happen. The relationship between LINK’s price and its supply unlocks does not follow the expected pattern, highlighting that the correlation between supply unlocks and price movements can vary significantly depending on the individual token and its unique market context.
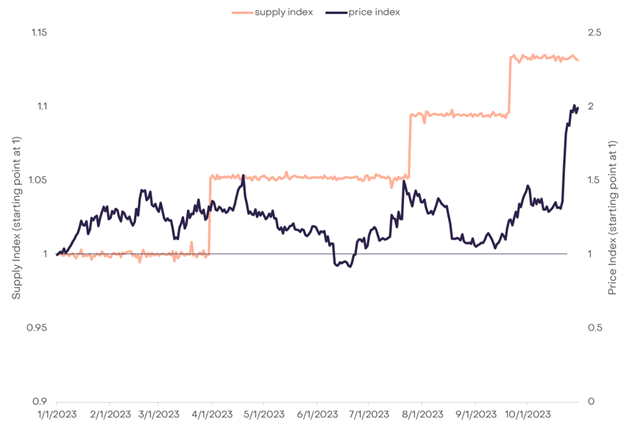
Chart 7: Chainlink’s LINK supply unlocks do not appear to follow the overall supply unlock trend. Source: Coingecko, Grayscale Research, data as of December 1, 2023. For illustrative purposes only. Past performance does not guarantee future results.
The 2023 LINK cliff unlocks were private, with vested amounts going directly to Chainlink Labs. Given the nature of these unlocks, it seems reasonable that despite the large volume released, the Chainlink team either refrained from selling or coordinated with market makers to mitigate any significant impact on the token’s price. This scenario underscores a crucial point: the recipients of cliff unlocks play a vital role in determining their market impact. If recipients (such as Chainlink Labs in this case) have the capability to independently trade large volumes of tokens or work with professional traders, this ability can significantly influence how unlocks affect token prices. While this doesn’t necessarily apply to all private unlocks, it is certainly plausible for mature projects with strong market influence and substantial resources.
Conclusion
Delving into the tokenomics of cryptocurrencies reveals that understanding the nuances of supply unlocks is essential for grasping price dynamics. Factors such as who receives the unlocks and their ability to trade large volumes of tokens—possibly using sophisticated methods—are critical considerations. For teams managing tokens, this analysis suggests a strategic approach: opting for smaller, more frequent unlocks may help stabilize token prices and avoid market volatility. As protocol teams grow and scale, strategically managing supply unlocks can become a powerful tool for fostering sustainable project growth. As investors continue navigating the digital economy, understanding these mechanisms can help distinguish projects with viable economic flywheels from those at risk of collapse.
Join TechFlow official community to stay tuned
Telegram:https://t.me/TechFlowDaily
X (Twitter):https://x.com/TechFlowPost
X (Twitter) EN:https://x.com/BlockFlow_News
 @Grayscale