

Is Bitcoin the New Age Safe-Haven Gold?
TechFlow Selected TechFlow Selected
Is Bitcoin the New Age Safe-Haven Gold?
This article will explore the price drivers of BTC and gold to reveal whether BTC qualifies as a safe-haven asset.
Author: Lisa, LD Capital
BTC is often referred to as "digital gold," while traders frequently use the Nasdaq Index as a key reference for BTC price movements. Gold and the Nasdaq represent classic safe-haven and risk assets respectively—this appears contradictory. This article aims to uncover whether BTC truly qualifies as a safe-haven asset by analyzing the price drivers of BTC and gold.
I. Overview of Gold and BTC
1. Gold
Units of Measurement for Gold
"Ounce" is the internationally recognized unit for measuring gold: 1 troy ounce = 1.0971428 avoirdupois ounces = 31.1034768 grams.
Gold Purity
Purity refers to the fineness of metal, usually expressed in parts per thousand or in “karats” (“K”). Pure gold is defined as 24 karats. Each karat (abbreviated “k”, from carat or karat) represents 4.166% gold content. The gold content for various karats is as follows:
8k = 8 × 4.166% = 33.328% (333‰)
9k = 9 × 4.166% = 37.494% (375‰)
10k = 10 × 4.166% = 41.660% (417‰)
12k = 12 × 4.166% = 49.992% (500‰)
14k = 14 × 4.166% = 58.324% (583‰)
18k = 18 × 4.166% = 74.998% (750‰)
20k = 20 × 4.166% = 83.320% (833‰)
21k = 21 × 4.166% = 87.486% (875‰)
22k = 22 × 4.166% = 91.652% (916‰)
24k = 24 × 4.166% = 99.984% (999‰)
For example, standard delivery for London Gold consists of 400-ounce bars with purity no less than 99.50%. In China, Shanghai Gold offers several deliverable varieties including Au99.99, Au99.95, Au99.5, Au50g, and Au100g:
- Au99.99: Standard weight 1 kg, purity ≥ 99.99%
- Au99.95: Standard weight 3 kg, purity ≥ 99.95%
- Au99.5: Standard weight 12.5 kg, purity ≥ 99.50%
- Au50g: Standard weight 0.05 kg, purity ≥ 99.99%
- Au100g: Standard weight 0.1 kg, purity ≥ 99.99%
Total Market Value of Gold
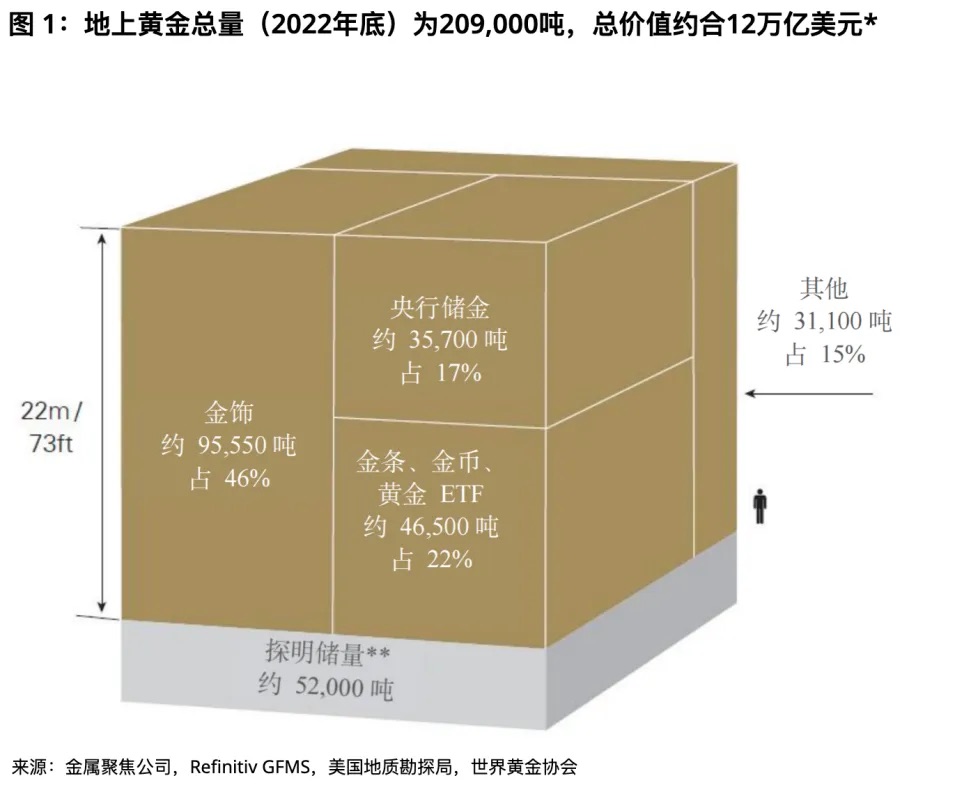
According to estimates by the World Gold Council, approximately 209,000 tons of gold have been mined, valued at around $12 trillion. About two-thirds of this was extracted after 1950. If all existing gold were stacked together, it would form a pure gold cube with sides measuring 22 meters (or 73 feet).
- Jewelry accounts for about 46% of total gold (approximately 95,547 tons, worth ~$6 trillion);
- Central banks hold 17% (approximately 35,715 tons, worth ~$2 trillion) as reserves;
- Bullion and coins account for about 21% (approximately 43,044 tons, worth ~$3 trillion);
- Physically backed gold ETFs make up about 2% (approximately 3,473 tons, worth ~$0.2 trillion);
- The remainder, about 15% (approximately 31,096 tons, worth ~$2 trillion), is used in industrial applications or held by other financial institutions.
Gold Trading Volume
Gold is one of the most liquid assets globally, with an average daily trading volume of $131.6 billion in 2022. Major trading venues include the London OTC market, U.S. futures markets, and Chinese markets. The London OTC market, established in 1919, is a physical gold over-the-counter market and the center of global gold trading. The London Bullion Market Association (LBMA) sets two benchmark gold prices daily (at 10:30 AM and 3:00 PM London time). The COMEX division of the New York Mercantile Exchange hosts the world's largest gold futures market. The Shanghai Gold Exchange (SGE), officially launched on October 30, 2002, provides a spot trading platform for China’s gold market. The Shanghai Futures Exchange (SHFE) complements SGE’s spot trading with futures contracts.
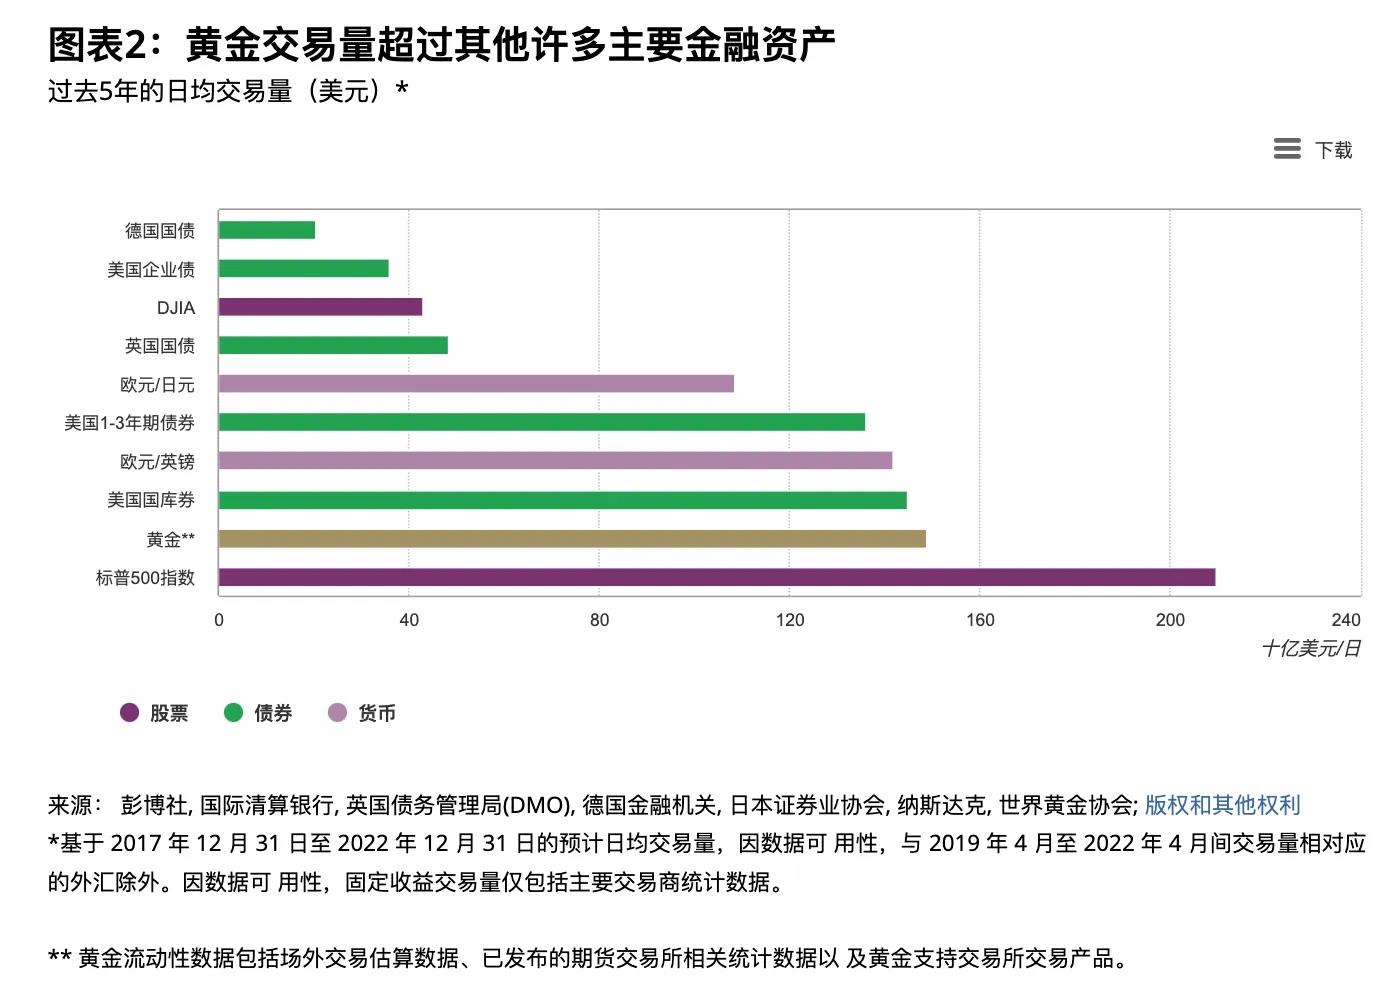
Daily Average Gold Trading Volume (in USD billions)
2. BTC
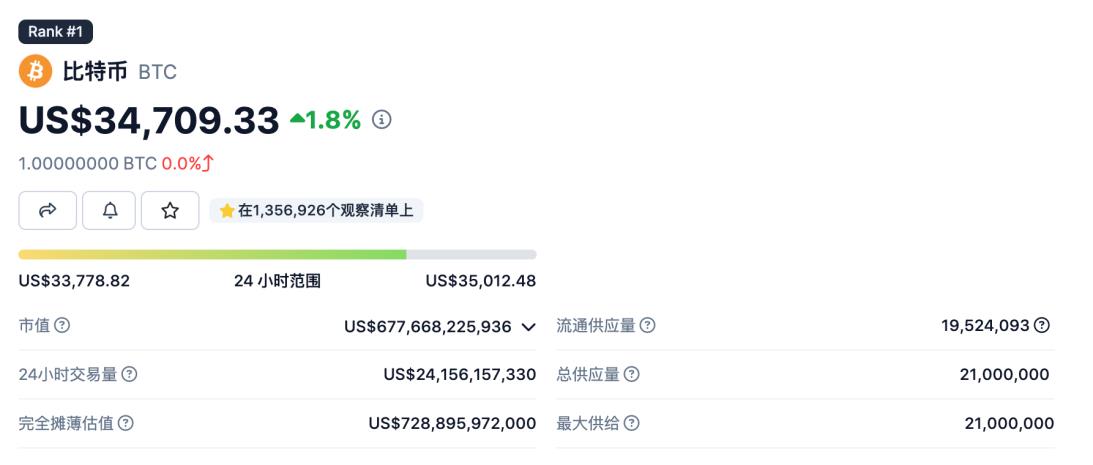
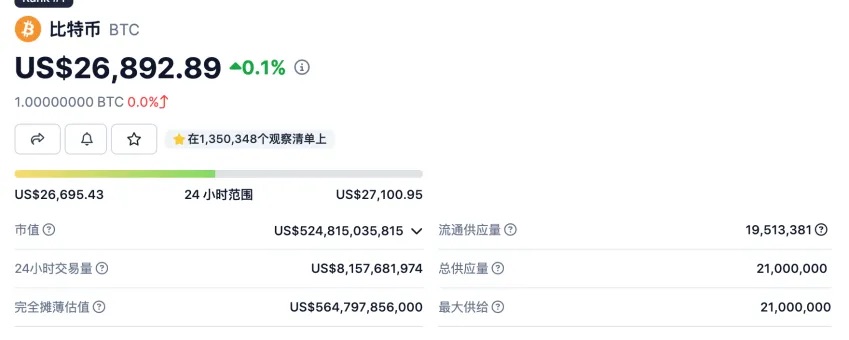
BTC has a 24-hour trading volume of approximately $24 billion, primarily driven by perpetual contracts. Recently, BTC’s daily trading volume has increased significantly, now reaching about 15% of gold’s (up from under 10% previously). Binance dominates both spot and perpetual contract trading volumes.
Current BTC market cap stands at $677.7 billion, roughly 5.6% of gold’s total market value.
II. Price Drivers of Gold and BTC
1. Supply and Demand
Gold
Gold Supply
Global annual new gold supply has remained stable between 2016 and 2022, averaging around 4,800 tons. Since gold does not degrade easily, recycled gold re-enters the supply chain through consumption channels. Thus, gold supply comes from mining production and recycling. In 2022, recycled gold totaled 1,140.6 tons, while mine production reached 3,626.6 tons—about three-quarters from mining and one-quarter from recycling. As shown below, gold supply has been stable over the years without significant fluctuations, meaning its relatively rigid supply exerts limited influence on prices.
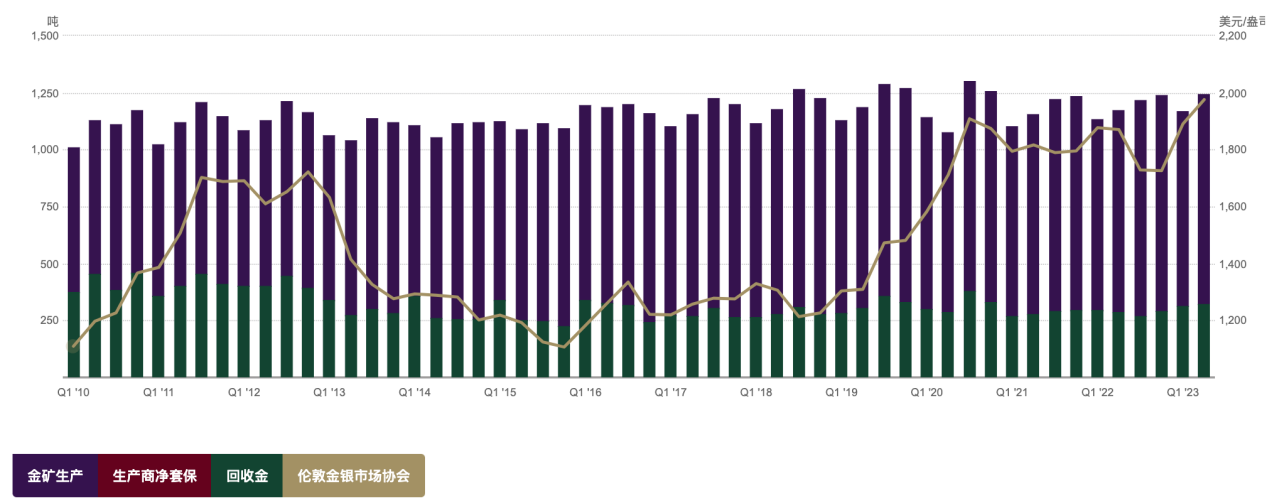
Gold Demand
In 2022, total global gold demand was 4,712.5 tons. In the first half of 2023, demand reached 2,460 tons, up 5% year-on-year. Gold demand includes jewelry, medical and technology uses, investment, and central bank reserves. In 2022, demand from jewelry manufacturing, technology, investment, and central banks was 2,195.4 tons, 308.7 tons, 1,126.8 tons, and 1,081.6 tons respectively—jewelry accounted for 47%, and central bank demand made up 23%. Influenced by traditional culture, China and India are the world’s largest consumers of gold jewelry; in 2022, each accounted for 23% of global jewelry demand.
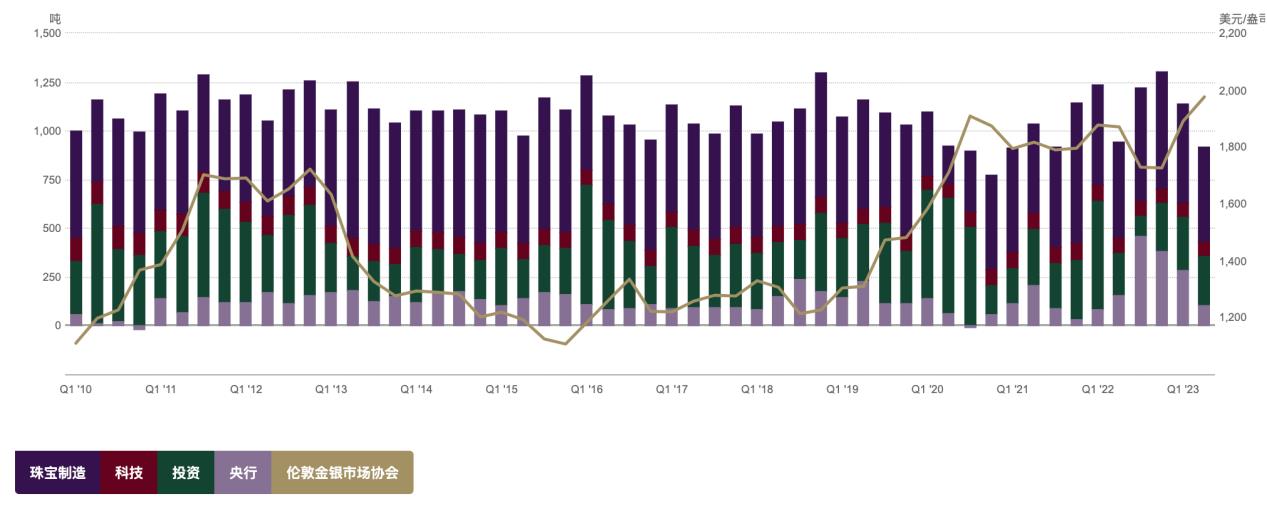
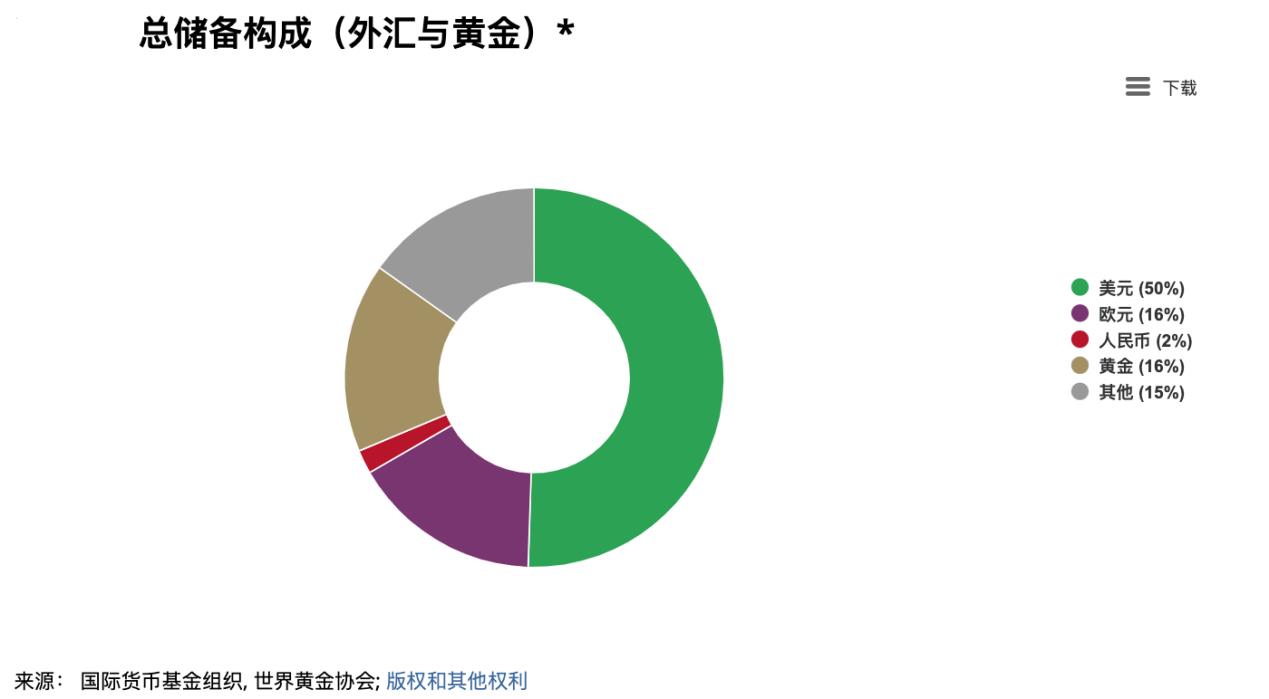
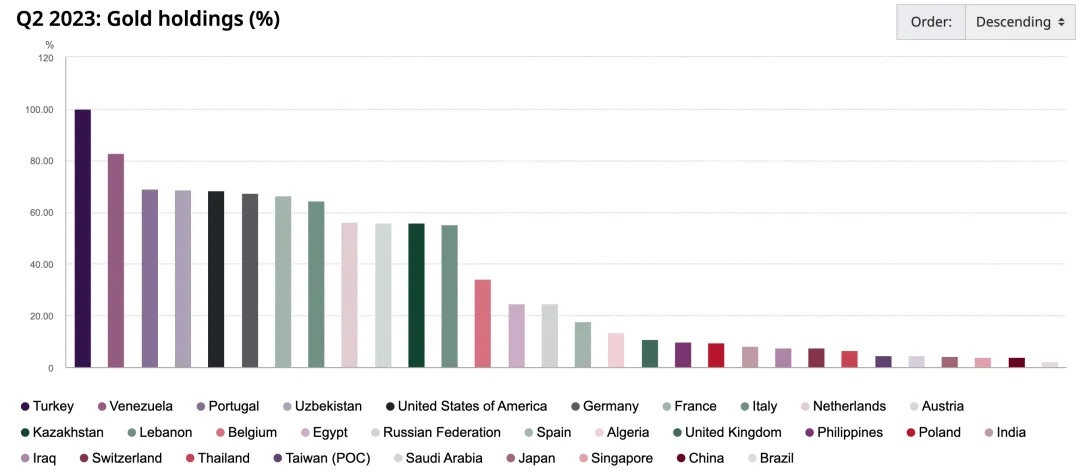
Gold is a critical component of central bank reserves worldwide, but the proportion varies widely across countries and regions. For instance, the U.S. and Germany hold close to 70%, while mainland China holds only 3.8% and Japan 4.2%. After the outbreak of the Russia-Ukraine conflict, the U.S. and Europe froze Russia’s foreign exchange reserves, shaking non-U.S. economies’ confidence in the dollar and increasing demand for diversified reserve holdings—leading many to boost gold reserves. As de-dollarization progresses, a long-term trend of systematic增持 (accumulation) of gold by global central banks will become increasingly evident.
Top 20 Countries/Organizations by Gold Reserves
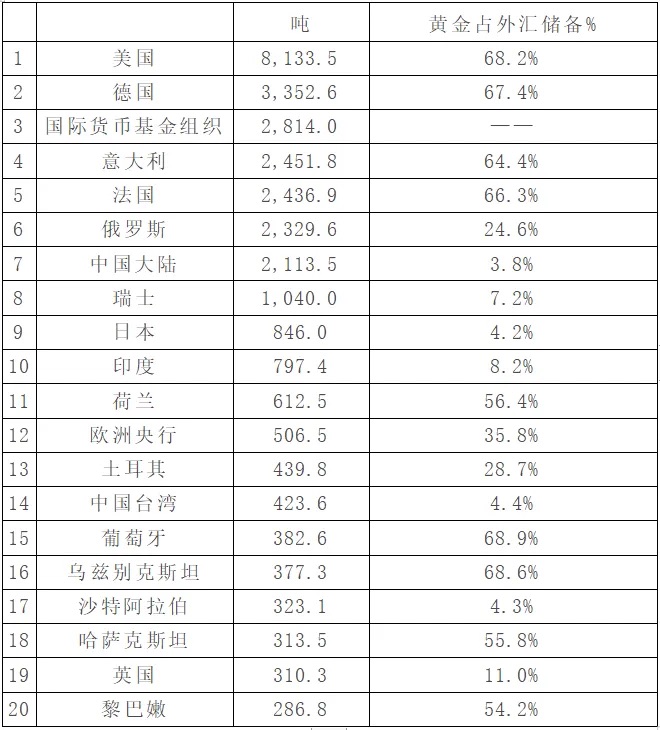
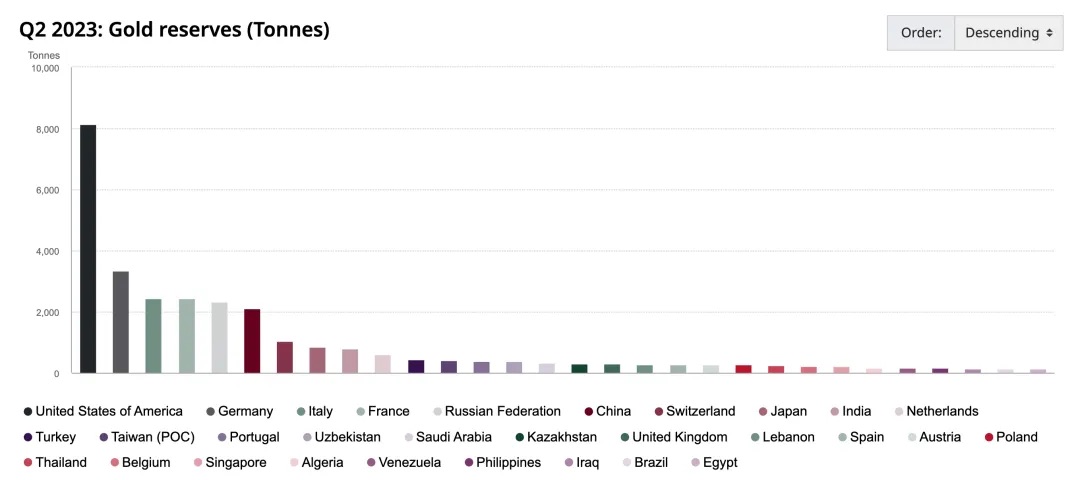
Source: World Gold Council
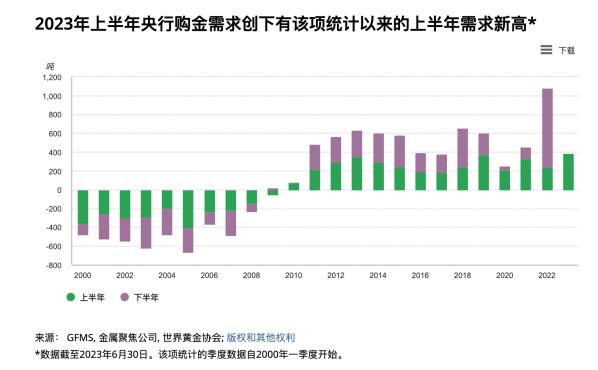
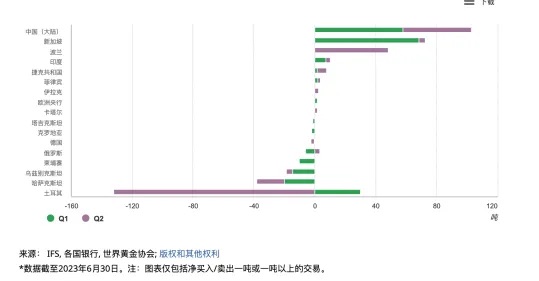
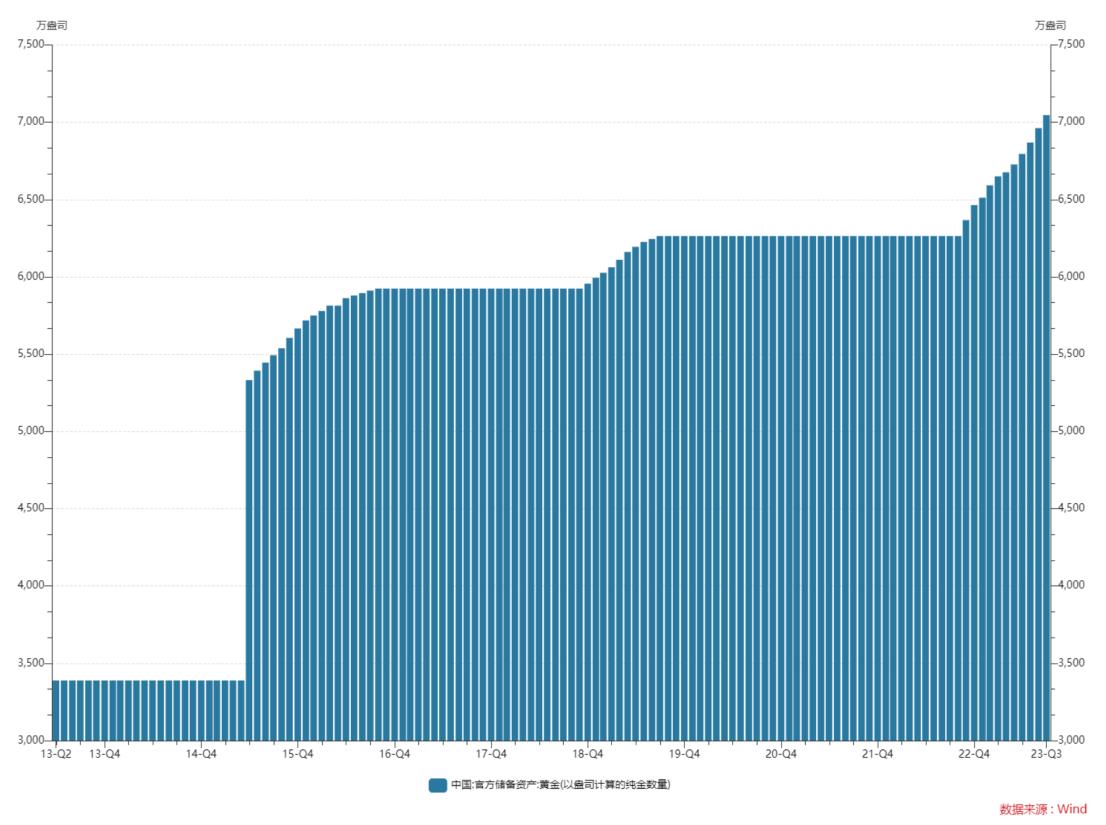
According to data from the World Gold Council, central bank gold buying surged starting in the second half of 2022. Central banks purchased 840.6 tons during that period—1.8 times the full-year total of 2021. Central bank demand remained strong in the first half of this year at 387 tons, the highest since records began in 2000. Turkey experienced high domestic gold demand due to temporary political instability, prompting the government to temporarily ban certain gold bar imports and sell gold into the domestic market—though this does not reflect a long-term strategic shift. Overall, Turkey’s sales did not undermine the positive trend in central bank gold demand. The biggest buyer was mainland China, which acquired 57.85 tons in Q1 and 45.1 tons in Q2. As of October 13, China’s gold reserves stood at 70.46 million ounces, up 840,000 ounces month-on-month—the eleventh consecutive monthly increase. Over the past 11 months, the People's Bank of China has cumulatively added 7.82 million ounces of gold. Historically, China’s central bank purchases are strategic and rarely involve selling.
 BTC
BTC
BTC has a fixed total supply of 21 million coins. Currently, 19.51 million are in circulation, representing about 90% of the total.
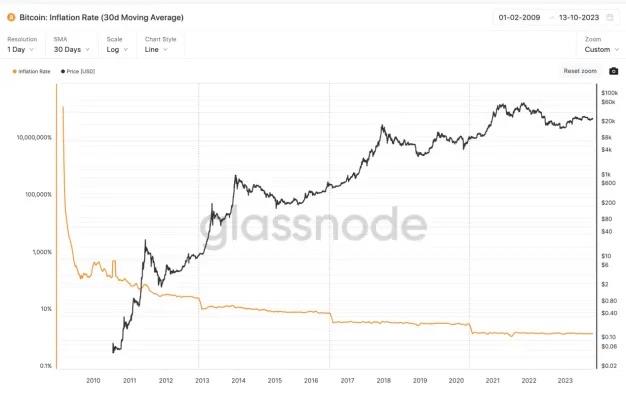
Currently, BTC’s inflation rate is around 1.75%, similar to gold’s annual inflation rate of about 2%. Due to Bitcoin’s halving mechanism, BTC’s inflation rate will fall significantly below gold’s in the future. The most recent halving in 2020 reduced block rewards from 12.5 to 6.25 BTC. The next halving is expected at the end of April 2024.
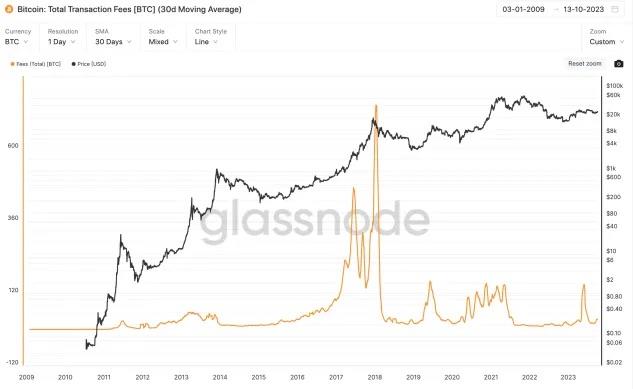
Demand can be divided into transaction fees and investment demand. This year, BTC has consumed approximately 20–30 BTC in fees per day, totaling roughly 10,000 BTC annually—about 0.5% of circulating supply. The rest reflects investment or speculative demand.
2. Macroeconomic Environment
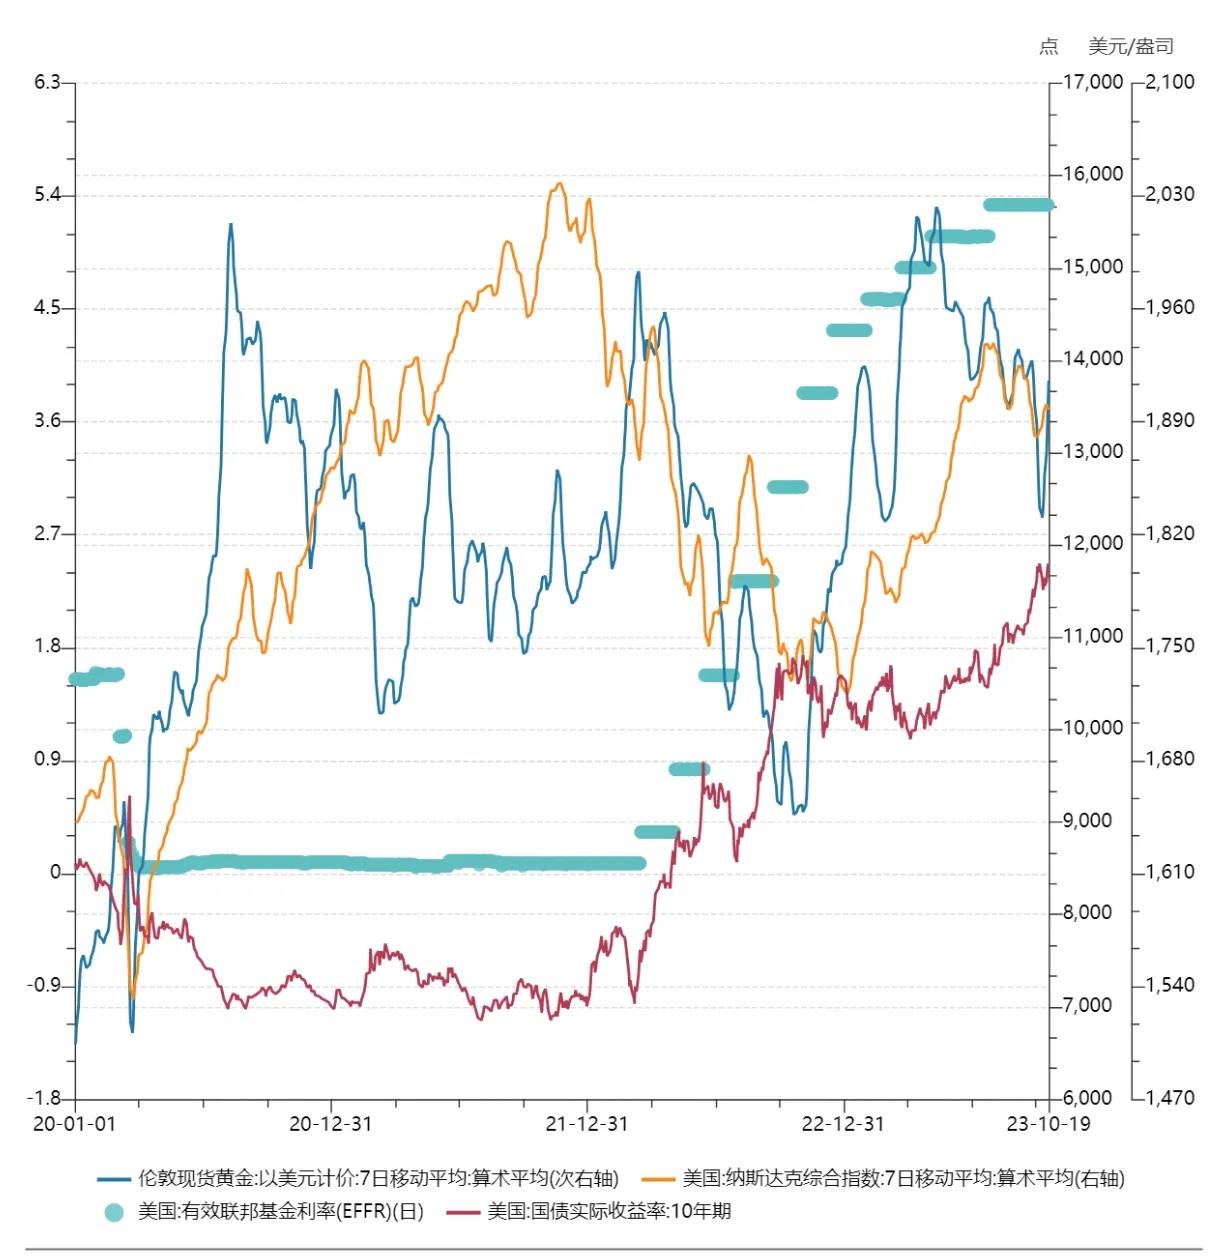
From the collapse of the Bretton Woods system until around 2000, inflation expectations and safe-haven demand were the main drivers of gold prices. Starting in 2004, with the introduction of gold ETFs and expansion of related financial markets, gold’s financial attributes strengthened, making real interest rates and the U.S. dollar index key factors influencing gold prices.
Dollar Index
Theoretically, gold prices typically move inversely to the U.S. dollar because gold is priced in dollars. A stronger dollar makes gold more expensive in dollar terms, putting downward pressure on gold prices. From a broader perspective, after the collapse of the Bretton Woods system, the dollar moved away from the gold standard. Gold thus acts as a hedge against fiat currencies—especially the dollar. The stronger the dollar’s credibility, the lower gold’s relative appeal; the weaker the dollar, the higher gold’s value. Periods when both gold and the dollar rise simultaneously often coincide with major geopolitical or economic shocks such as oil crises, subprime mortgage crises, or debt crises, reflecting heightened market caution and risk aversion.
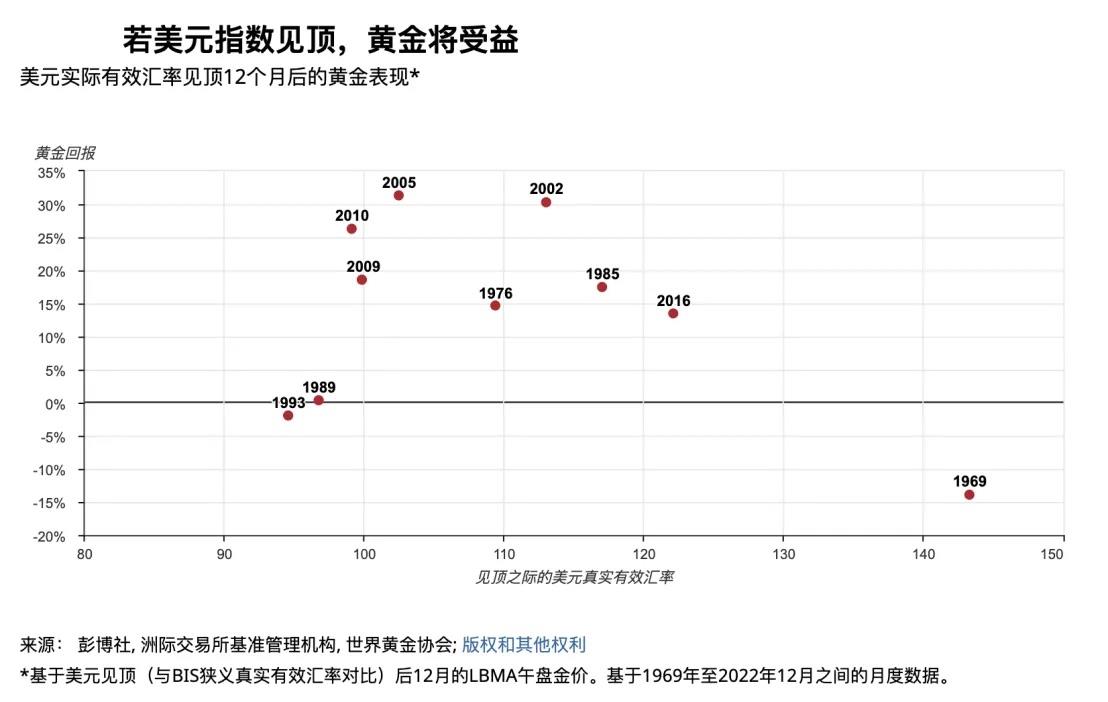
Historically, 80% of the time, gold delivered positive returns within 12 months following a peak in the dollar index (average return +14%, median +16%).
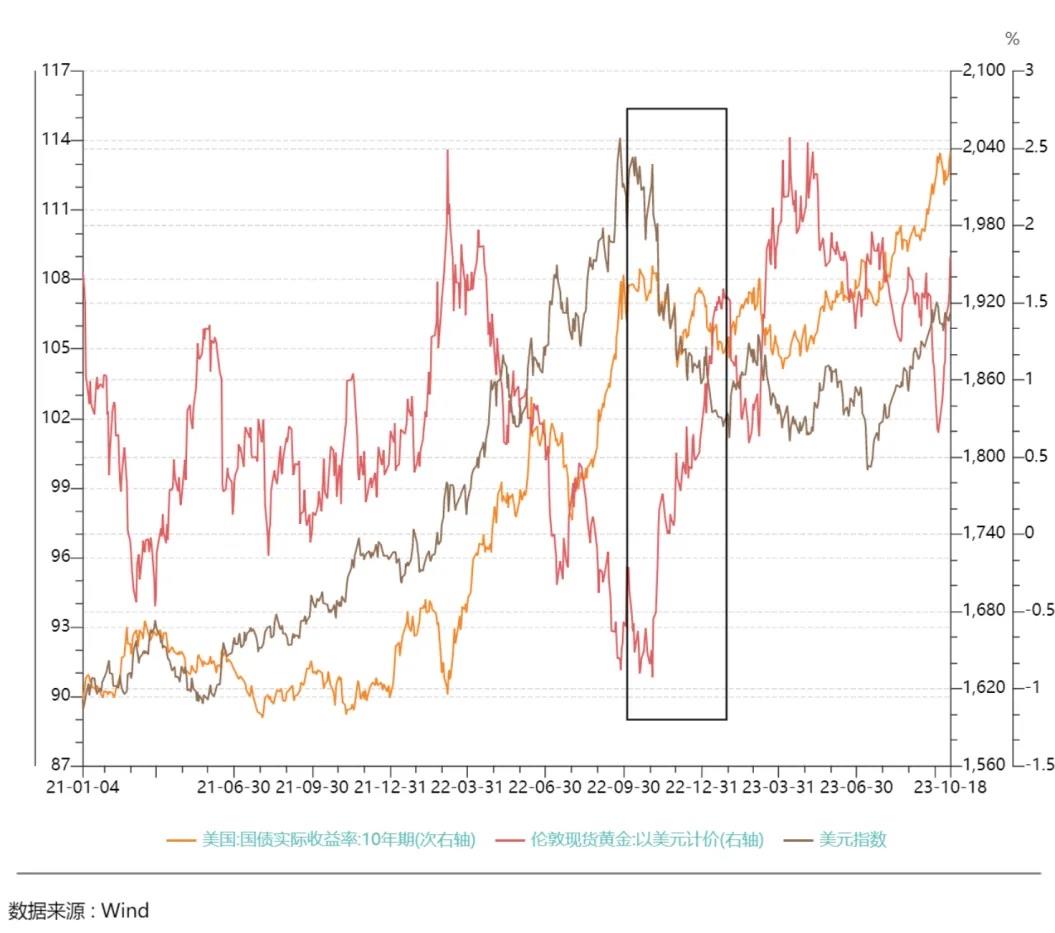
From Q4 2022 to early 2023, the U.S. 10-year real yield fluctuated without major swings, yet gold prices rose from a low near $1,600 to $2,000 per ounce, deviating from historical constraints imposed by long-term yields. Between October 2022 and January 2023, growth momentum outside the U.S.—driven by post-pandemic recovery expectations in China and rebounds in Europe—caused DXY to fall nearly 9%. During this period, gold primarily followed DXY’s decline.
U.S. Treasury Real Yields
Gold is a non-yielding asset, while the dollar generates interest income. Nominal yields and inflation expectations jointly drive gold prices. U.S. real interest rates (nominal rate minus inflation expectations) represent the opportunity cost of holding gold and theoretically exhibit a negative correlation with gold prices. Alternatively, real yields reflect the actual return achievable within the dollar system and serve as an indicator of dollar credibility.
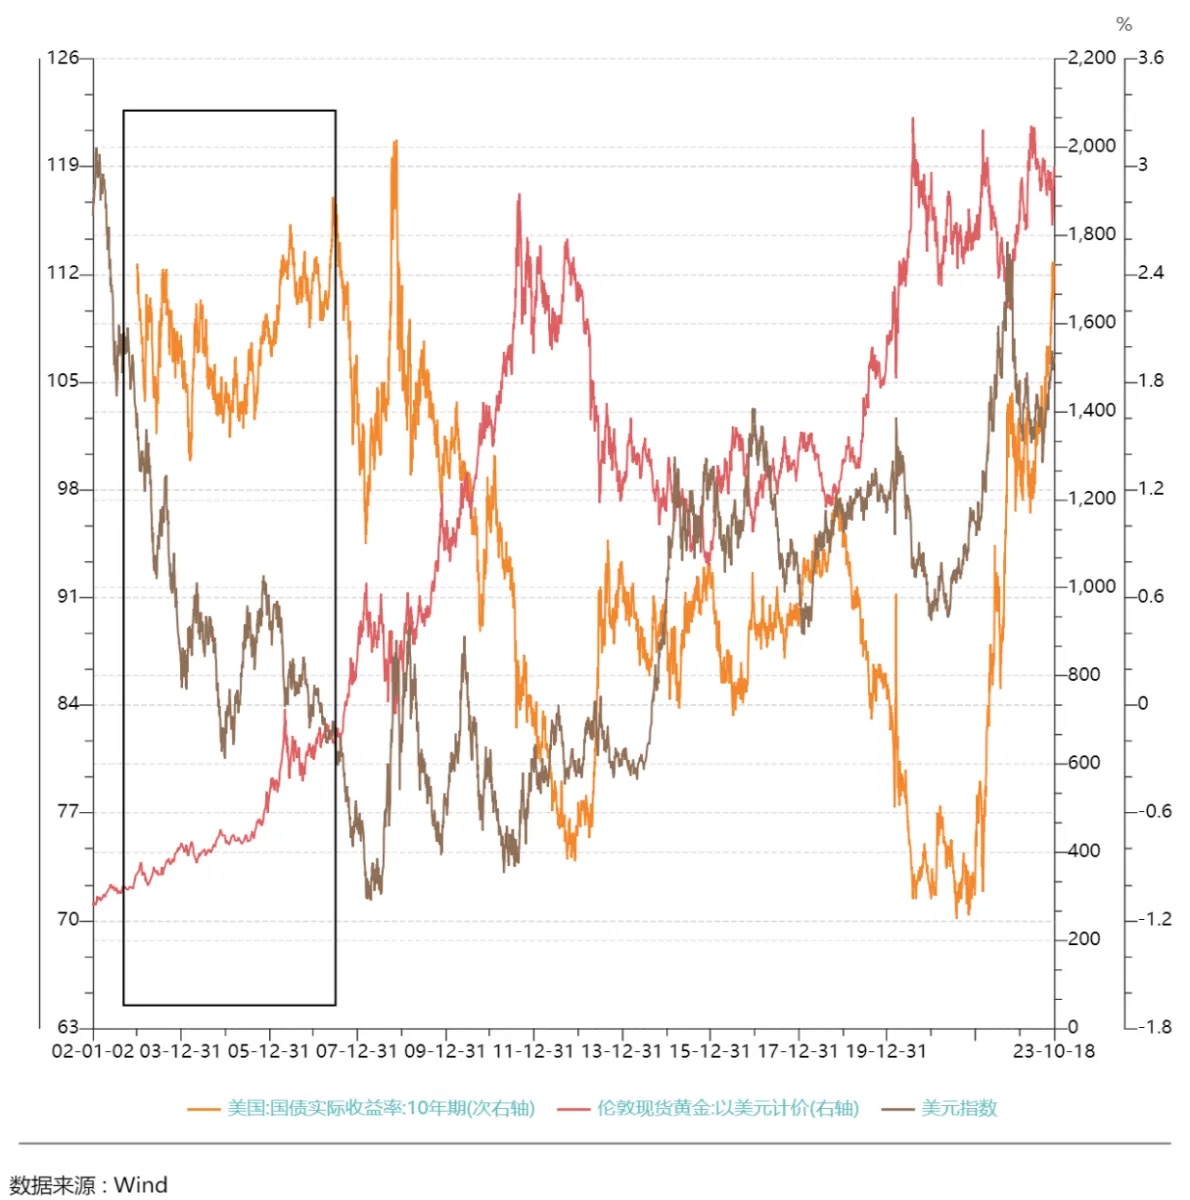
Both the dollar index and U.S. Treasury real yields help explain gold price movements, though their relative importance varies over time. Since 2000, except before 2005, gold prices have shown a significant negative correlation with 10-year U.S. Treasury real yields for most of the time. Real yields have exerted a longer-lasting influence on gold prices than the dollar index, suggesting they are the most important factor shaping gold’s long-term price trajectory.
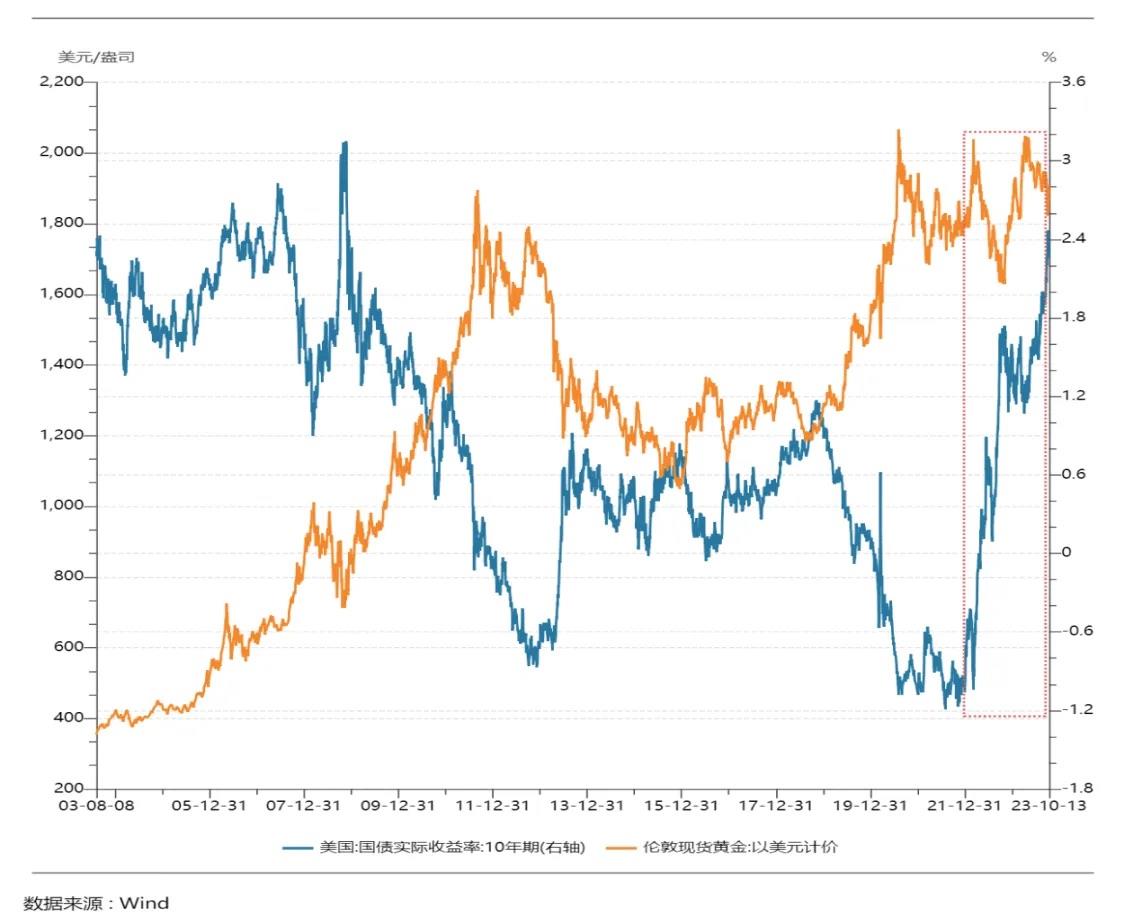
Since 2022, gold’s sensitivity to real yields has declined. Despite rapid increases in real yields, gold prices fell less than in previous episodes, showing greater resilience. Neither real yields nor the dollar index fully explain gold’s price behavior during this period—likely due to surging central bank gold purchases beginning in late 2022. On October 9, the World Gold Council reported that global central banks are expected to continue strong gold reserve accumulation. In August alone, central banks added 77 tons of gold, 38% more than July—indicating structural shifts in gold demand.
3. Geopolitical Factors
“Buy gold in turbulent times”—geopolitical conflicts increase safe-haven demand, driving short-term spikes in gold prices. For example, after the 2022 Russia-Ukraine and Israel-Palestine conflicts, gold prices approached $2,000 per ounce—movements unexplained by U.S. real yields or the dollar.
Asset Price Changes After Russia-Ukraine War
On February 24, 2022, Russian President Putin announced a military operation aimed at “demilitarizing and denazifying Ukraine,” stating that Russian forces had no plans to occupy Ukrainian territory and supported the self-determination of the Ukrainian people. Minutes after his speech, Russian forces launched cruise and ballistic missiles targeting Kyiv, Kharkiv, and Dnipro’s military bases and airports, destroying Ukraine’s National Guard headquarters. Russian troops then advanced into Luhansk, Sumy, Kharkiv, Chernihiv, and Zhytomyr regions under Ukrainian control. Large-scale amphibious landings occurred in Mariupol and Odesa in southern Ukraine.
Between February 25 and March 8, gold rose continuously by about 8%. BTC showed no clear movement in the first few days after the war. It surged 15% on March 1 but quickly retraced. By March 8—the peak for gold—BTC traded at $38,733, up 4% from pre-conflict levels, while the Nasdaq dropped about 1.5%.
From March 9 to the end of March, as Western nations imposed sanctions on Russia, markets perceived the worst-case scenario as priced in, and gold retreated from its highs. BTC and the Nasdaq briefly fluctuated before rising together from March 14 onward. While BTC and the Nasdaq climbed, gold prices oscillated sideways. By the end of March, BTC had gained 20%, gold’s gain narrowed to 2% (from February 24), and the Nasdaq rose 6%.
Meanwhile, the Federal Reserve initiated its rate hike cycle in March 2022, and the impact of the Russia-Ukraine war on asset prices gradually diminished, shifting market focus to Fed policy.
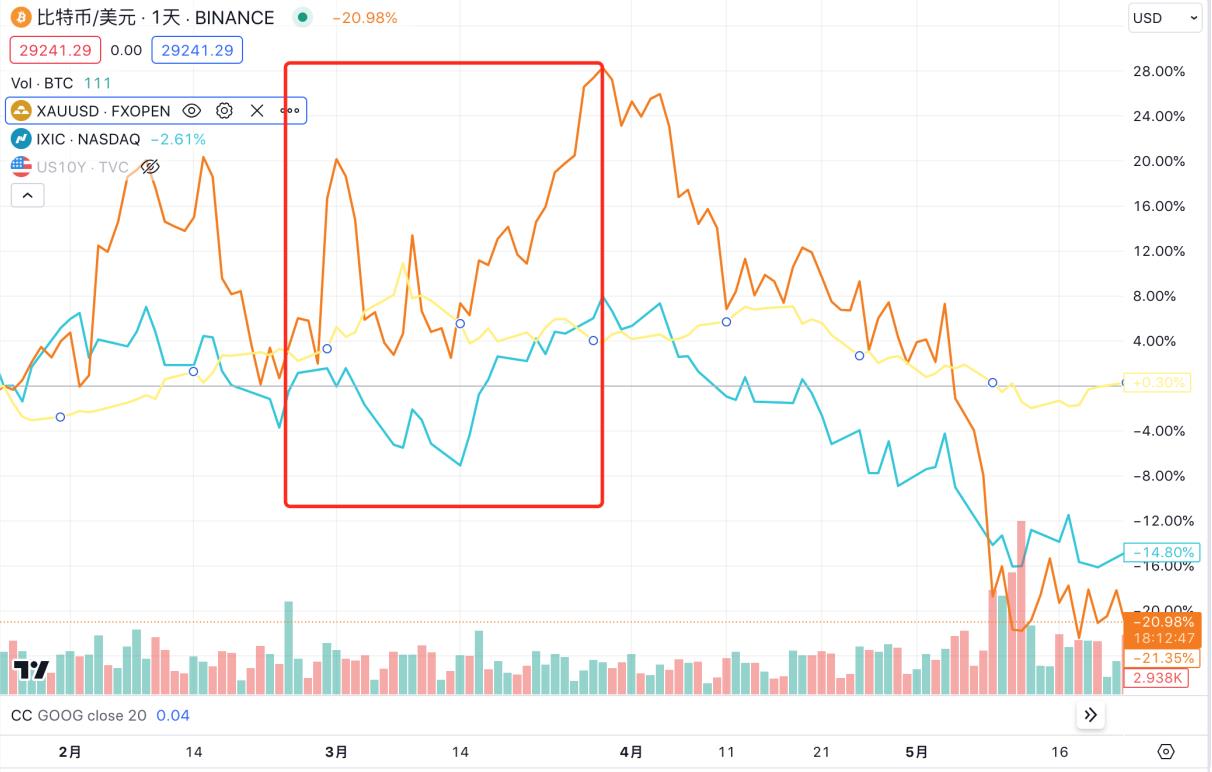
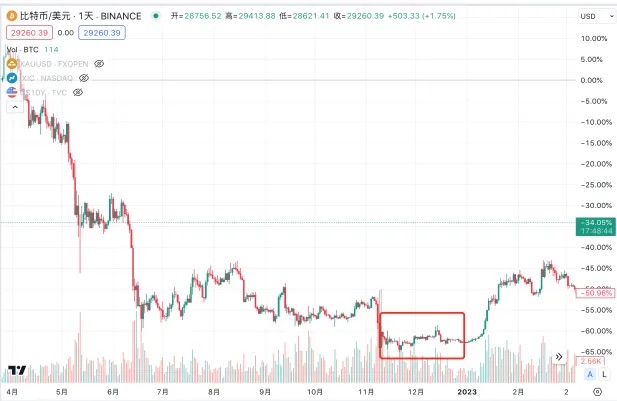
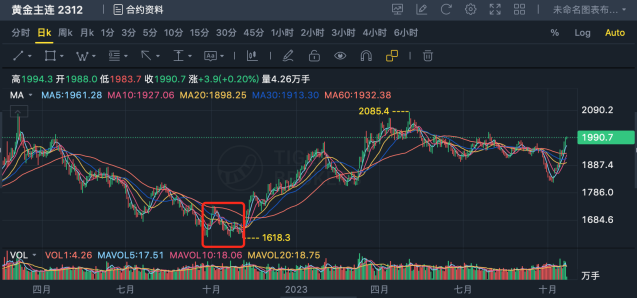
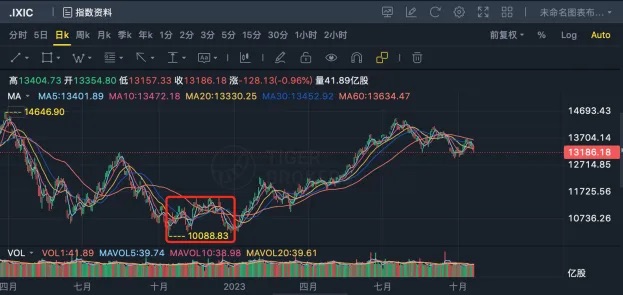
Starting in April, BTC and the Nasdaq entered prolonged downtrends alongside rate hikes. Gold initially rose briefly but began a sustained decline on April 19. The Nasdaq bottomed around 10,000 points in October 2022—a cumulative drop of 28% since the start of tightening. Gold found support at $1,615 in September–October, down 16%. BTC bottomed at around $16,000 in November, falling 66% from its pre-hike peak.
After the lows, gold led the rebound, rising steadily from early November to reach a high of $2,072 on May 4—up 28% from the trough. BTC and the Nasdaq began their rallies two months later. In early 2023, both resumed synchronized upward moves, peaking around mid-July. BTC reached ~$31,500, nearly doubling from its low. The Nasdaq hit 14,446, up 44%.
This rally was primarily driven by a peak in U.S. Treasury yields in early November. Declining yields sparked a sharp rebound in risk assets. Key catalysts included the October CPI and core CPI reports, which showed larger-than-expected declines, and a deepening inversion in the 10Y–2Y yield curve, signaling sharply reduced inflation and growth expectations. These developments pushed 10-year Treasury yields lower and prompted expectations of a slower pace of Fed rate hikes. Subsequently, AI-driven enthusiasm in tech stocks, along with unique narratives supporting gold and BTC, fueled further gains across markets.
Overall, BTC’s price movement showed little correlation with gold during and after the Russia-Ukraine conflict, indicating it did not exhibit strong safe-haven characteristics.
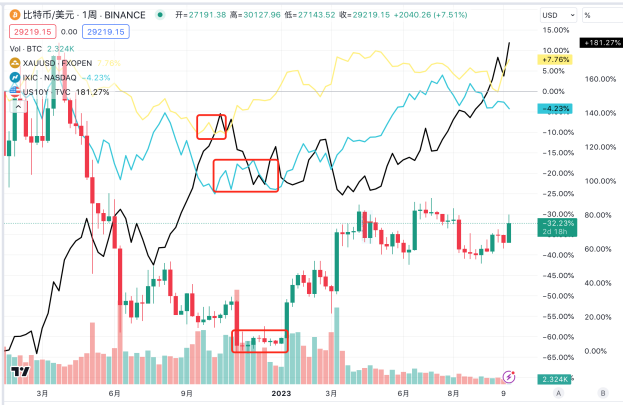
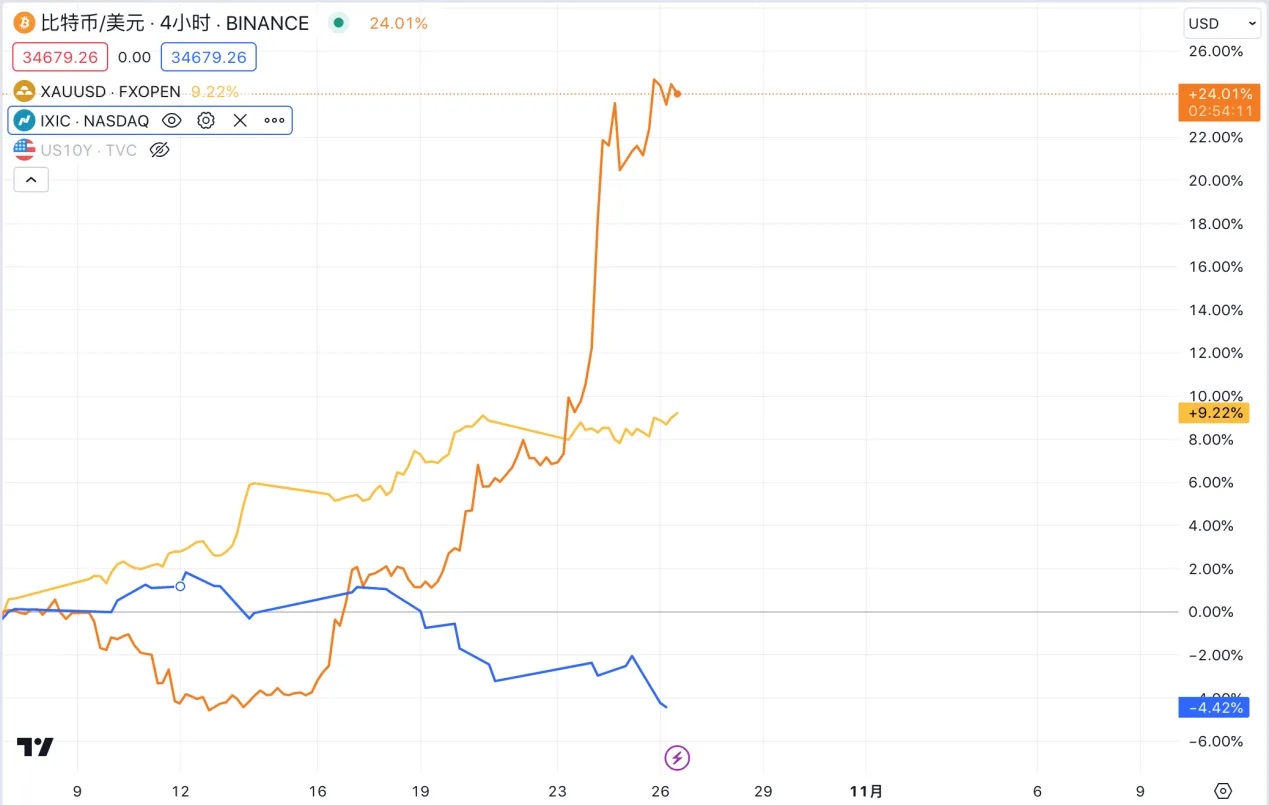
Asset Price Changes Since Israel-Palestine Conflict
On the morning of October 7, 2023, Palestinian Islamic Resistance Movement (Hamas) launched “Operation Al-Aqsa Flood,” firing over 5,000 rockets into Israel within minutes. Thousands of militants entered Israeli territory from Gaza via multi-axis attacks, engaging Israeli forces. Israel responded with multiple airstrikes on Gaza. Prime Minister Netanyahu declared a “state of war,” vowing to destroy Hamas with full military force.
Gold emerged as the strongest performer since the conflict began, rising from $1,832 on October 9 to nearly $2,000 on October 26—an 8% gain, coincidentally matching the surge seen during the Russia-Ukraine war. BTC fell from $28,000 to $26,770 between October 7 and 13—a 4.4% drop. It rebounded starting October 13. On October 16, amid a false report that BlackRock’s BTC ETF application had been approved, BTC spiked sharply before pulling back, closing up about half to $28,546. Positive sentiment around ETF approval continued building, pushing BTC to $34,183 by October 25. The Nasdaq rose slightly from October 9 to 11, then declined from October 12, dropping from 13,672 to 12,595 by October 20.
During this period, BTC and the Nasdaq moved almost inversely, each following independent trends. BTC’s initial price drop contradicts the behavior of a safe-haven asset. Its subsequent rally was fueled by renewed market confidence—and growing speculation—after the SEC decided not to appeal the Grayscale Bitcoin Trust case, boosting expectations for spot BTC ETF approval.
III. Is BTC a Safe-Haven Asset?
BTC shares similarities with gold in terms of supply dynamics and inflation characteristics. From a design and theoretical standpoint, BTC should possess safe-haven properties. As Arthur Hayes articulated in his article *For the War*, wars trigger severe inflation. Ordinary citizens typically protect wealth using hard currencies like gold. However, if war breaks out domestically, governments may ban private ownership of precious metals, restrict transactions, or even force citizens to sell gold at low prices. Holding strong foreign currencies may also face strict capital controls. Only Bitcoin—whose value and transmission network do not rely on government-chartered banks and lacks physical form—can be carried freely across borders without restriction. In true wartime scenarios, BTC could actually be superior to gold and strong currencies.
However, in practice, BTC has not yet demonstrated clear safe-haven properties based on actual price behavior.
To better understand how different assets behave across a full cycle, consider price movements prior to the Russia-Ukraine conflict during this round of monetary tightening. The onset of the pandemic in early 2020 caused inflation expectations to plummet, forcing the Fed to cut rates to 0–0.25% and launch unlimited QE in late March 2020. Asset prices rose collectively, with gold leading the charge—London gold hit a record high of $2,075 per ounce in August 2020 before retreating. The Nasdaq rose 144% from 6,631 on March 30, 2020, to 16,212 on November 21, 2021. Over the same period, BTC surged from $6,850 to $58,716—a 757% gain.
Since 2020, with increasing institutional participation, BTC has begun to exhibit traits of a broader asset class. During this time, BTC price movements have closely tracked the Nasdaq, while gold’s divergent performance reflected its role as a safe-haven asset amid the pandemic. Fear from the health crisis and concerns over severe economic deterioration—beyond just real interest rates—propelled gold higher. Additionally, pandemic-related logistical disruptions hindered gold transportation, contributing to faster price appreciation.
Whether viewed through the lens of long-term monetary cycles or short-term geopolitical shocks, BTC has not shown notable safe-haven characteristics. Instead, it exhibits a higher correlation with the Nasdaq. It should be noted that even gold—often labeled a safe-haven asset—displays strong financial attributes over long cycles, often moving in tandem with the Nasdaq due to interest rate influences.
IV. Outlook on Future Trends
In October, several Fed officials made dovish remarks. For instance, Dallas Fed President Logan, previously hawkish, stated that rising Treasury yields might reduce the need for further rate hikes. Vice Chair Jefferson said the Fed would consider tighter financial conditions resulting from higher bond yields when assessing future policy. On October 19, Fed Chair Powell, speaking at the Economic Club of New York, suggested that as disinflation progress continues, rising long-term yields could allow the Fed to pause hikes again at the next meeting. However, he reiterated the Fed’s commitment to sustainably returning inflation to 2% and left open the possibility of future hikes. Following Powell’s speech, CME futures implied a 99.9% probability of no rate hike in November. Yet, the 10-year Treasury yield surged again last week, briefly exceeding 5.0%. In the short term, rate hike expectations are no longer the primary focus for Treasury traders. The yield spike may reflect a cautious interpretation of Powell’s comments as hawkish, or concerns over potential expansions in U.S. fiscal spending and increased debt issuance. Overall, current economic data suggest that a 5% level for the 10-year yield may represent a ceiling in the Fed’s view. Short-term yields are likely to remain elevated, but according to dot plots and market forecasts, the Fed is likely to begin cutting rates in 2024. This shift in monetary policy will fundamentally alter global asset allocation dynamics. In this context, the windows for allocating to both gold and BTC are approaching—mainly a matter of timing.
1. Gold
U.S. real yields remain the primary driver of gold prices. Once the cycle turns next year, the negative correlation between gold and 10-year real yields will reassert itself, making real yields the dominant and persistent force behind gold pricing. Additionally, the long-term trend toward a multipolar international monetary system—accelerated by “de-globalization” and the rise of non-dollar currencies—will erode dollar credibility over time, supporting ongoing central bank gold accumulation. Long-term, gold is poised to enter an upward cycle, driven by cyclical reversal and structural transformation, potentially surpassing previous all-time highs.
In the short term, gold prices will remain volatile, with geopolitics remaining a key influence. Price direction hinges on whether the Israel-Palestine conflict spreads to other Middle Eastern countries. The author believes that if the conflict remains confined to Israel and Palestine, gold’s rally will likely stall, struggling to break above the psychological resistance of $2,000 per ounce. However, if the conflict expands to oil-producing nations like Iran or Saudi Arabia—or worse, triggers oil embargoes or sharp output cuts—it could severely disrupt oil supply chains, pushing crude and gold prices higher. Rising energy costs would feed through to broader commodity prices, reviving CPI growth and introducing greater macroeconomic uncertainty. Based on current conditions, the former scenario appears more likely.
2. BTC
Similarly, as the Fed begins its next easing cycle in 2024, improved liquidity and rising global risk appetite—combined with BTC’s own market dynamics—will fuel another bull run, potentially breaking previous highs. The immediate catalyst remains SEC approval of a spot BTC ETF. BTC has already surged past $34,000 recently. Our forthcoming research report will analyze in detail the impact of a spot ETF on BTC prices and provide price projections post-approval—stay tuned.
Join TechFlow official community to stay tuned
Telegram:https://t.me/TechFlowDaily
X (Twitter):https://x.com/TechFlowPost
X (Twitter) EN:https://x.com/BlockFlow_News


