









Does the window display effect apply to today's DEX competition?
TechFlow Selected TechFlow Selected
Does the window display effect apply to today's DEX competition?
What is the core of DEX competition?
 Navigating Web3 tides with focused insights
Recently, Vyper suffered a reentrancy attack, significantly impacting Curve—built on Vyper—and stirring notable turbulence within the otherwise calm DEX ecosystem. We can observe that emerging DEX platforms such as TraderJoe, Maverick, and Izumi have achieved substantial trading volumes across various blockchains through their unique solutions. This article examines several mainstream DEXs, focusing on stablecoin and yield-bearing asset trades, to explore evolving trends and potential trajectories in the DEX industry landscape.
Main Theme One: Evolution from Liquidity Spillover to Capturing Genuine Transaction Demand

Following the Vyper vulnerability exploit that targeted Curve, its TVL dropped from $3.8 billion to $2 billion—nearly halved. Now, with FRAX adding liquidity back into Curve, TVL has rebounded to $2.8 billion. Interestingly, during this incident, market panic over leveraged lending risks on Curve far exceeded concerns about stablecoin de-pegging. Historically, Curve has been deeply associated with stablecoins and was unquestionably the dominant player in the space. But why didn’t this hack trigger widespread concern over stablecoin peg stability?
First, we must address an important question: how do we define who is the “leader” in the stablecoin space?
The chart below illustrates overall changes in stablecoin market capitalization. Clearly visible is continuous growth from January 2020 to February 2022. The main drivers were USDC, USDT, DAI, and algorithmic stablecoins FRAX and UST.
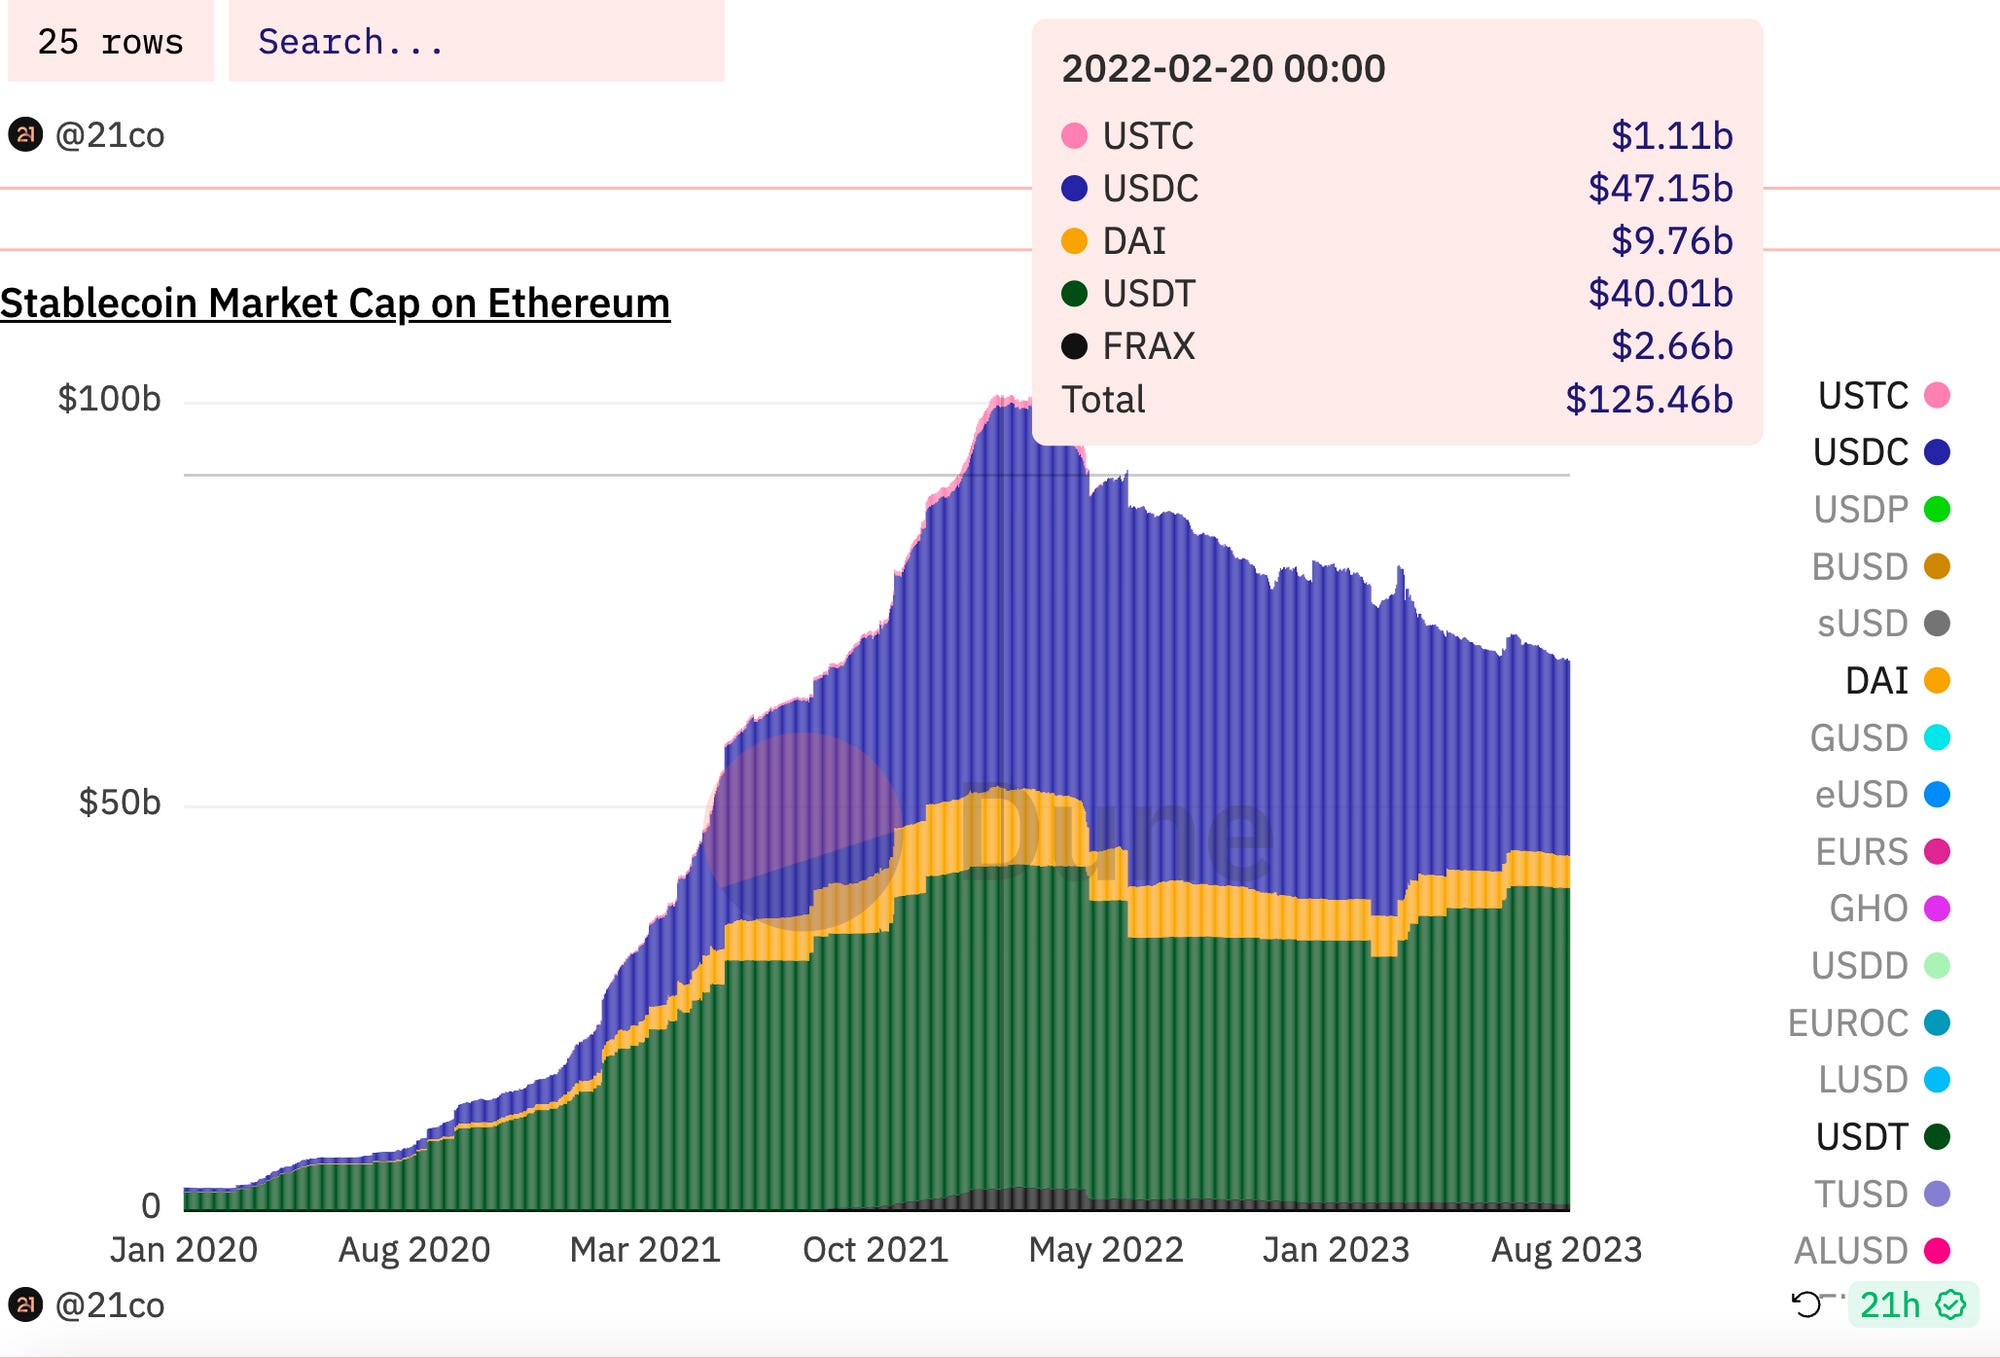
The timeline depicted below can be summarized as follows:
-
2021.1: On-chain USDC market cap began rapid growth.
-
2021.5: Uniswap V3 launched. Users started trading stablecoins on Uniswap, although at this stage, Uniswap V3’s volume still lagged behind Curve’s.
-
2021.9–2022.4: The "Curve War" intensified, with algorithmic stablecoins like FRAX, UST, and MIM seeing surges in both TVL and trading volume.
-
2022.5: UST collapsed, drastically reducing demand for Curve War-related incentives.
-
2022.7: Uniswap's Stable-Stable (S-S) trading volume began consistently exceeding Curve’s.
- 2023.4: After the Shanghai upgrade allowed stETH to exit 1:1 via Lido Buffer, demand for Curve as a liquidity venue declined.
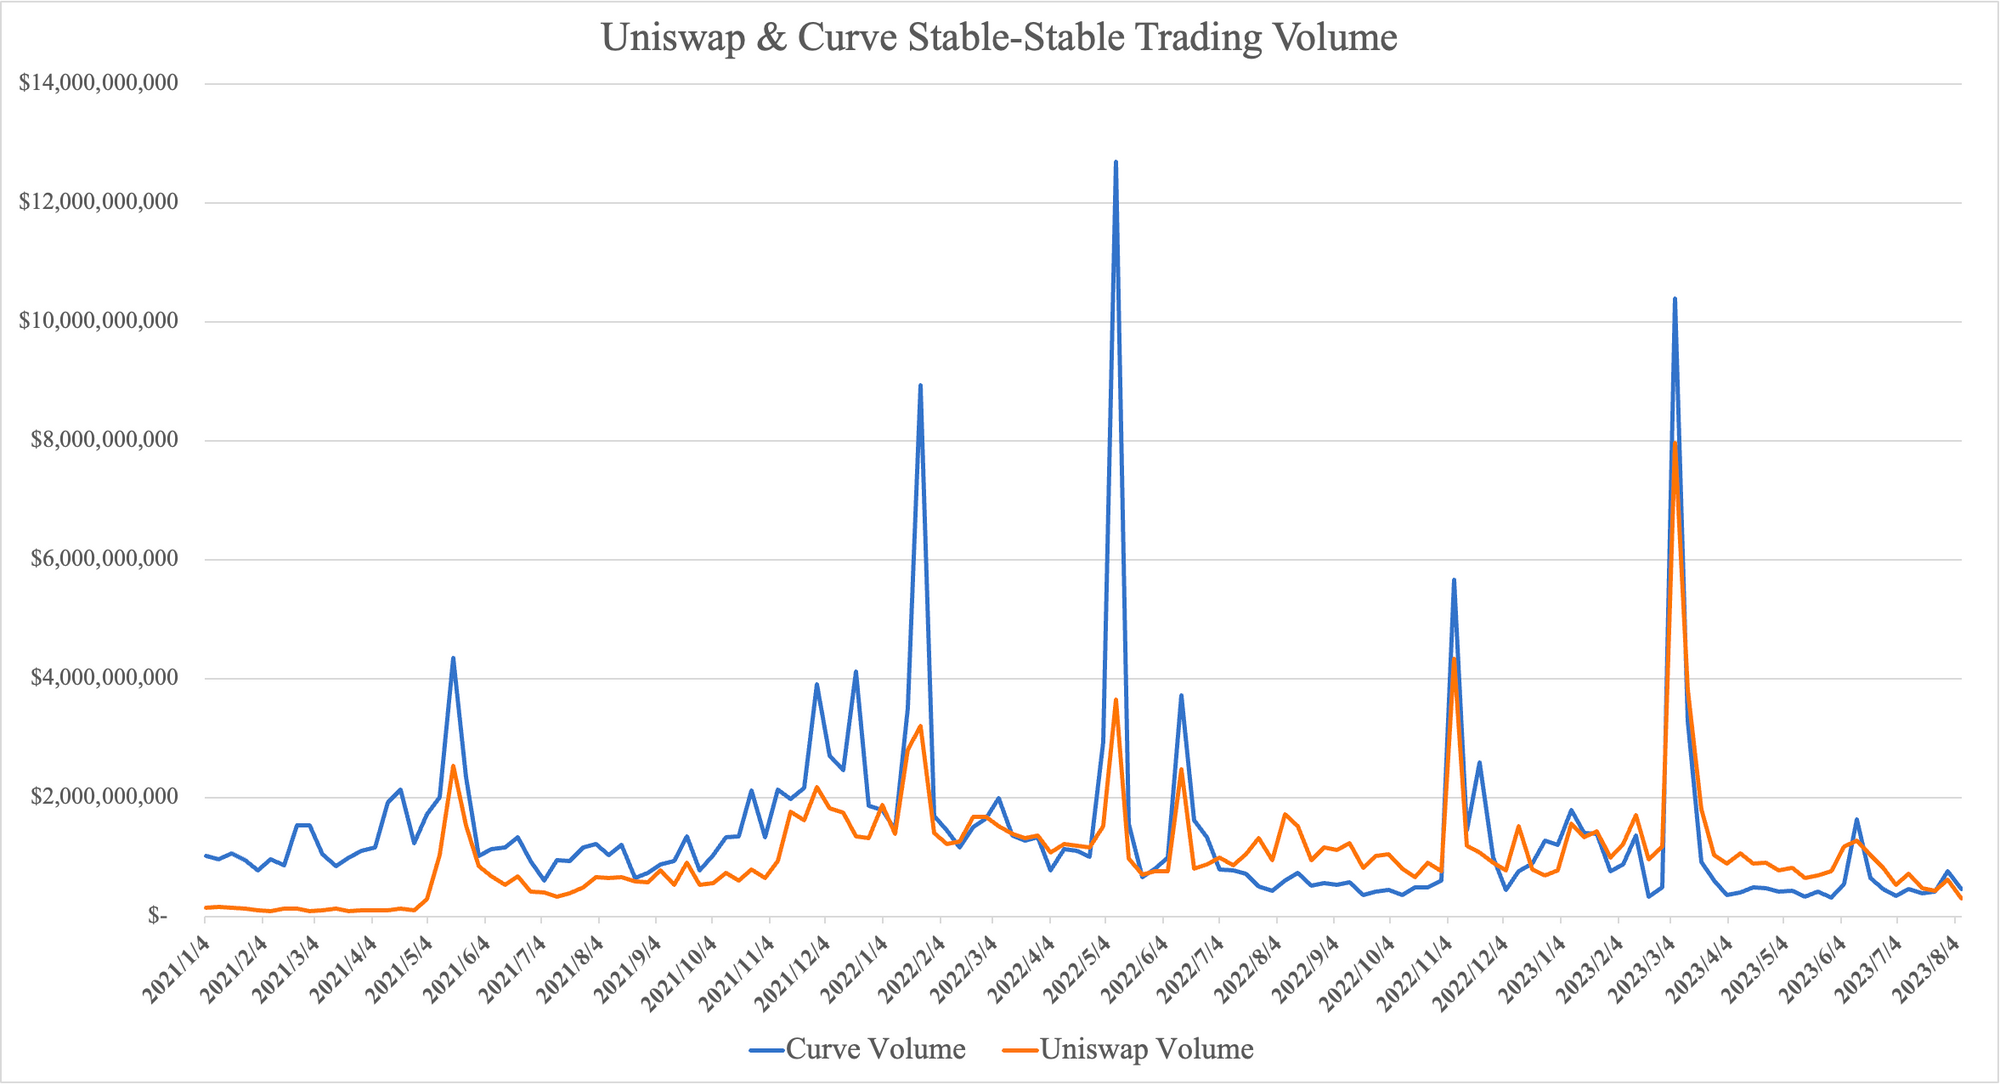
To help readers better understand the development trajectory of stablecoin swaps, we will break down stablecoin swap transactions into two categories below: traditional stablecoin swaps (USDT, USDC, DAI) and emerging stablecoin swaps (FRAX and UST), analyzing each separately.
Traditional Stablecoins: Stability with Slight Decline
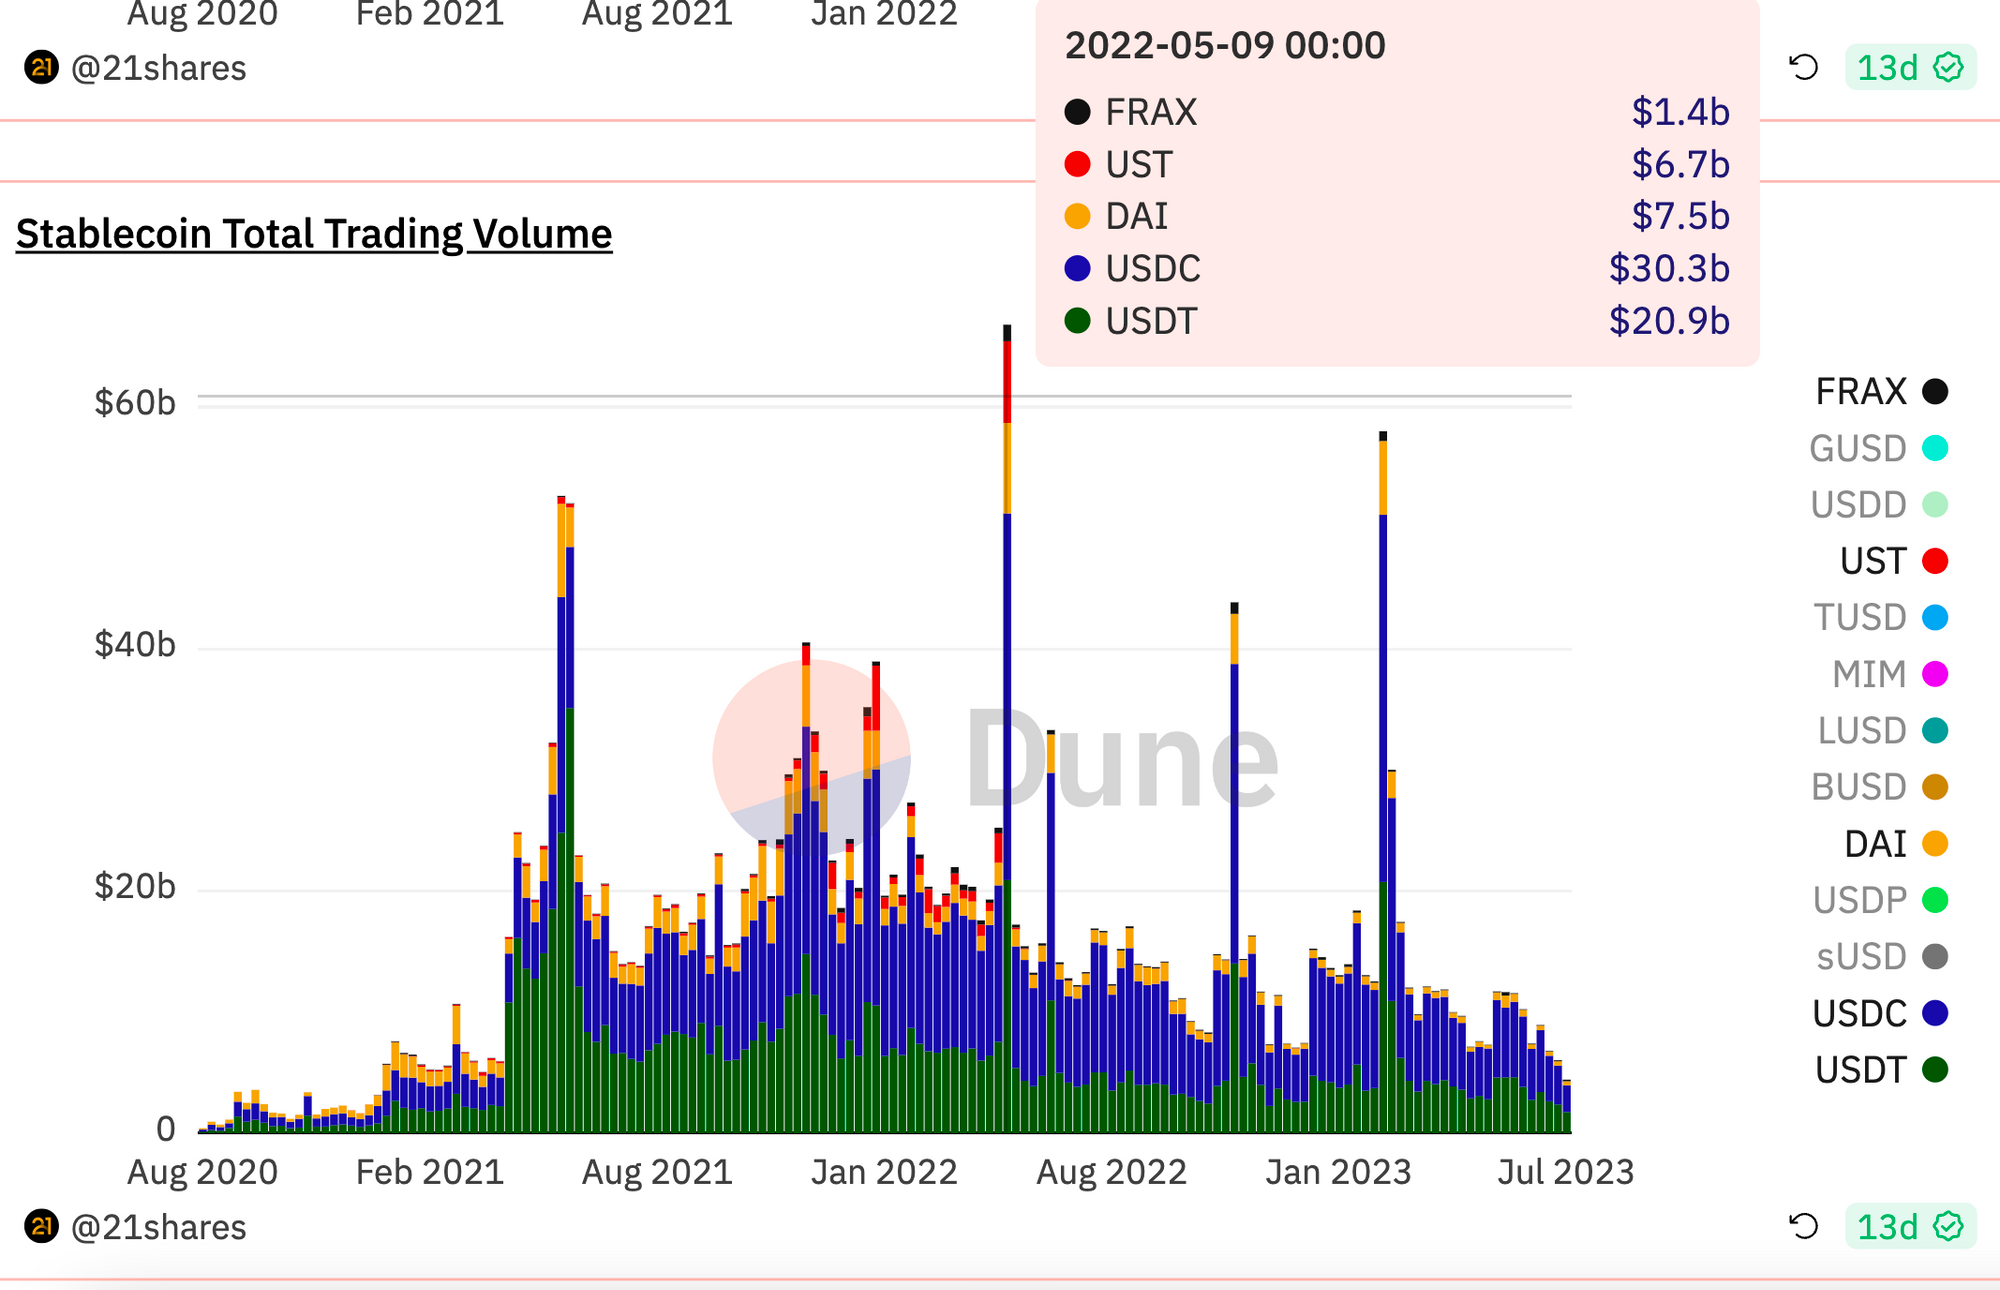
We can see that traditional stablecoin trading volume saw a significant increase in April 2021, primarily driven by the rapid expansion of USDC’s market cap. Mainstream stablecoin swap volumes remained relatively stable until the UST collapse. After May 2022, when UST failed, overall stablecoin swap volume began a gradual decline.
Emerging Stablecoins: Fleeting Rise and Competition for Curve
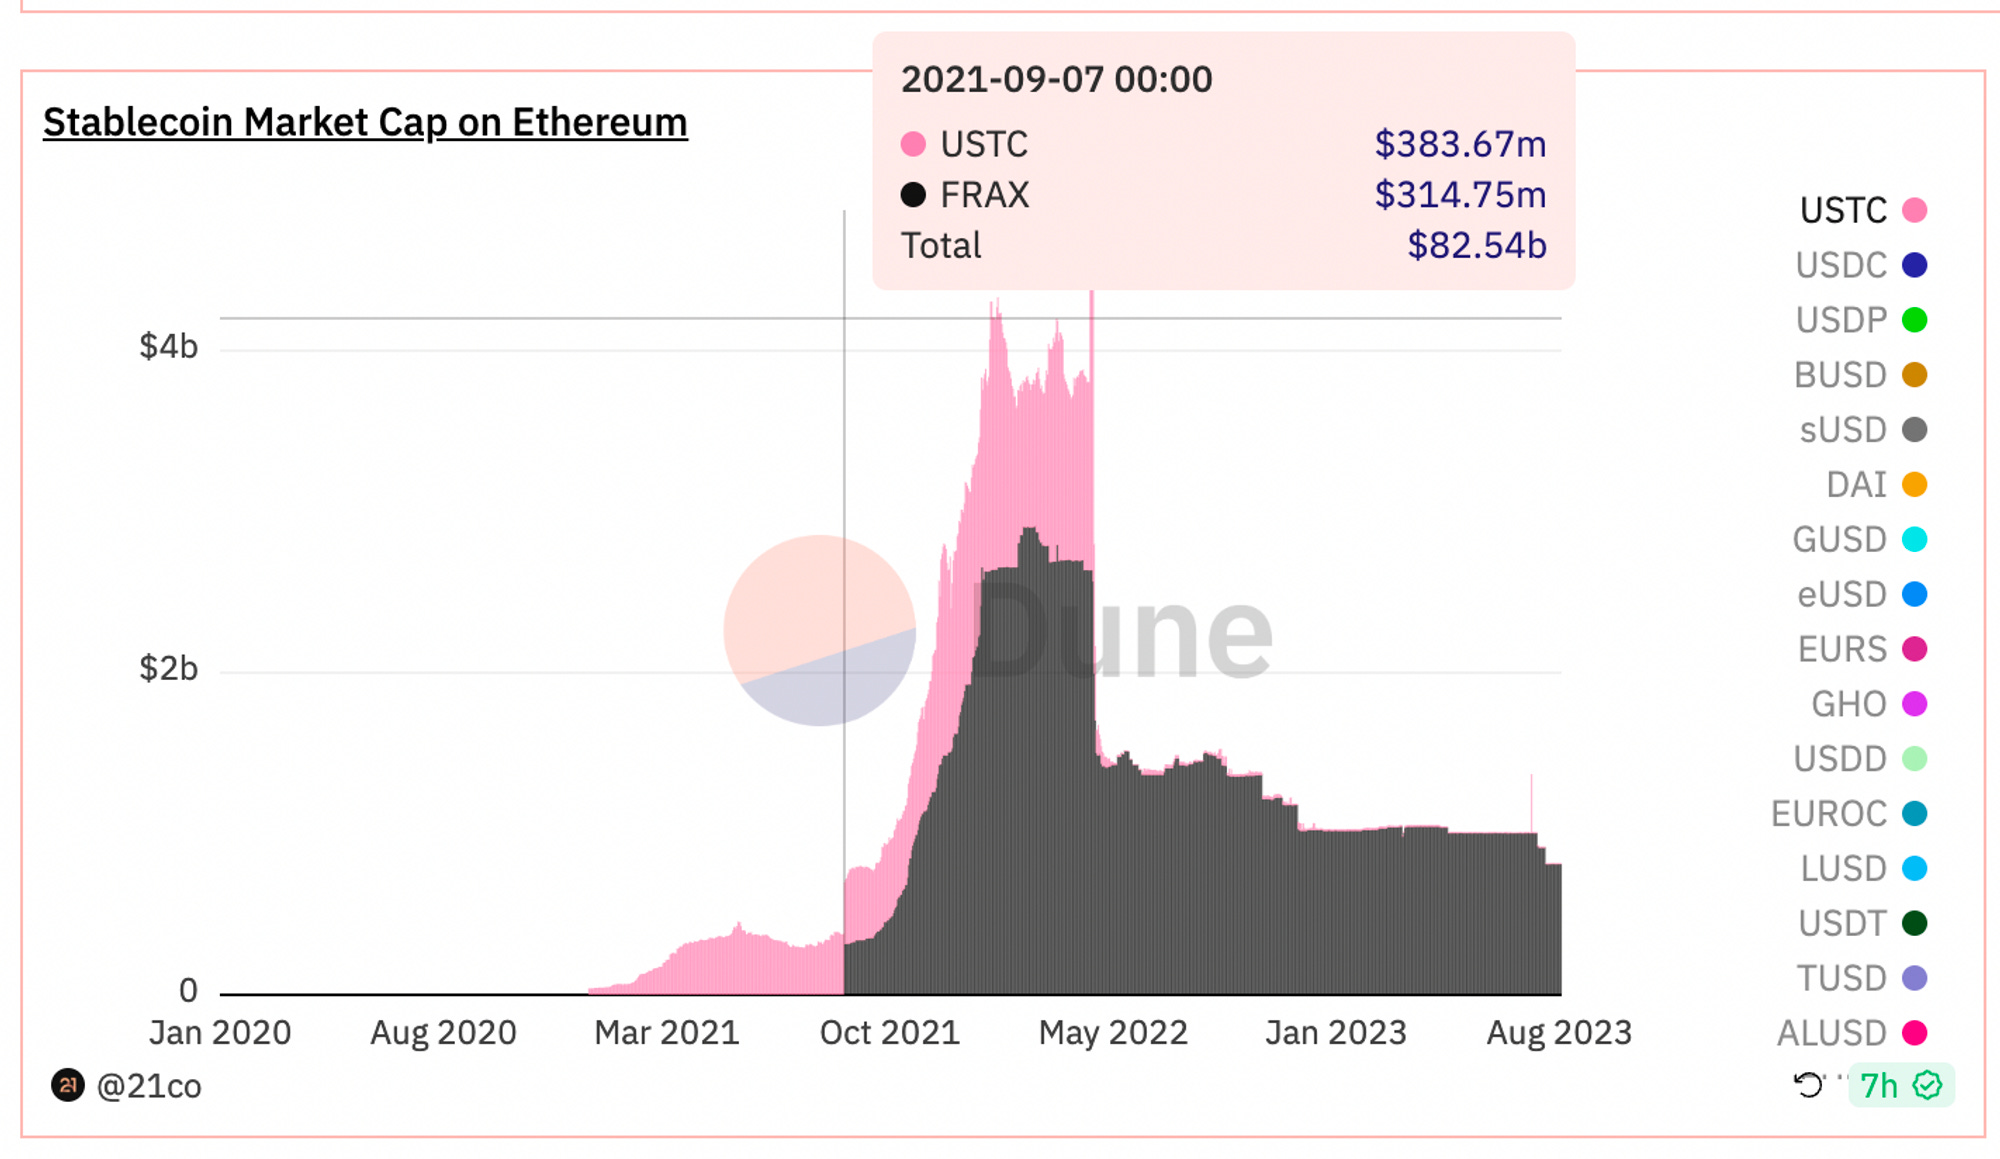
By examining the data charts below, we can clearly observe the market cap trends of FRAX and pre-collapse UST. From March 2021 onward, UST’s market cap steadily rose, experiencing explosive growth alongside FRAX starting in September of that year.
As shown below, UST’s trading volume surge began in November 2021. At its peak, UST accounted for up to 10% of total stablecoin trading volume. For algorithmic stablecoins like UST, establishing credible backing is essential to maintaining price pegs. Notably, most of this new trading volume was captured by Curve, highlighting Curve’s critical role for algorithmic stablecoins at the time.
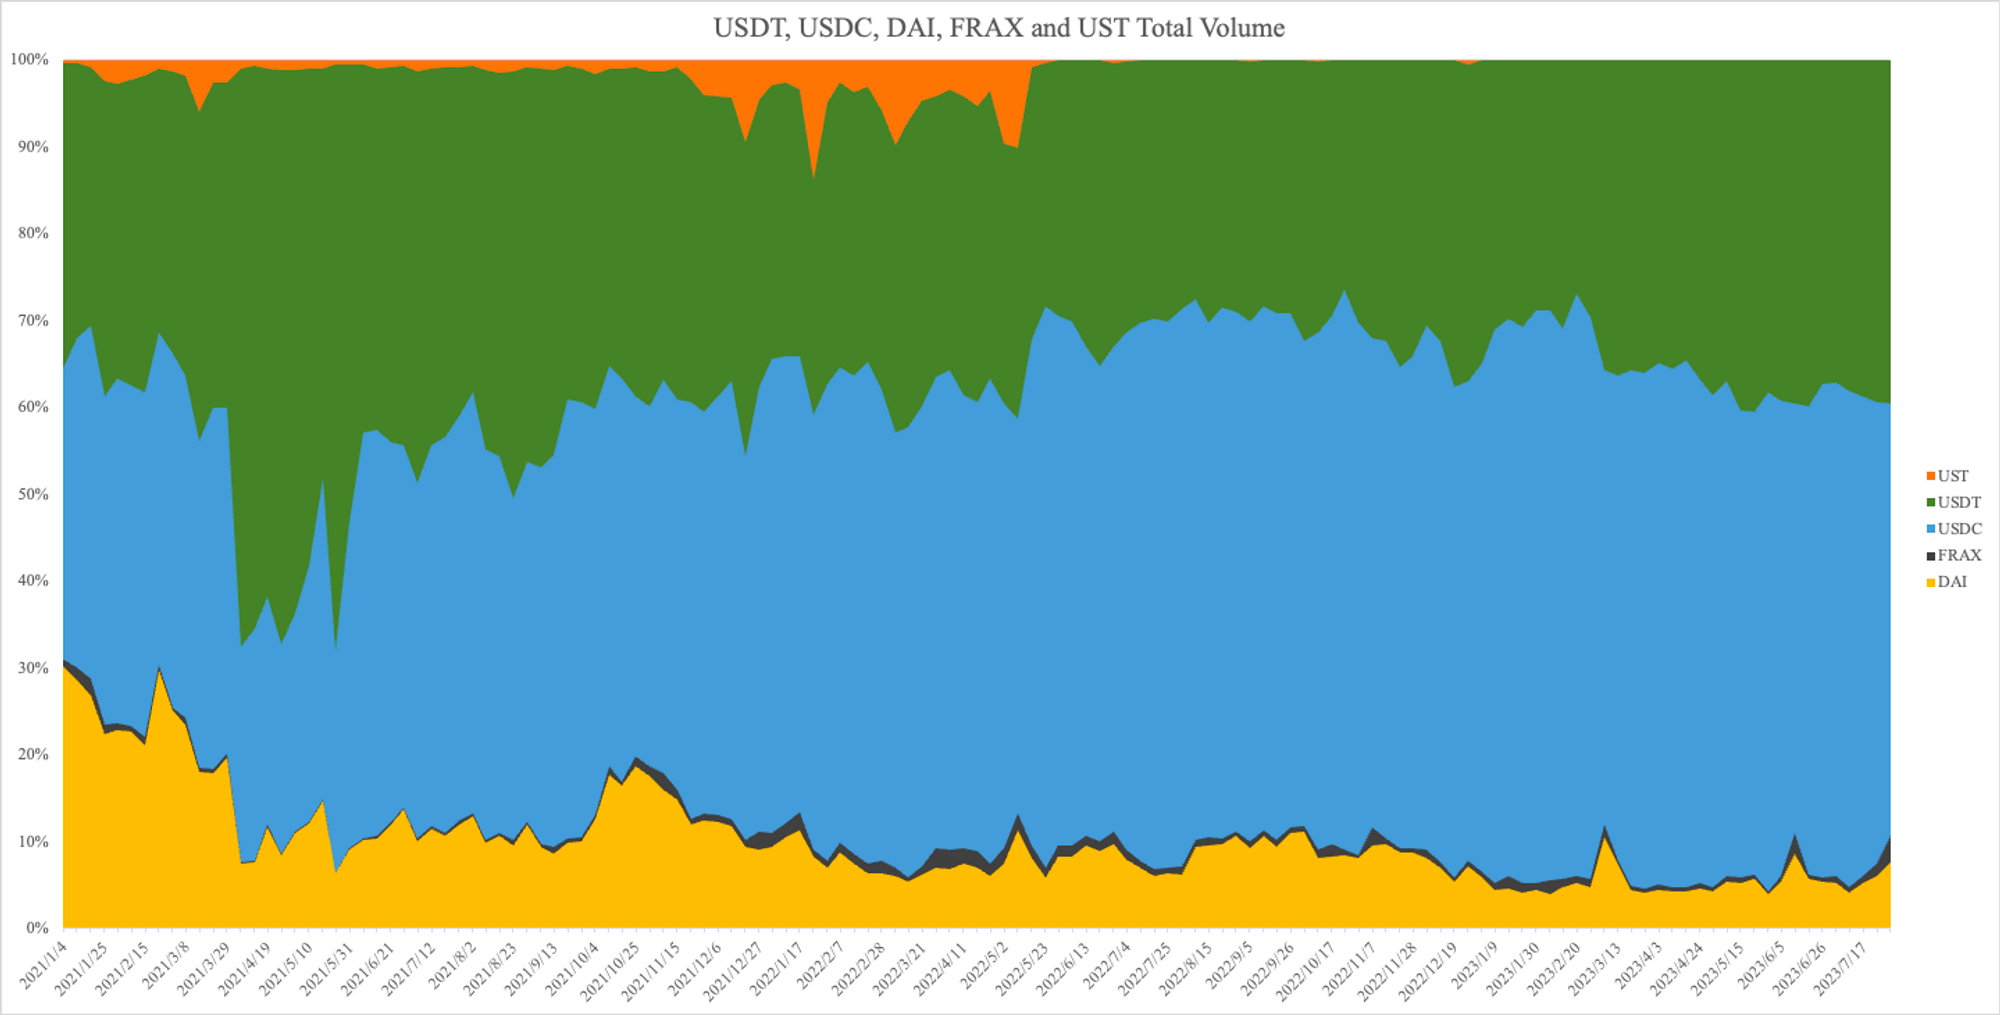
From Liquidity Spillover Driven by Window Dressing to Real Transaction Demand in a Mature Market
Before delving deeper into why Curve captured so much algorithmic stablecoin volume, let us introduce a key concept: window dressing.
Window dressing is a term commonly used in traditional finance, referring to actions taken by fund managers to make their portfolios appear healthier, more successful, or compliant with certain standards in public reports.
During that period, it was evident that Curve exhibited strong window-dressing effects across the stablecoin market.
Former U.S. Treasury Secretary Timothy Geithner once made a famous statement:
“I want the windows filled with money—enough to match any possible debt.”
Typically, window dressing carries negative connotations. However, in Curve’s context, this effect could be seen as neutral or even positive, serving a necessary and rational purpose. Unlike Uniswap’s minimalist interface, Curve openly displays its TVL, enabling credibility spillover from established stablecoins to newer ones—an advantage Uniswap lacks. Under these conditions, users tend to believe that whether holding major stablecoins or smaller algorithmic ones, they are backed by billions in pooled value. For stablecoin projects, large TVL helps reinforce network effects, encouraging them to actively participate in Curve to appear “more successful” and “healthier,” as per the definition. The later costs of veCRV vote-buying only became relevant after the bull market receded.
Curve’s core objective was to help emerging stablecoins build “window” credibility. Yet today, following UST’s failure and the near-total discrediting of the algorithmic stablecoin narrative, market demand for credibility-building has diminished, giving way to genuine transaction demand.
Currently, further vertical innovation in AMM mechanisms among major DEXs has shifted competitive focus away from TVL size toward capital efficiency—achieving greater trading depth and better pricing to capture larger shares of transaction volume. This also explains the fundamental reason behind Uniswap surpassing Curve in S-S trading volume, mentioned earlier.
Regarding whether Curve remains the leader in the stablecoin market: from a window-dressing perspective, the crypto space indeed needs a showcase platform. Curve not only highlights strong financial backing behind stablecoins but also offers users a sense of security and trust.
However, during periods of declining industry and DeFi attention, both users and projects show significantly reduced demand for such showcase platforms. Instead, greater emphasis is placed on real transaction demand within existing markets. In this environment, claiming Curve remains the leading stablecoin trading platform appears increasingly difficult. As market dynamics and user needs evolve, new leaders may emerge—or the market structure may become more fragmented.
Established Giants Battle Evenly While Newcomers Begin to Shine
In this section, we analyze the current competitive landscape of stablecoin DEXs, using mainstream stablecoin-to-stablecoin trades (e.g., USDT, USDC, DAI) as our starting point, focusing on mechanisms and trends.
As discussed previously, we’ve analyzed Uniswap and Curve’s shifting trends in stablecoin swap volumes. Curve maintained a certain market share due to first-mover advantage, while Uniswap gradually caught up thanks to the high capital efficiency enabled by V3. With 1inch already widely adopted, competition in the stablecoin swap market has become extremely flat and fierce. Since the vast majority of stablecoin-to-stablecoin trading volume centers around the three major stablecoins—USDC, USDT, and DAI—the competition among DEXs largely boils down to lower slippage and reduced fees. Winners attract more trading volume, thereby generating higher APYs for LPs.
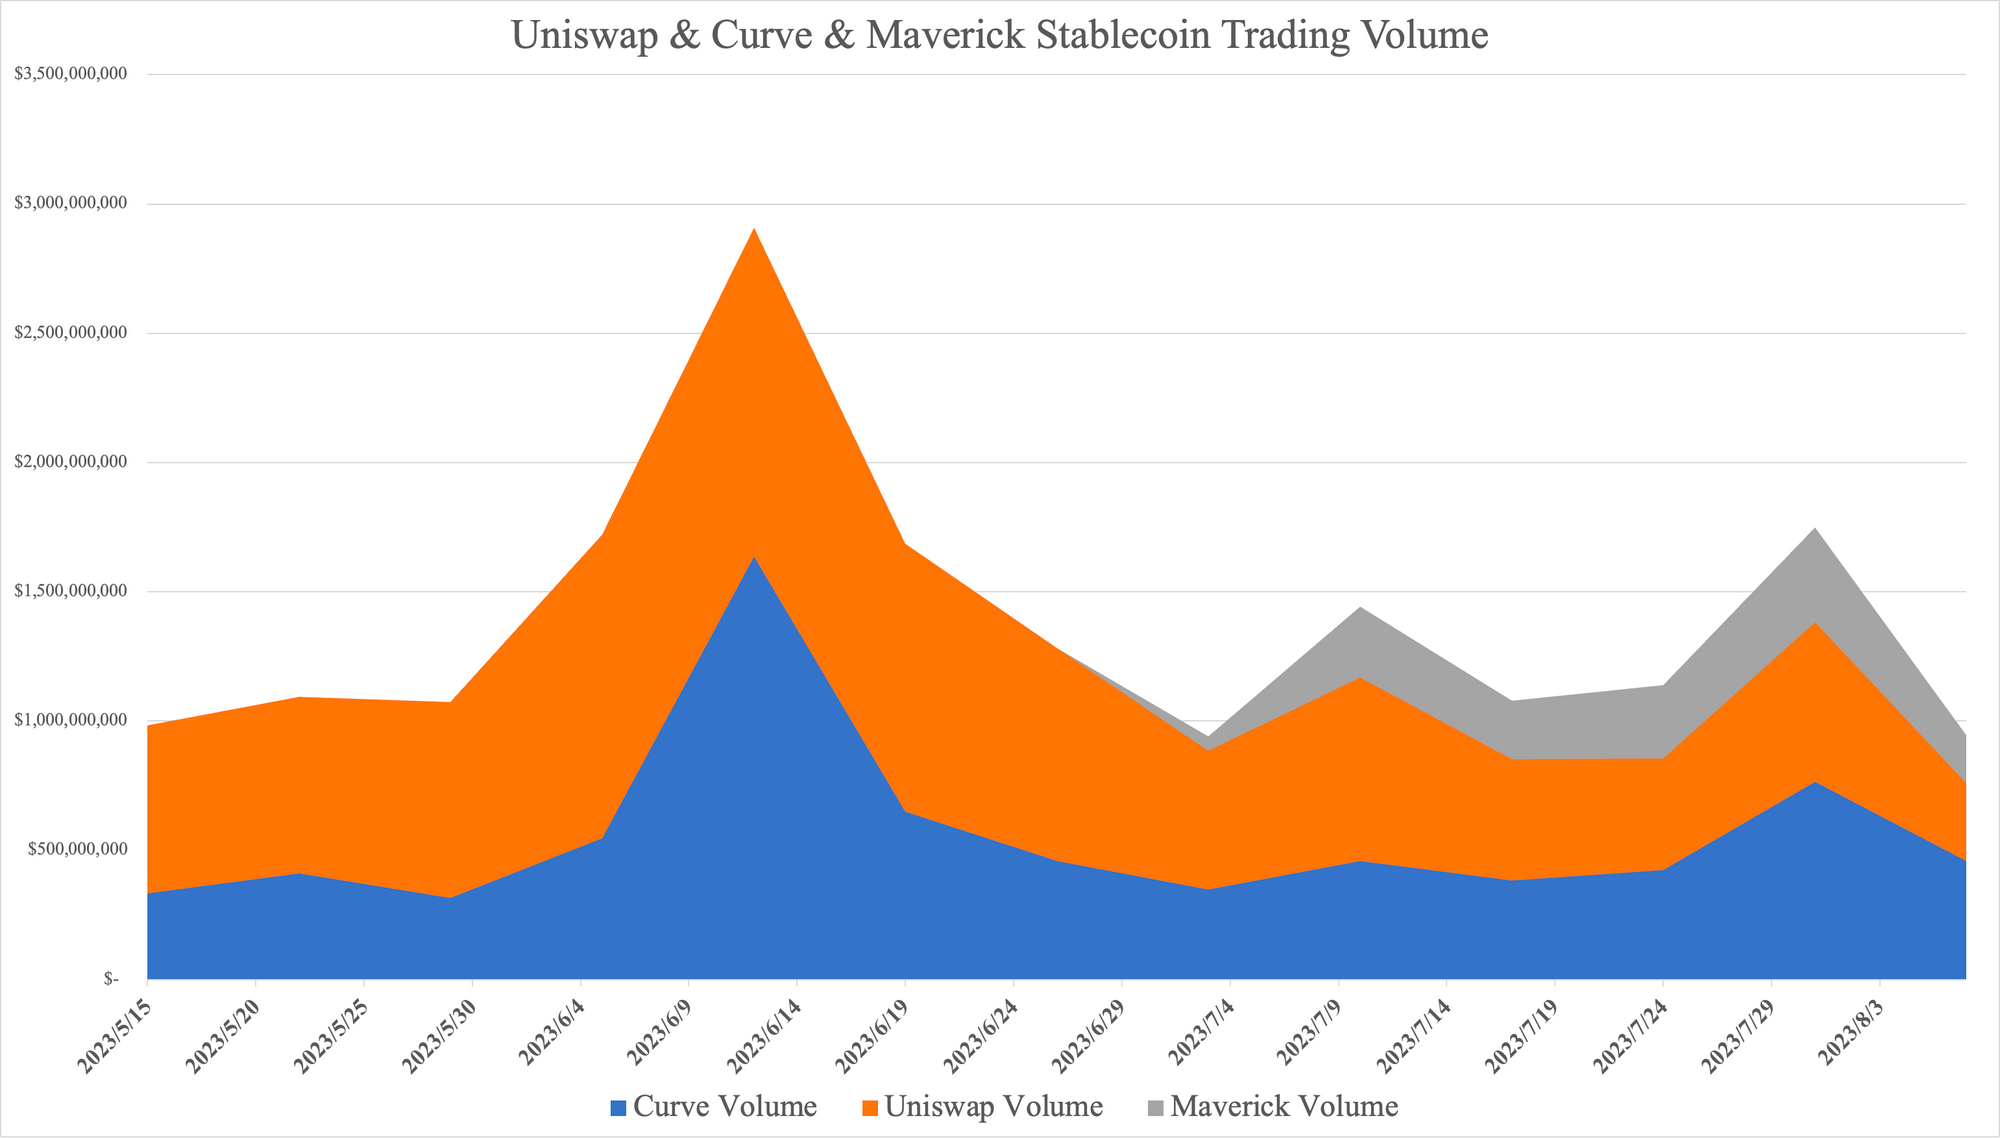
The chart below shows recent changes in stablecoin-to-stablecoin swap volume. It reveals that the competitive格局 between Uniswap and Curve has largely stabilized. However, notably, since July, Maverick’s market share has increased significantly, successfully capturing part of the existing market and reducing Uniswap and Curve’s shares.
Let’s take a closer look at Maverick. Maverick is a unique decentralized exchange (DEX) whose core mechanism adjusts LP ranges based on time-weighted average prices (TWAP), concentrating liquidity around the current market price to offer superior trading depth. Maverick provides four modes (Left, Right, Both, Static), allowing LPs to express directional views (predicting price increases or decreases), helping them adapt to unidirectional rallies, drops, or sideways markets. For liquidity providers, Maverick greatly reduces management overhead and enables higher returns when correctly anticipating market direction. As a result, this automated liquidity-following mechanism dramatically enhances Maverick’s capital efficiency.
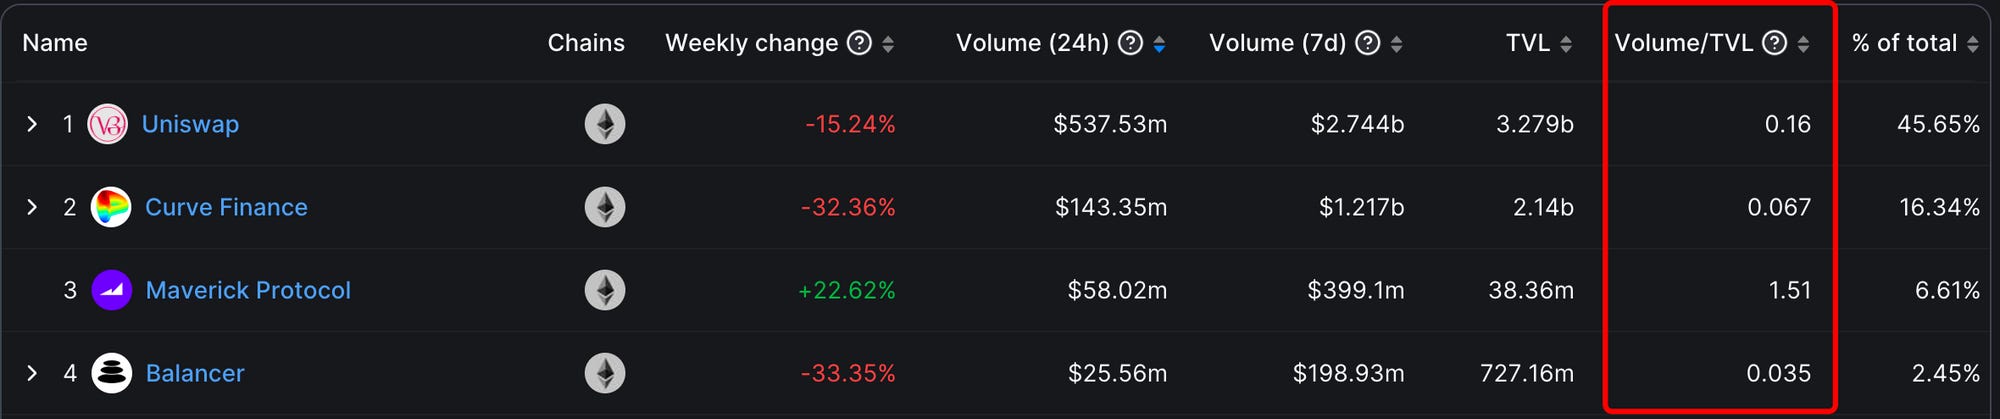
Capital efficiency can be measured by “volume / TVL”—i.e., what proportion of a DEX’s daily trading volume is supported by its actual TVL.
The chart below shows capital efficiency for major DEXs on Ethereum. According to the data, Uniswap’s volume/TVL ratio is approximately 0.16, meaning 16% of its TVL actively participates in trading. In contrast, Curve’s capital efficiency is lower, with only 6.7% of capital utilized in trades—further confirming Curve’s strong window-dressing effect. Maverick stands out as the only DEX where trading volume exceeds TVL, achieving a capital efficiency of 151%, far surpassing competitors.
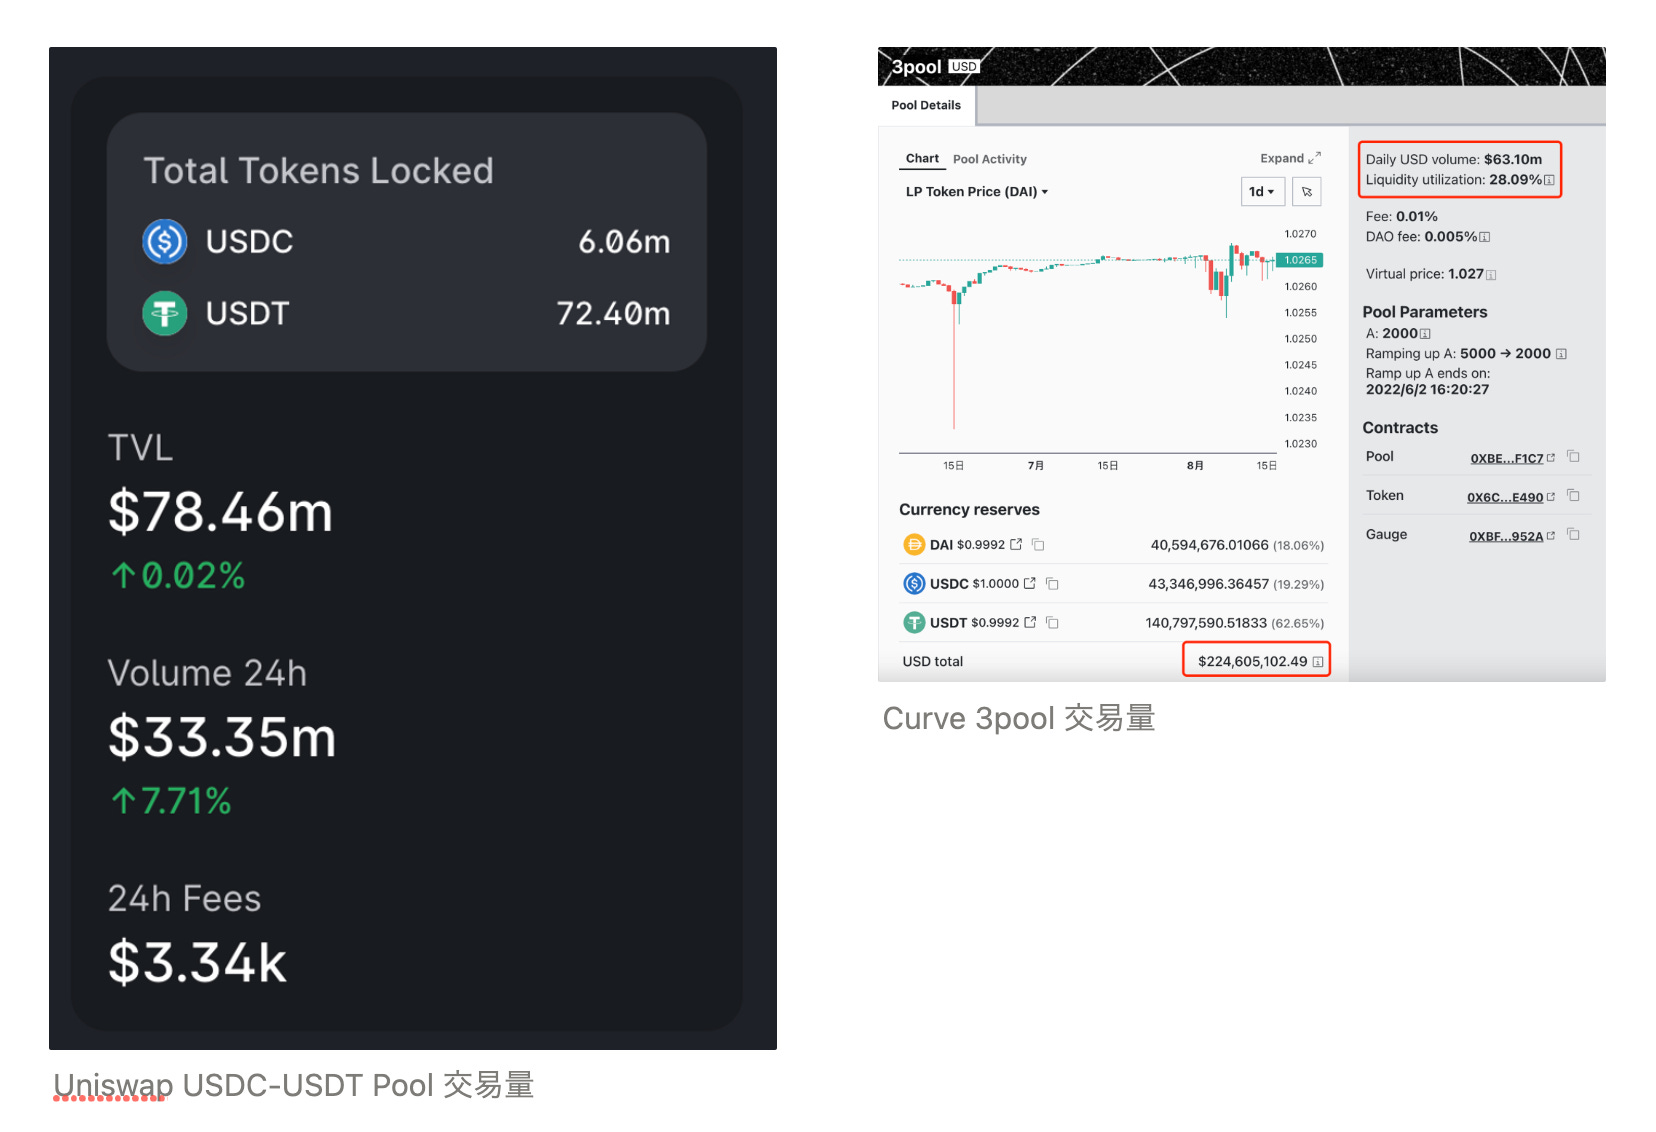
Further analysis of Maverick’s TVL reveals that 90% of its trading volume ($66M USD) is driven by the USDC-USDT pair, which accounts for less than 7% of its TVL ($3M USD). That means Maverick achieves a capital efficiency of over 2000% in stablecoin pairs—far exceeding metrics for comparable pools on Uniswap V3 and Curve’s 3pool.
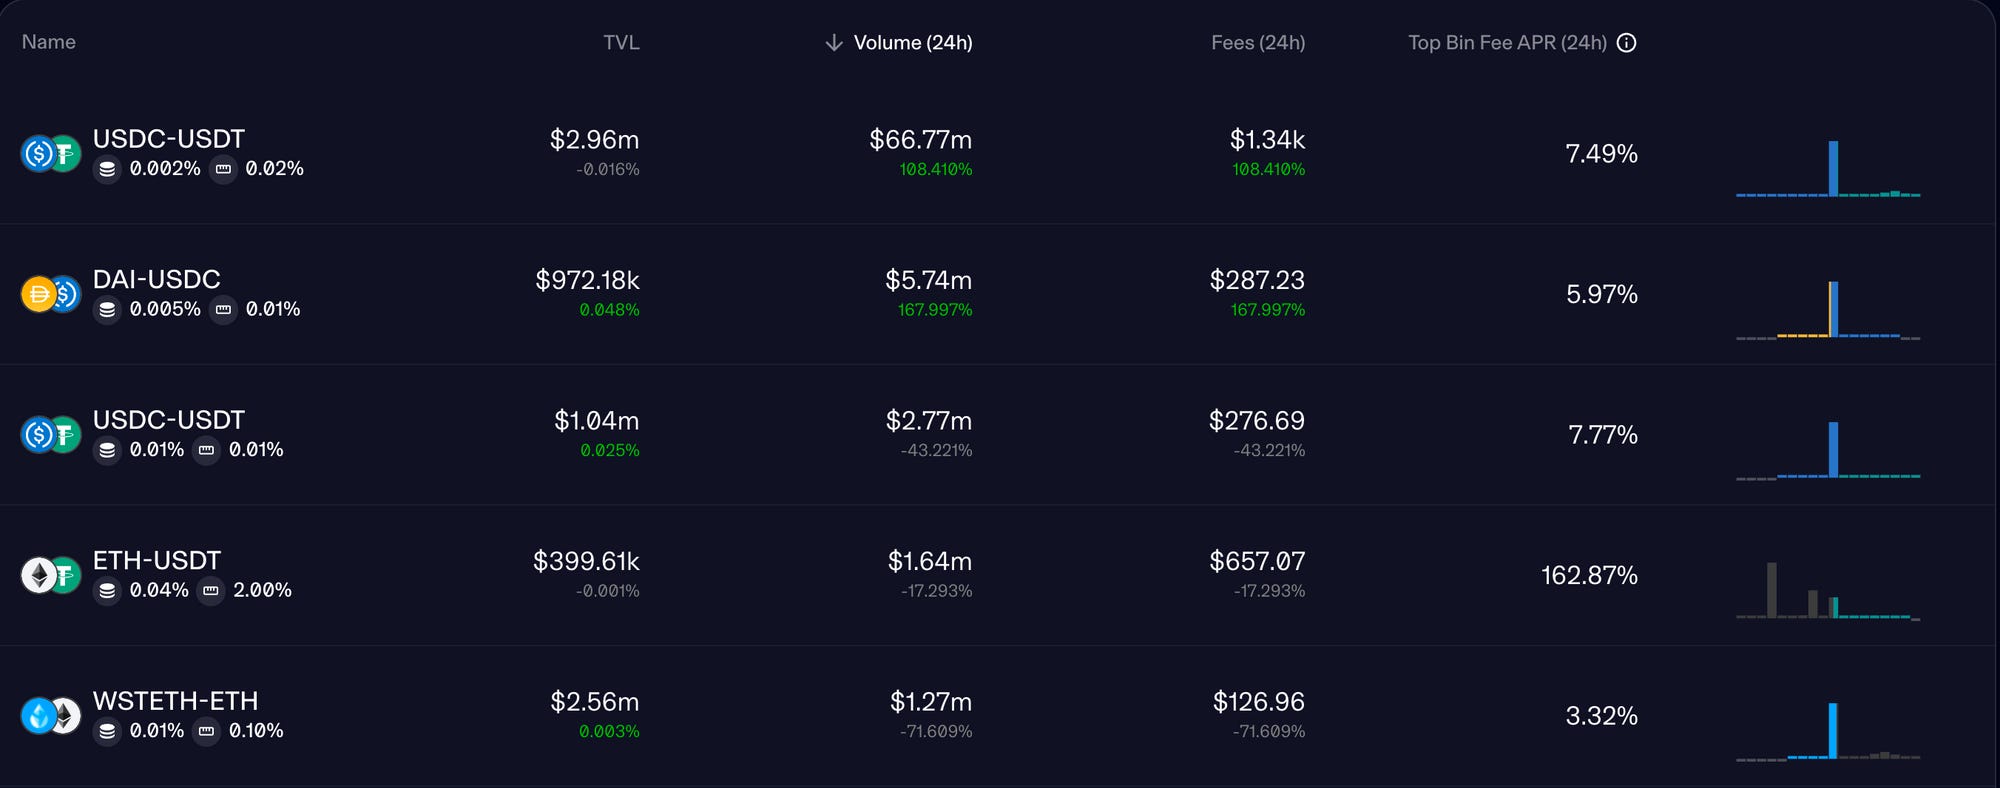 Maverick Daily Trading Volume
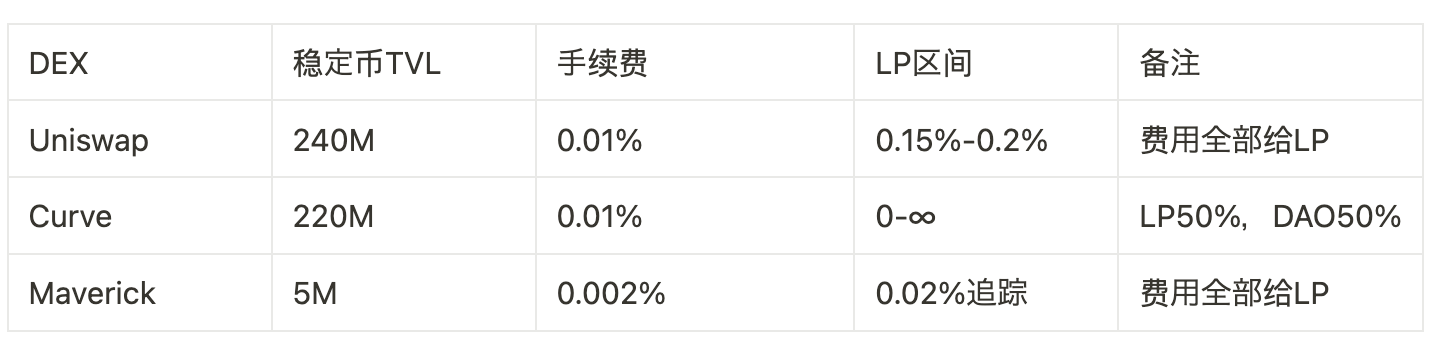
Next, we examine fee structures and liquidity distribution across major DEXs. Data clearly shows that Uniswap and Curve charge identical fees, both higher than Maverick’s—a competitive advantage for attracting traders.
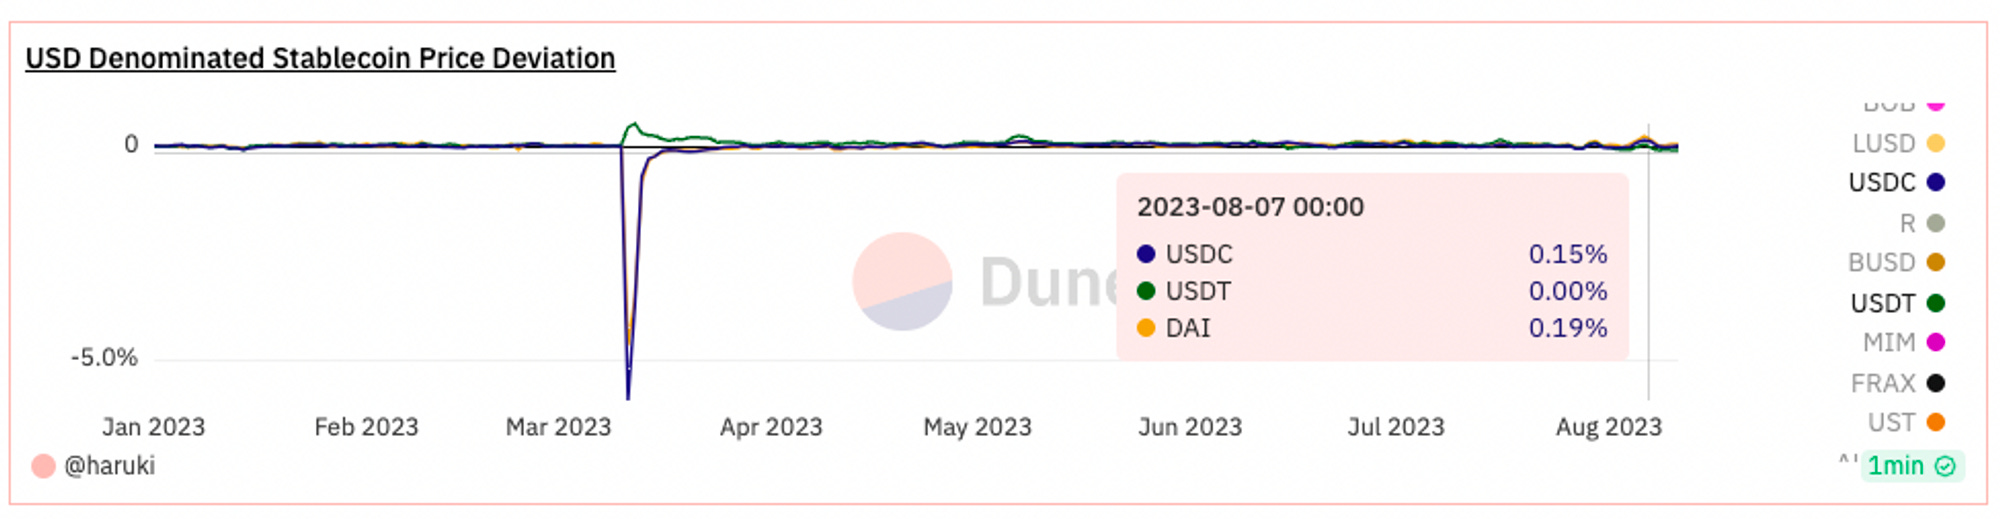
We can further analyze historical price volatility of USDC, USDT, and DAI using the chart below. The data shows that a 0.2% price fluctuation represents roughly the maximum normal swing—consistent with Uniswap’s preset trading range, indicating reasonable configuration for stablecoin pairs. Maverick slices Uniswap V3’s LP ranges into ten parts, dynamically tracking the stablecoin market price to create deeper liquidity than Uniswap, thus capturing more volume and delivering higher APY to users.
We can conclude that Maverick demonstrates clear advantages in capital efficiency and fee structure, likely explaining its rapid rise and ability to capture market share from Uniswap and Curve.
Main Theme Two: Aggregators Fueling Price Wars

Currently, the leading player in the aggregator space is undoubtedly 1inch. Below, we cite several datasets to demonstrate aggregators’ significance in DEX trading volume:
First, over half (about 60%) of Uniswap’s trading volume comes from various MEV activities. Second, on Ethereum mainnet, Uniswap accounts for about 50% of total DEX volume. Based on these figures, we estimate that 20% of total DEX volume comes from non-MEV Uniswap traders, another 20% from other DEXs, and 60% from MEV bots.
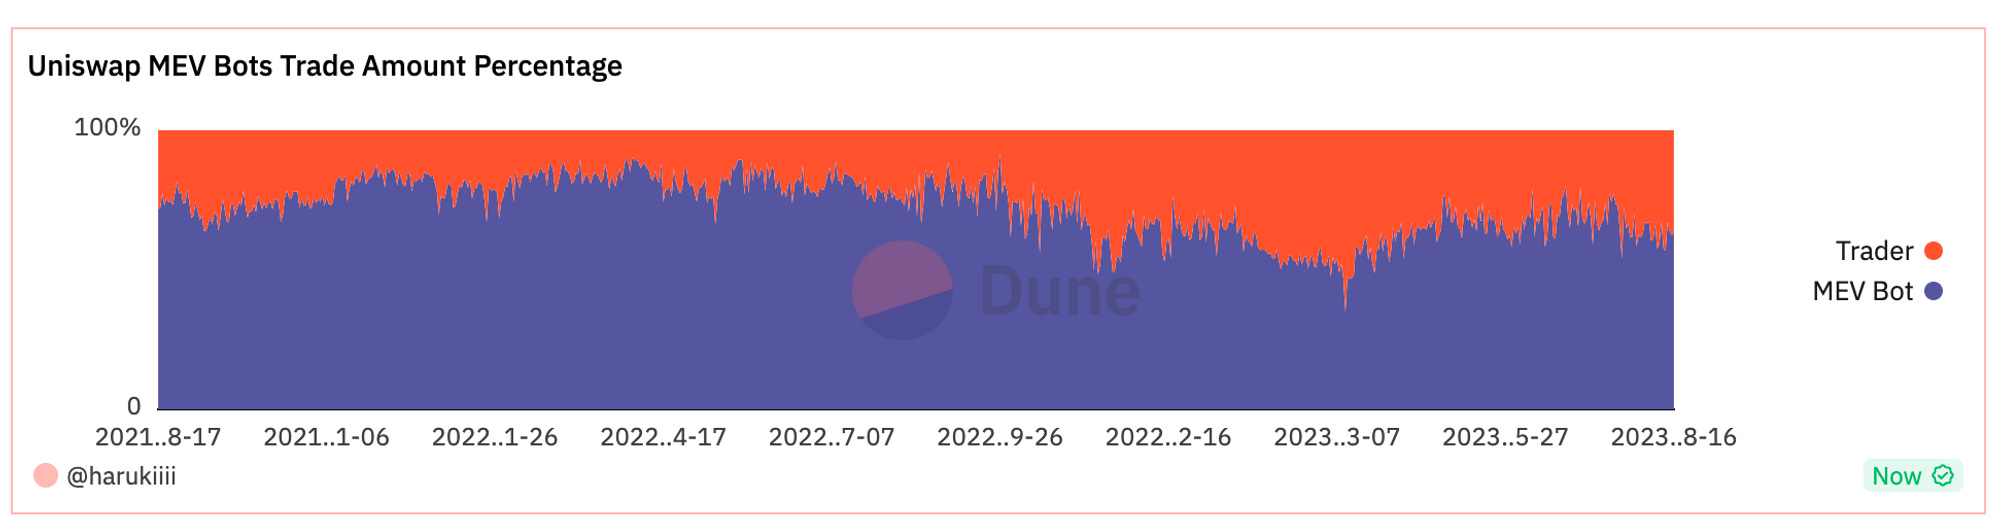
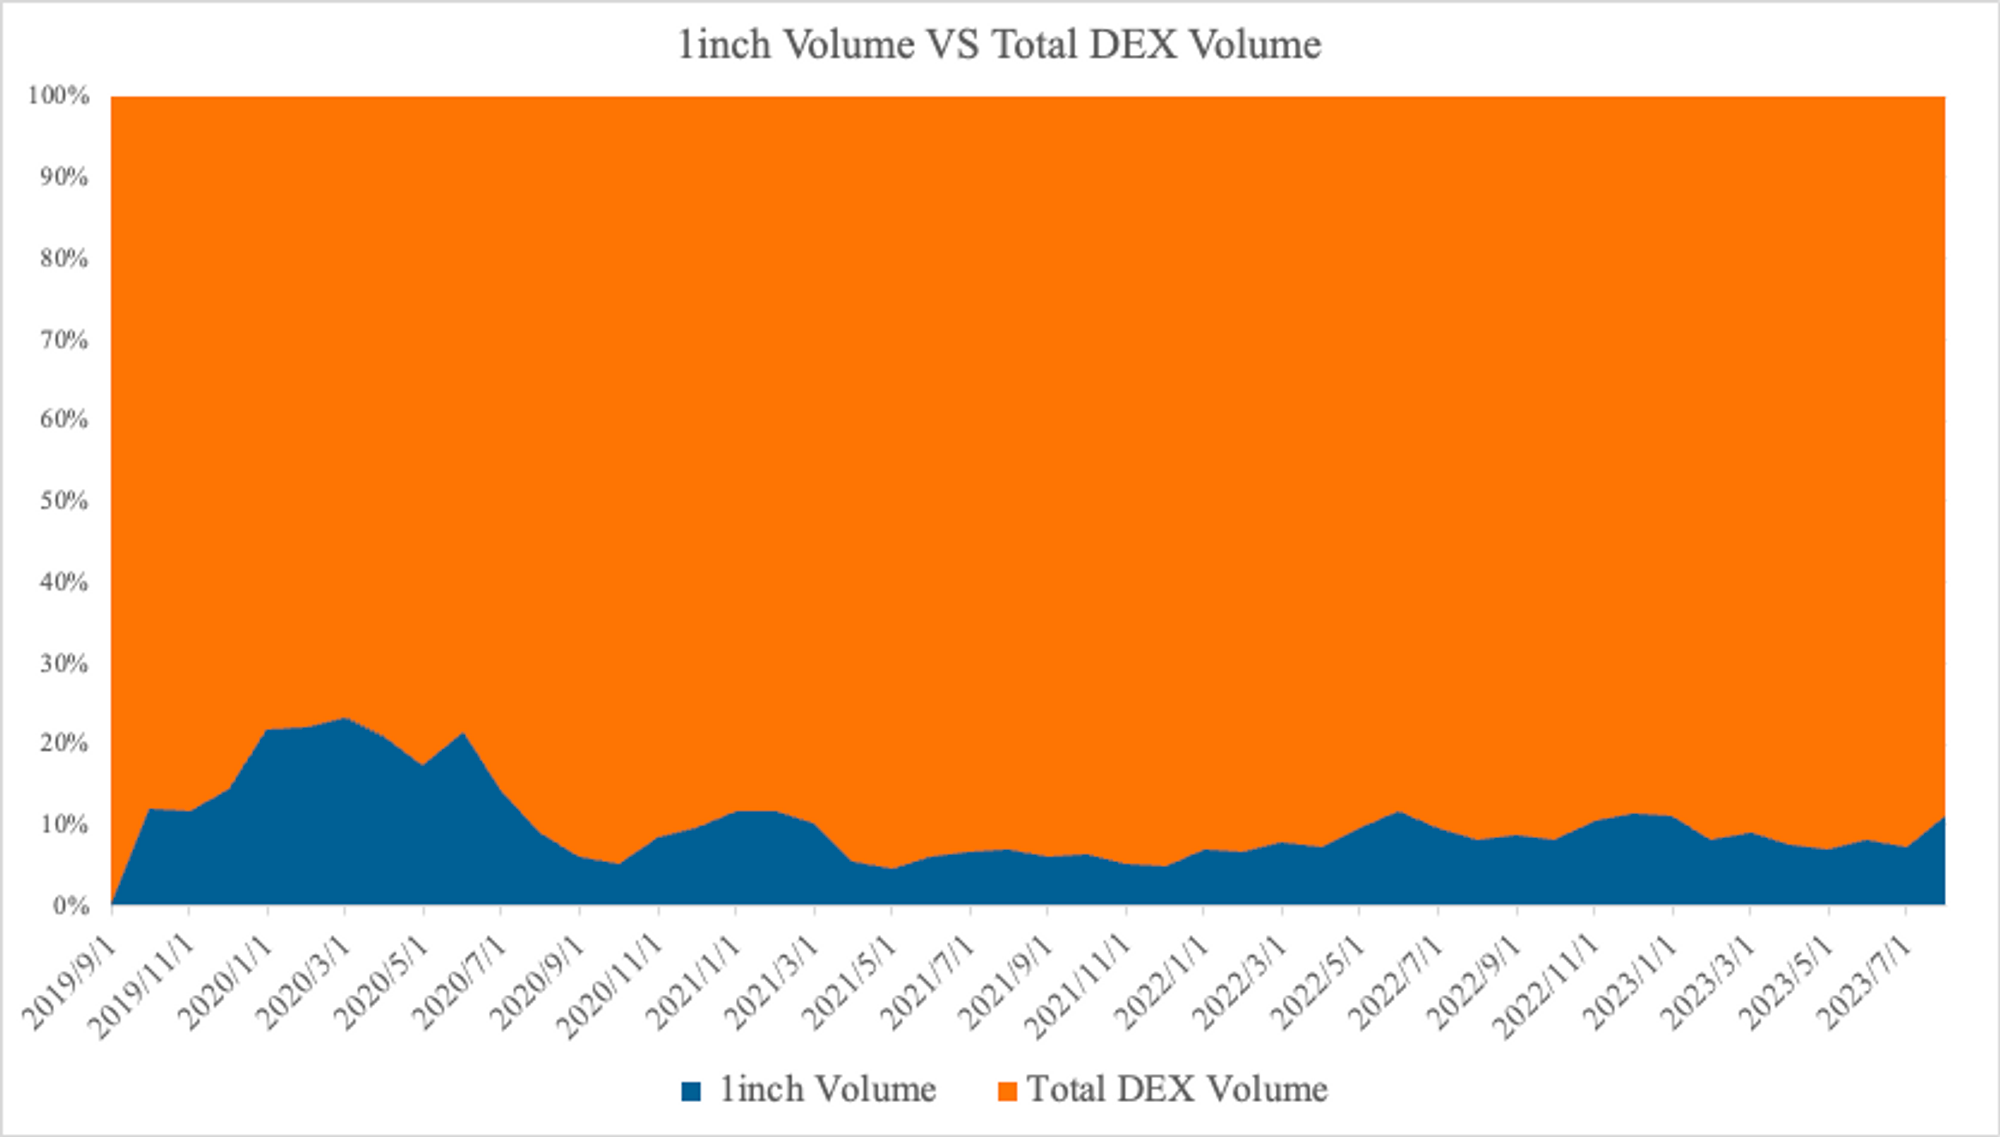
Currently, 1inch accounts for about 10% of total DEX volume. Given its ~50% share of the aggregator market, we infer that aggregators contribute roughly 20% of total DEX volume. Since MEV bots don’t use aggregators, we assume nearly all aggregator volume stems from real traders. Thus, we can roughly estimate that 40%-50% of real user trading volume on DEXs flows through aggregators.
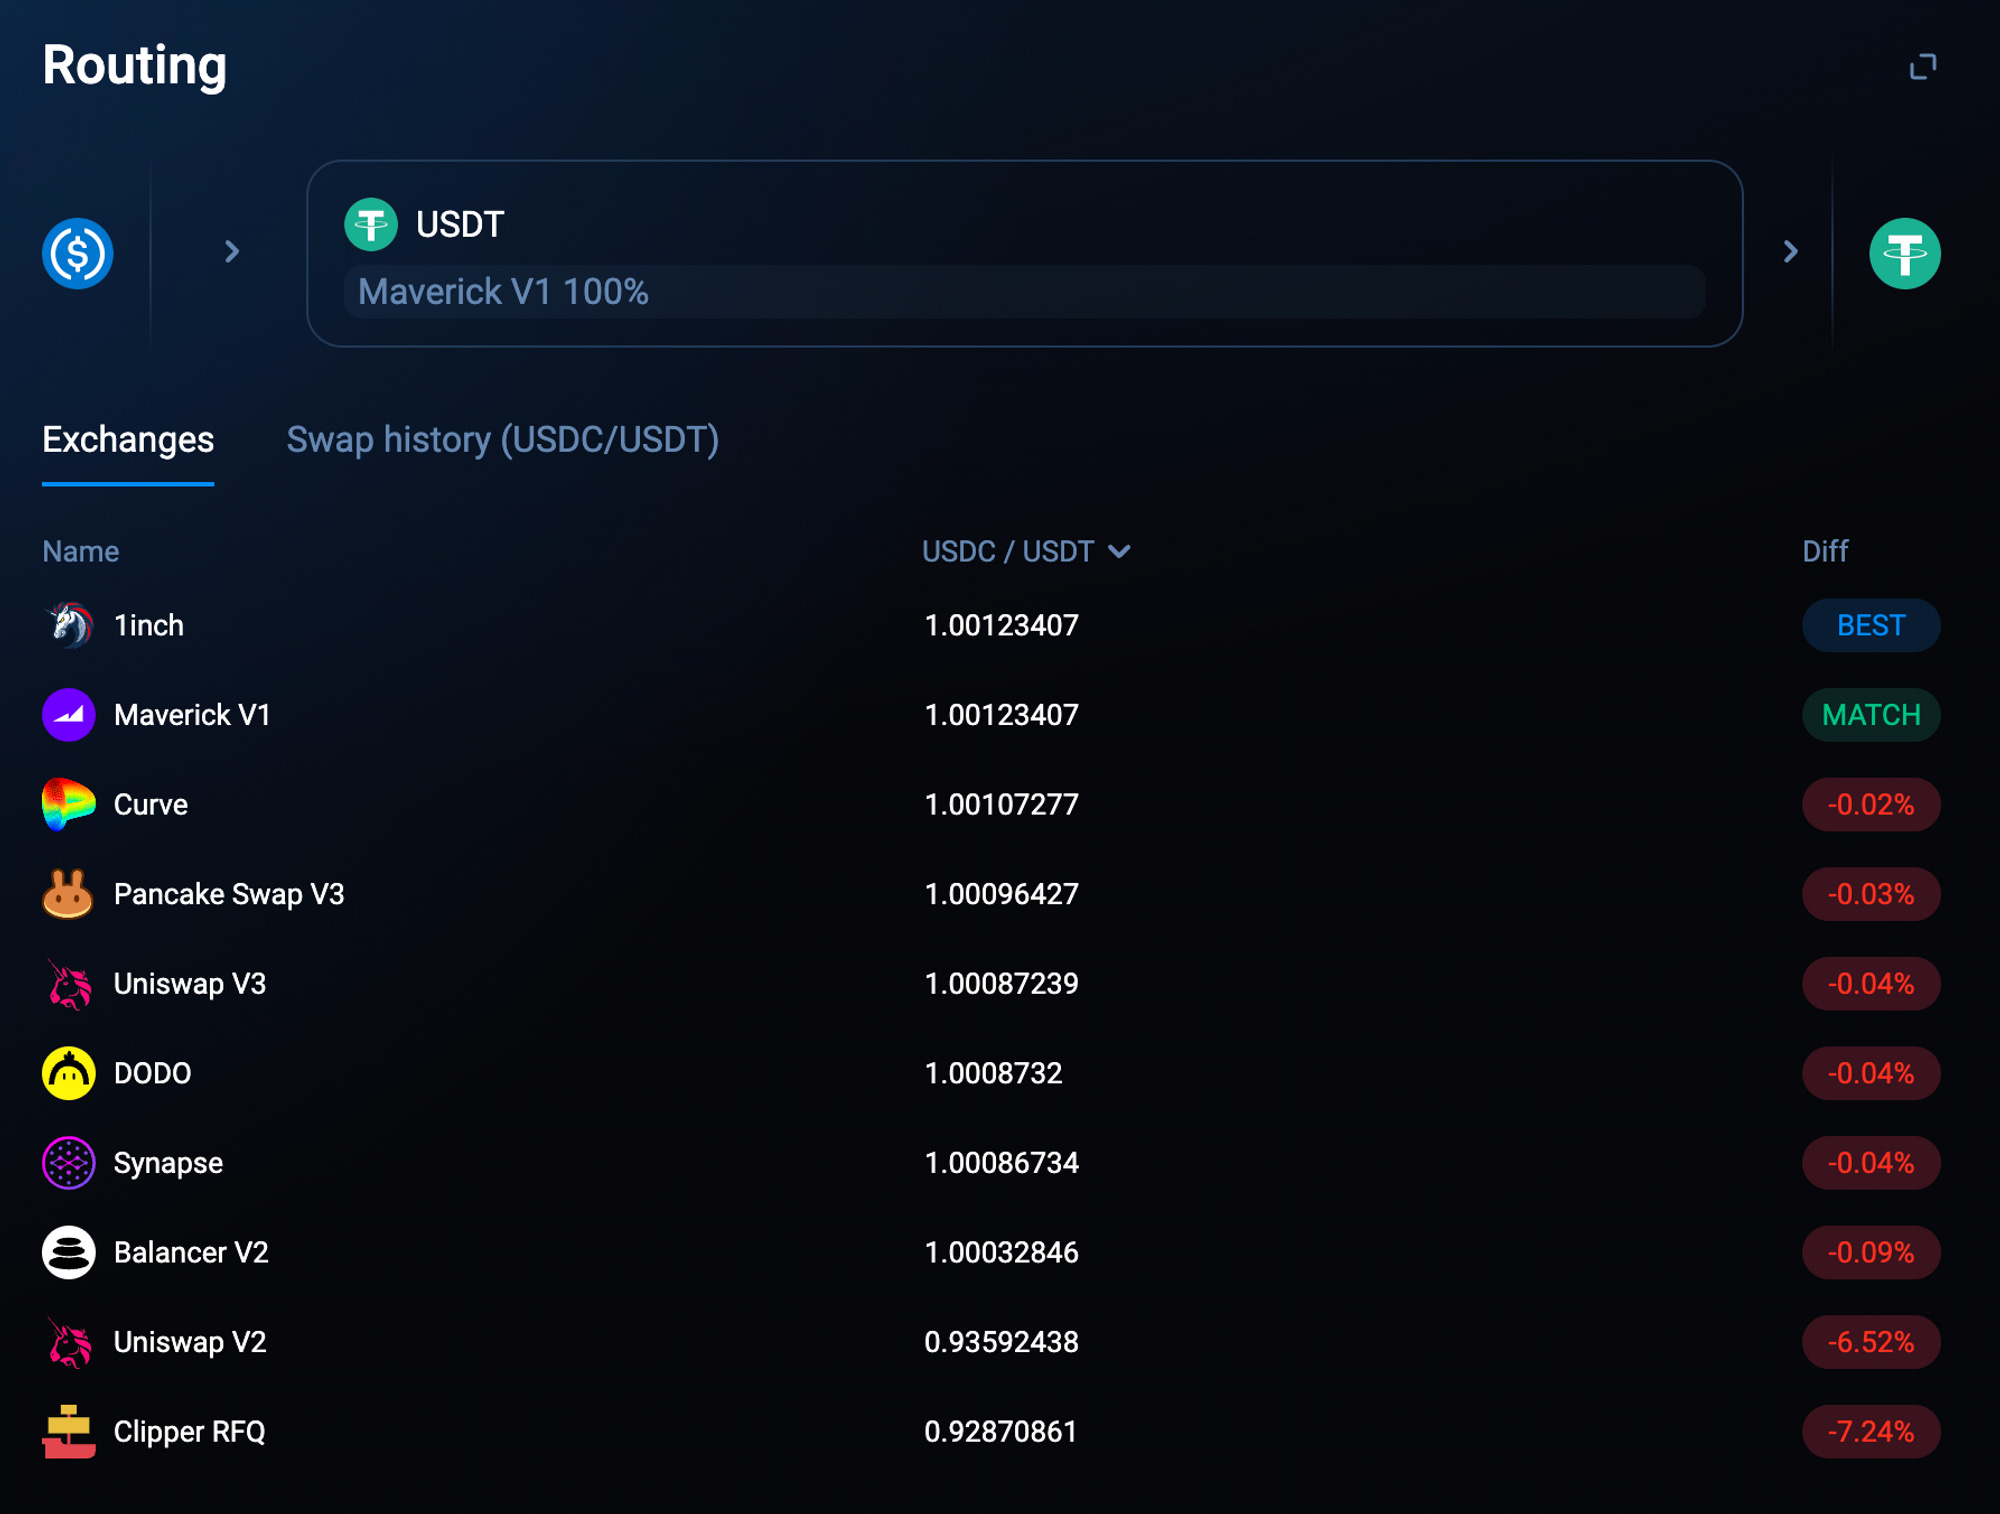
In the next section, we simulate and analyze depth and pricing advantages across different DEXs under varying trade sizes.
At the time of writing, Maverick offers clearer pricing advantages over other DEXs for trades up to $1M USD.
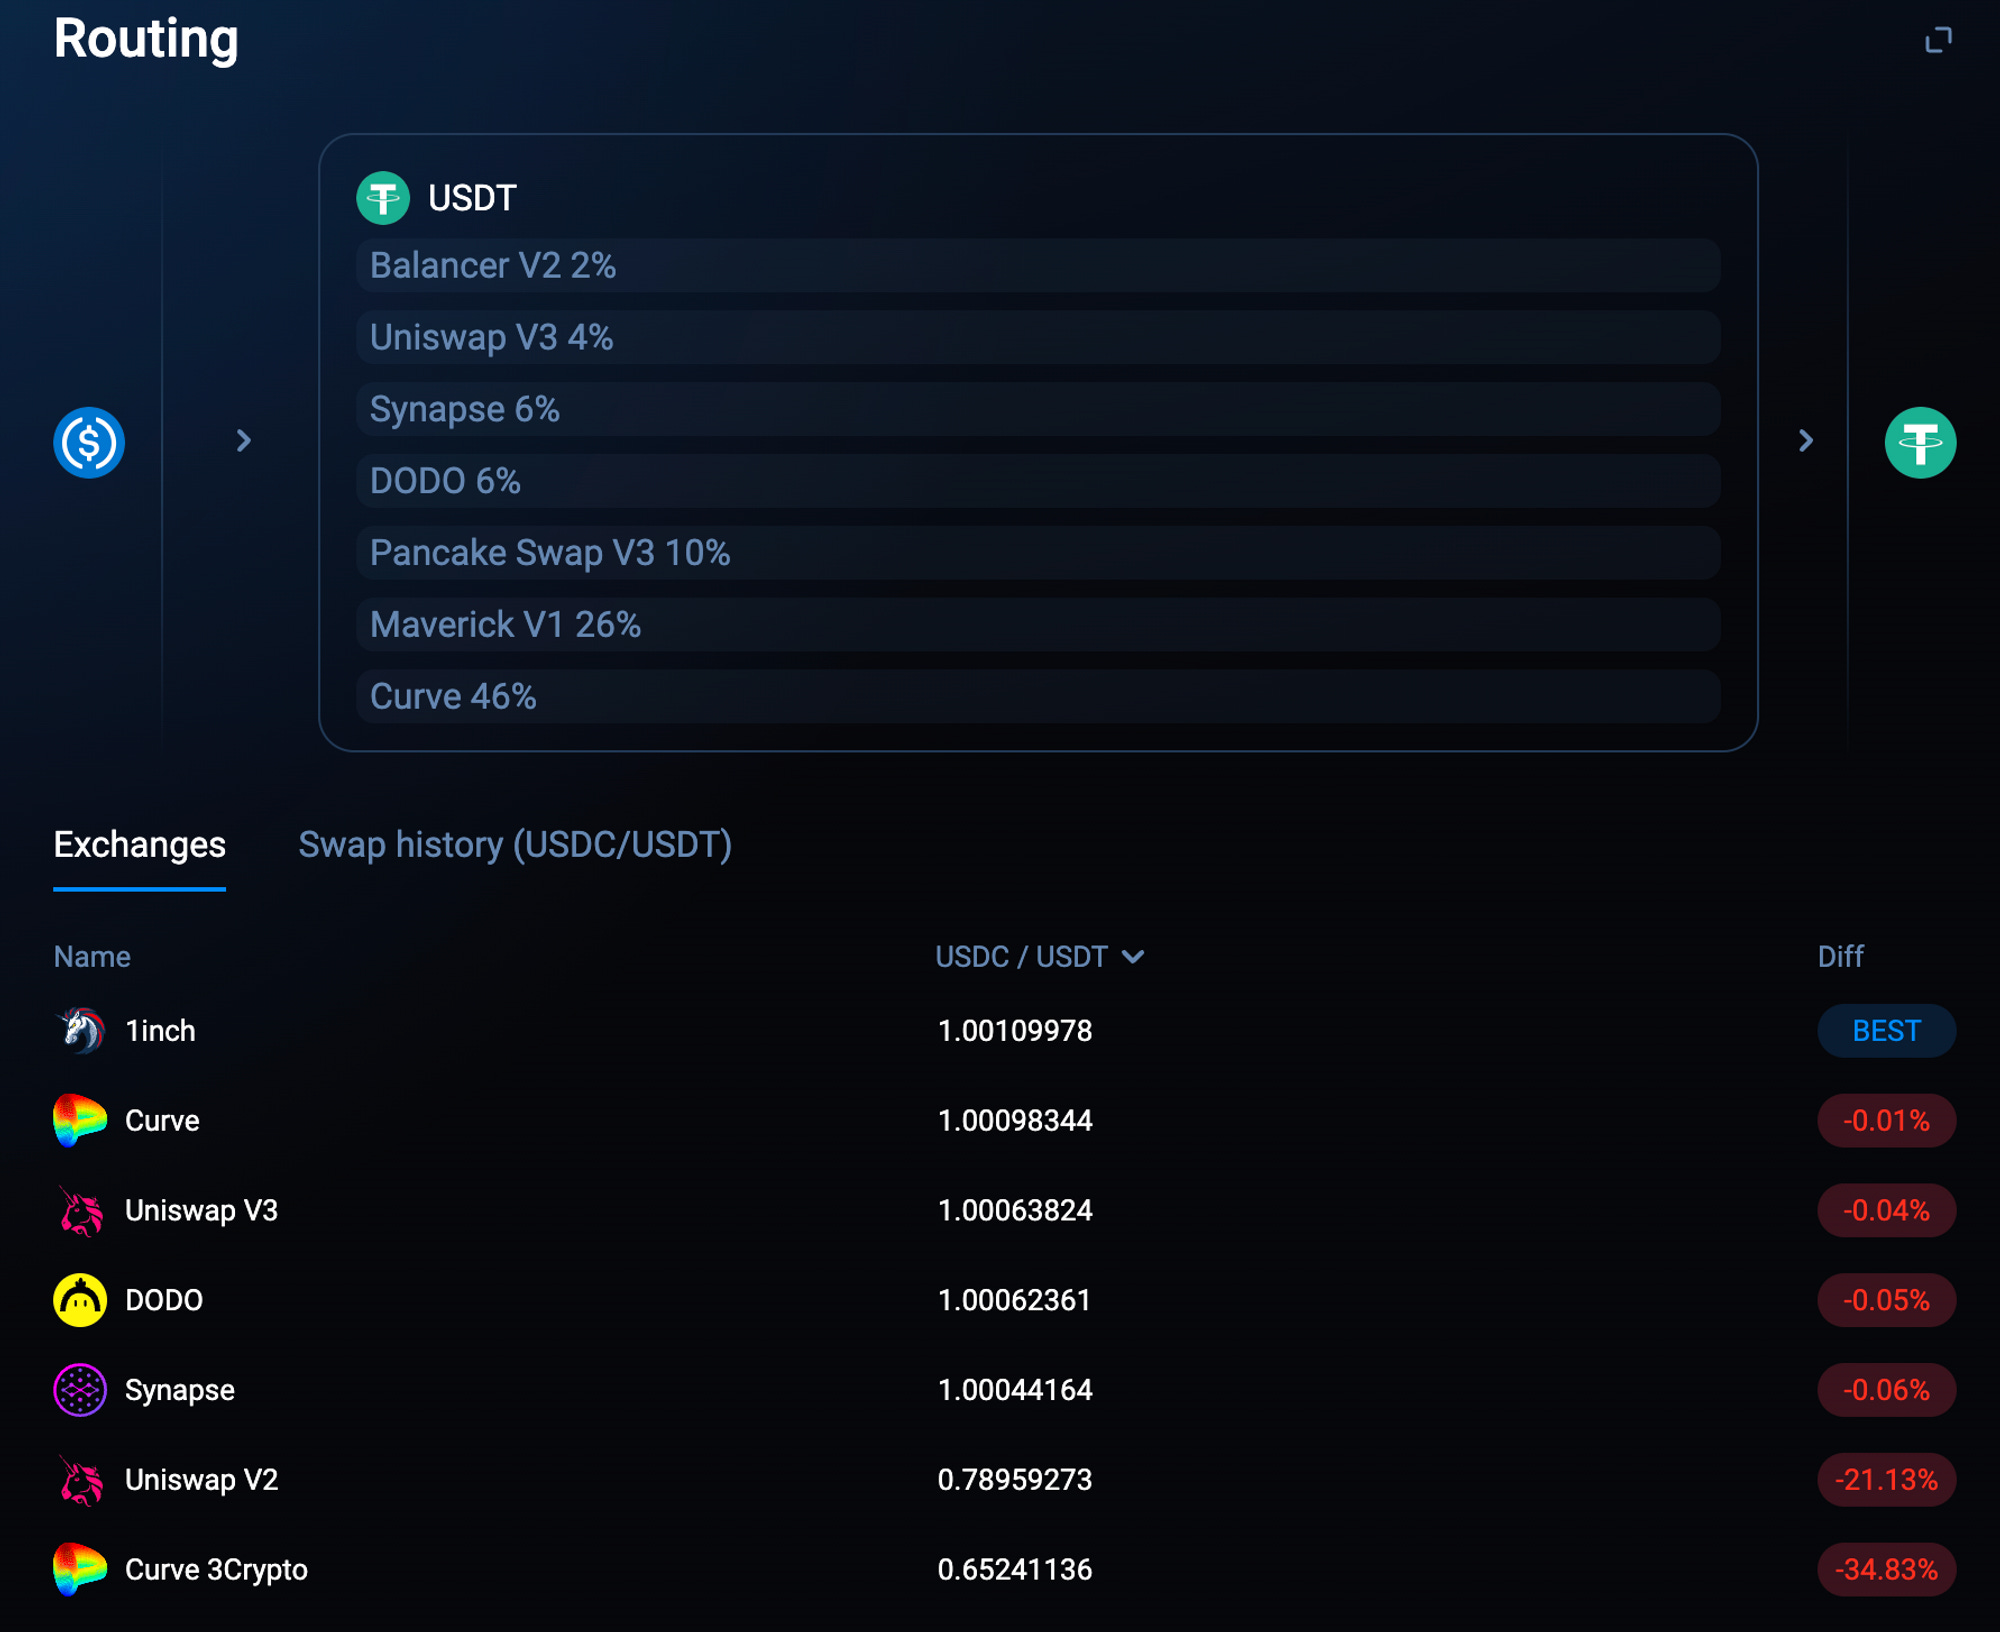
When single trade amounts increase to $4M USD, we observe that Curve and Maverick together account for over 70% of trading volume. Clearly, Curve holds a distinct edge in handling large trades due to its high TVL. Currently, Maverick’s maximum capacity is around $1M USD, constrained by its $3M liquidity pool.
In conclusion, Uniswap and Curve maintain solid positions in stablecoin swaps, primarily due to their ability to handle large orders and resist imbalance from skewed pool ratios. Maverick delivers comparable depth to Uniswap and Curve for small-to-medium stablecoin trades through high capital efficiency. However, due to its low TVL ($3M supporting $59M daily volume), its pools are prone to extreme imbalances. In directional markets, it relies on counter-trade flows to rebalance pools and sustain volume capture.
Overall, Uniswap and Curve remain firmly positioned in the stablecoin swap market. Their primary strengths lie in handling large trades and managing pool imbalances, both enabled by high TVL. Despite Maverick’s small TVL (a $3M stablecoin pool supporting $66M in 24h volume), it achieves depth comparable to Uniswap and Curve in small-to-medium trades via superior capital efficiency. Nevertheless, Maverick’s limited TVL makes its pools highly susceptible to extreme shifts when processing large trades. In strongly directional markets, it depends on reverse trades to correct pool imbalances and continue attracting volume.
The presence of aggregators places all DEXs—large and small—on equal footing. Within aggregators, there is no distinction between good or bad, big or small DEXs; competition hinges purely on trading depth and fees. Many DEXs forego protocol revenue entirely, allocating all fees to LPs. This form of competition is driven both by DEX mechanism design and trader preferences. Over time, whichever DEX consistently offers better depth and pricing will win greater trade allocation from aggregators.
Due to aggregators, all DEXs compete on a level playing field. Within aggregator routing, competition revolves solely around trading depth and fees—not brand reputation. Many DEXs abandon protocol fees altogether, passing all revenues to liquidity providers. This mechanism- and cost-driven competition implies that, over time, DEXs offering consistently superior depth and pricing will capture more trade flow from aggregators.
Uniswap X
Today, the aggregator space welcomes a heavyweight contender: UniswapX. UniswapX is poised to further solidify Uniswap’s leadership in stablecoin swaps.
Anton Bukov, founder of 1inch, noted in an interview that Uniswap has long had many “unfair” trades—indicating many users trade directly via Uniswap’s frontend instead of using aggregators to seek optimal pricing.
Recognizing this unique advantage, Uniswap introduced a powerful strategic combination: integrating Uniswap X with Uniswap V4. UniswapX, a product combining aggregation, cross-chain functionality, and RFQ (Request for Quote), brings several key benefits:
-
Aggregation attracts more frontend traffic, improves user experience, and prepares infrastructure for V4 Hooks.
-
Cross-chain swaps help consolidate Uniswap’s fragmented multi-chain liquidity, especially crucial amid L2 proliferation and liquidity contraction.
-
UniswapX’s permissionless nature prevents malicious behavior by relayers.
-
RFQ helps bridge the liquidity gap between CEXs and DEXs, bringing some centralized exchange liquidity onto decentralized platforms.
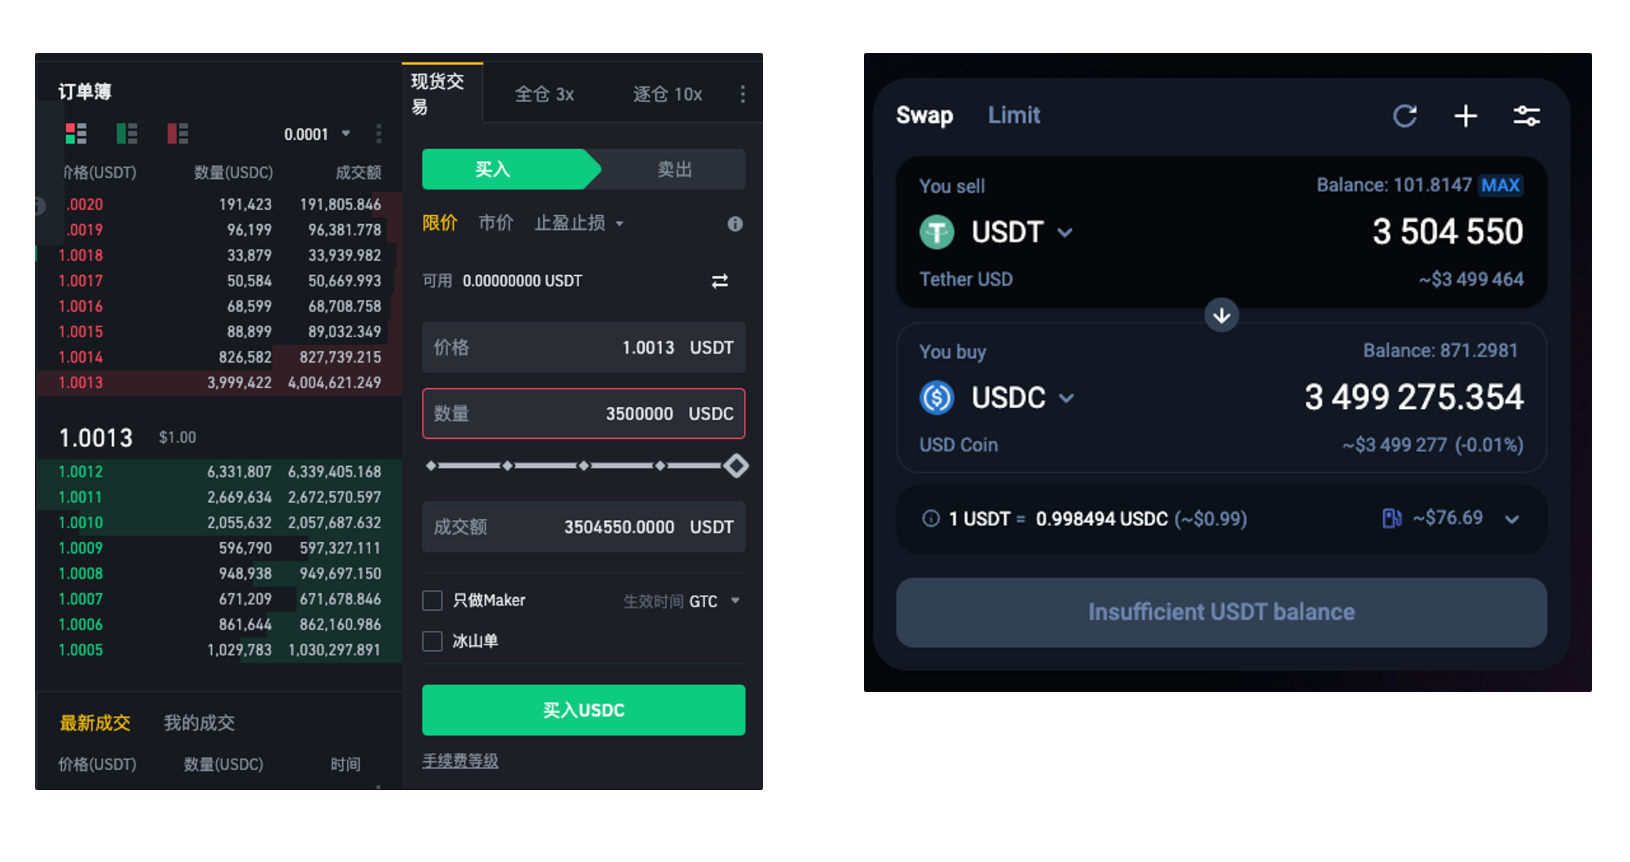
For stablecoin trading, even when using 1inch, there remains a significant depth gap between DEXs and Binance. UniswapX aims to narrow this gap. As UniswapX rolls out widely, Uniswap’s market share in stablecoin trading is expected to grow further.
Future Potential Growth: LSTs and Yield-Bearing Stablecoins
After the Shanghai upgrade, LSDs are attempting to become DeFi’s benchmark interest rate. With Maker’s EDSR rising to 5%, various stablecoins are now locked in a yield race.
For stablecoin projects seeking yield generation, two primary approaches exist:
-
Larger protocols with capital reserves typically pursue RWA strategies—exemplified by DAI and FRAX.
-
Newer protocols favor integration with LSDs, such as Lybra’s eUSD and Gravita’s GRAI.
These approaches aren’t mutually exclusive but differ significantly in implementation difficulty. The following analysis focuses on how project teams and LPs might choose: amid rapid growth in yield-bearing assets, how will future DEXs allocate this incremental opportunity?
From the perspective of stablecoin or LST project teams: prioritize Uniswap/Maverick first, then consider Curve.
Similar to earlier cases with FRAX and UST, if new stablecoins or LSTs focus on building credibility, they’ll have incentives to launch liquidity pools on Curve. Conversely, if they prioritize smooth trading and higher capital efficiency, they’ll lean toward Uniswap or Maverick.
Thus, we can infer that in the early stages of stablecoin or LST competition—when all players are relatively small—they’ll initially favor Uniswap V3 and Maverick to meet user trading demands and compete under smooth execution. As competition progresses and leaders emerge, projects may then opt to pay extra costs to establish stronger credibility on Curve.
From the LP perspective for stablecoins/LSTs: prefer Maverick first, then Uniswap/Curve.
Clearly, users holding stETH are more rate-sensitive than ETH holders. Using stETH data, we can sketch a simple profile of yield-bearing asset users.
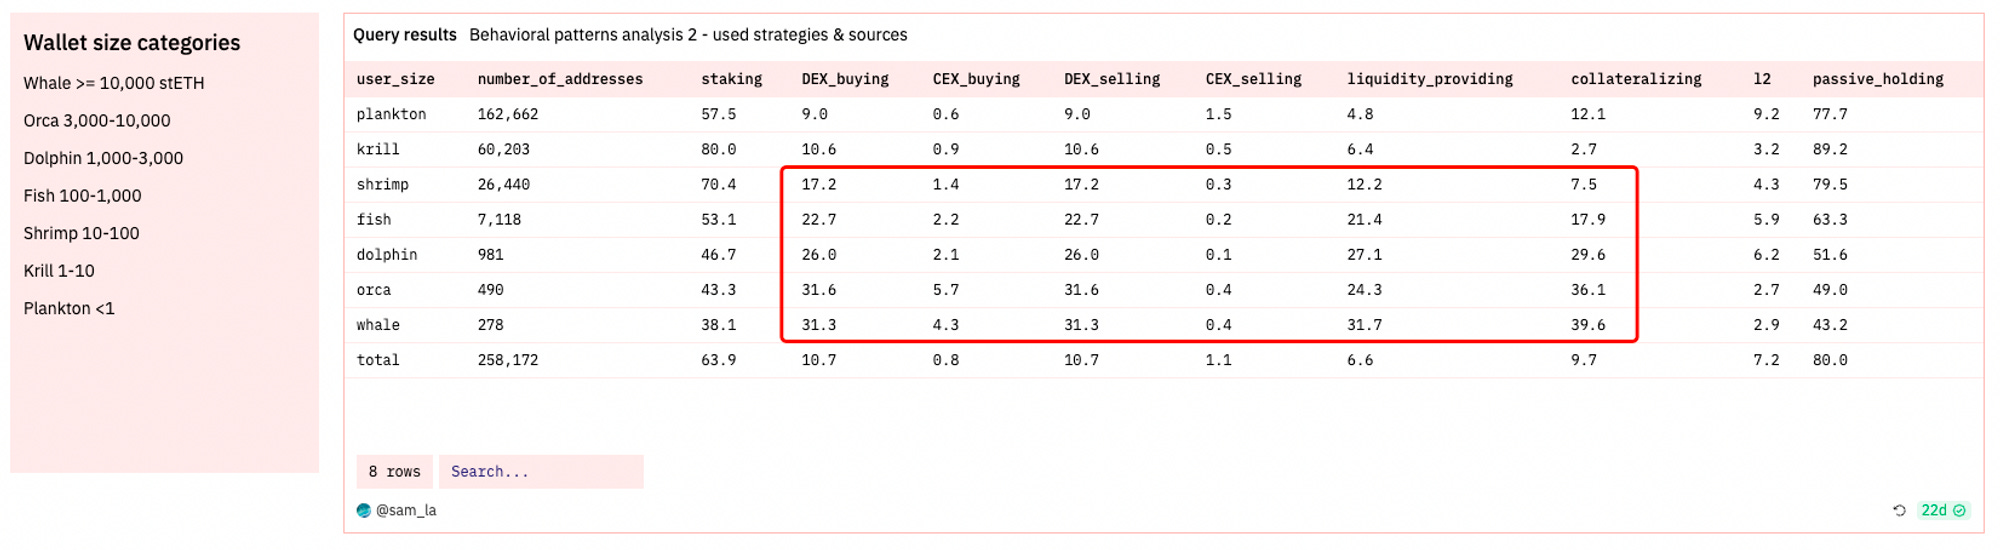
As shown above, users with larger stETH holdings are more inclined to frequently trade stETH and engage with stETH-related derivative protocols. In contrast, users holding less than 10 stETH appear less sensitive to additional yields.Ba
sed on this finding, we can predict the DEX market structure for yield-bearing stablecoins: the market is primarily dominated by large, yield-sensitive holders. In other words, unlike traditional or algorithmic stablecoins, yield-bearing stablecoins are primarily driven by LP returns.
In the yield-bearing stablecoin segment, since no sufficiently large yield-bearing stablecoin currently exists as a benchmark, we compare the 24h APY of USDC-USDT pairs on Uniswap, Curve, and Maverick as of August 15 (using Curve’s 3pool).

We observe that Uniswap and Curve have similar current APYs, both significantly lower than Maverick’s. Fundamentally, a Maverick LP position resembles an automatically price-adjusting Uni V3 LP, with each bin interval set at 0.02%—about one-tenth of Uniswap V3’s. Thanks to Maverick’s automated LP management, smaller-bin LPs achieve higher APYs than those in wider ranges.
Additionally, Maverick’s capital efficiency translates into a cost advantage. This is highly attractive to emerging yield-bearing stablecoin projects, as they require significantly less USDC to achieve equivalent liquidity depth compared to Uniswap or Curve.
Regarding LSTs, currently only stETH shows increasing adoption across DeFi protocols, while others remain stable.
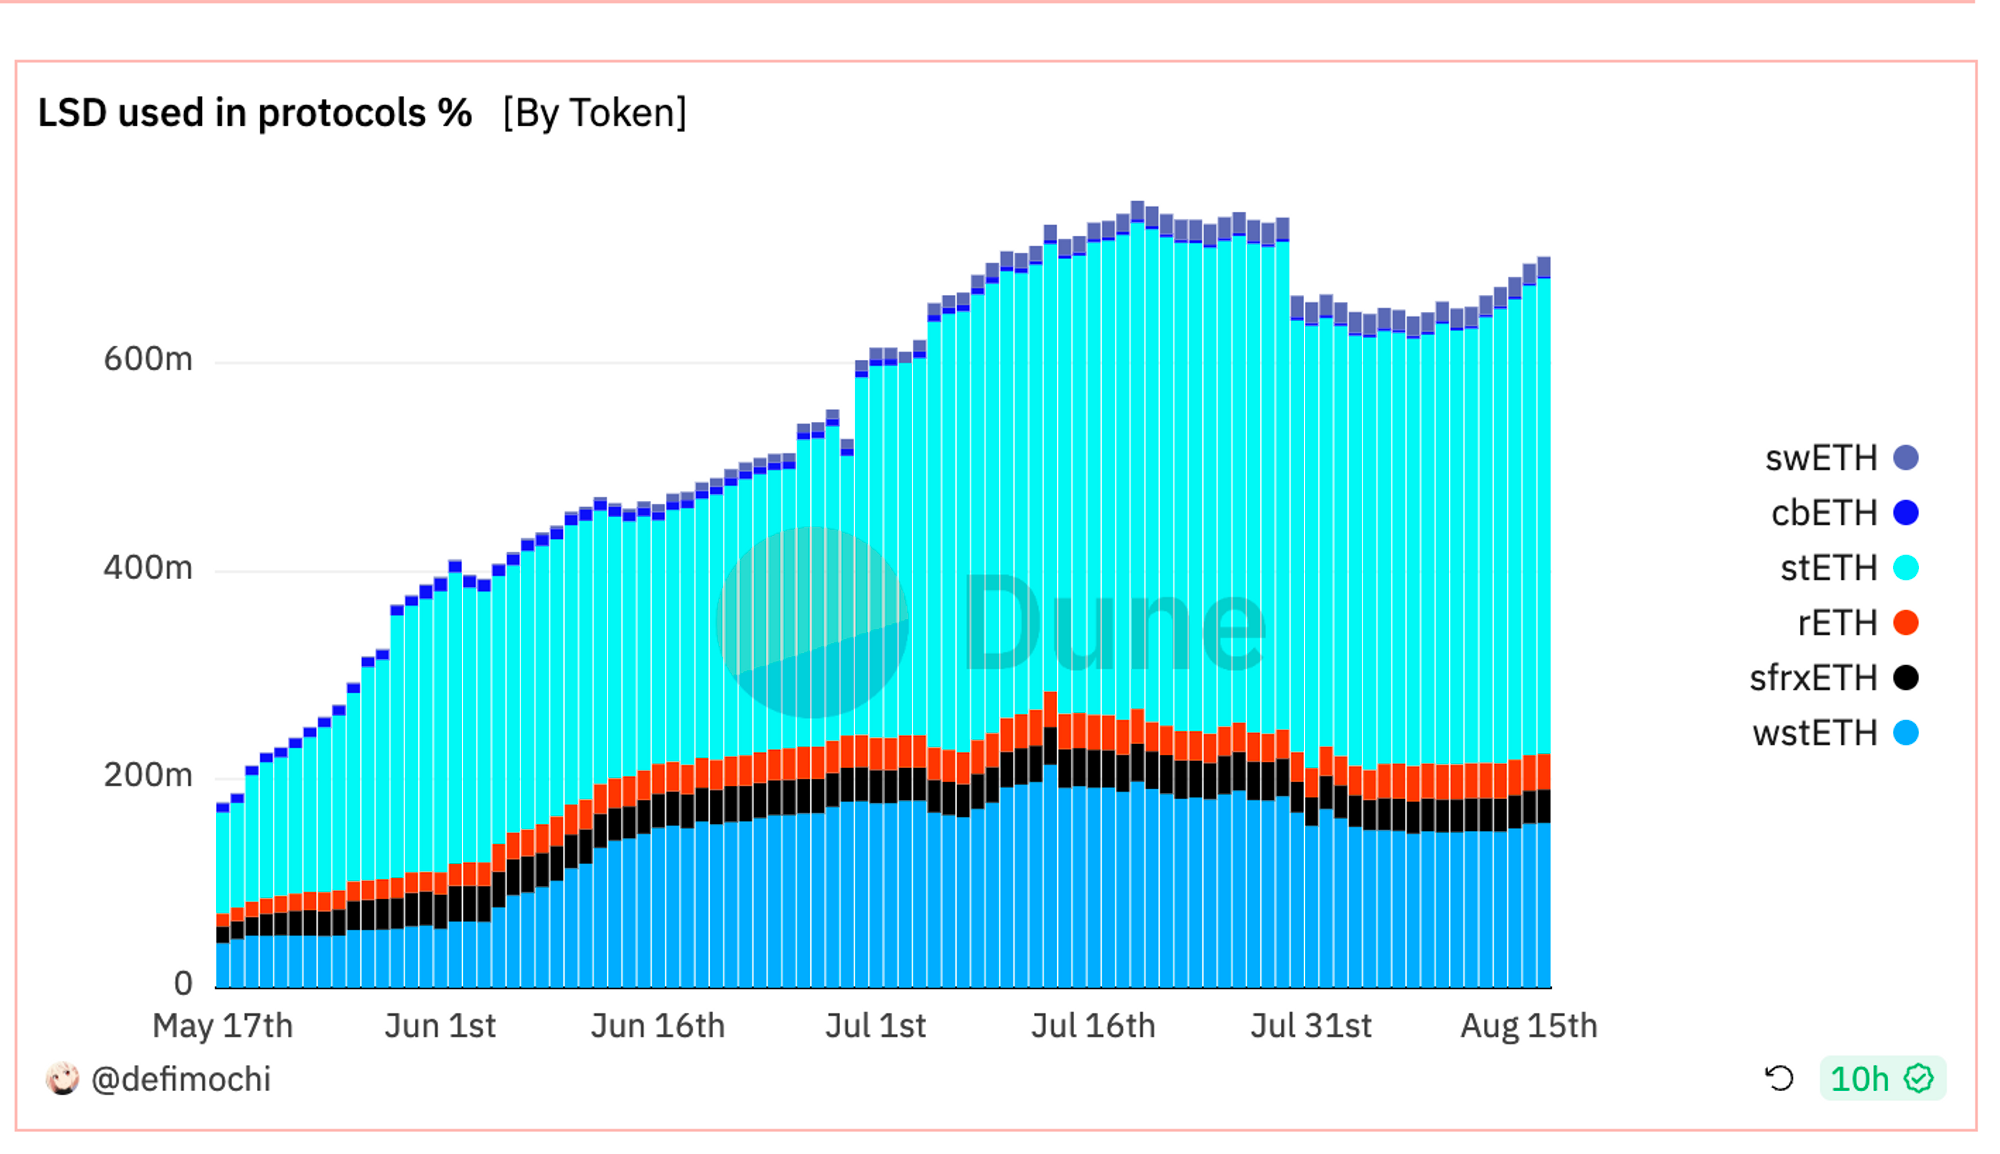
stETH is a rebase token, and due to its uniqueness, DEXs like Uniswap V3, Maverick, and Balancer do not support it. Therefore, stETH’s primary trading venue remains Curve’s specially designed liquidity pool—Curve’s biggest advantage in the LST space. However, after the Shanghai upgrade, short-term stETH-to-ETH conversion became possible via Lido, weakening Curve’s core competitive moat. Furthermore, due to halted Lido incentives and Curve’s inherently low capital efficiency, Curve’s stETH holdings have been steadily declining since April 2023, as shown below.
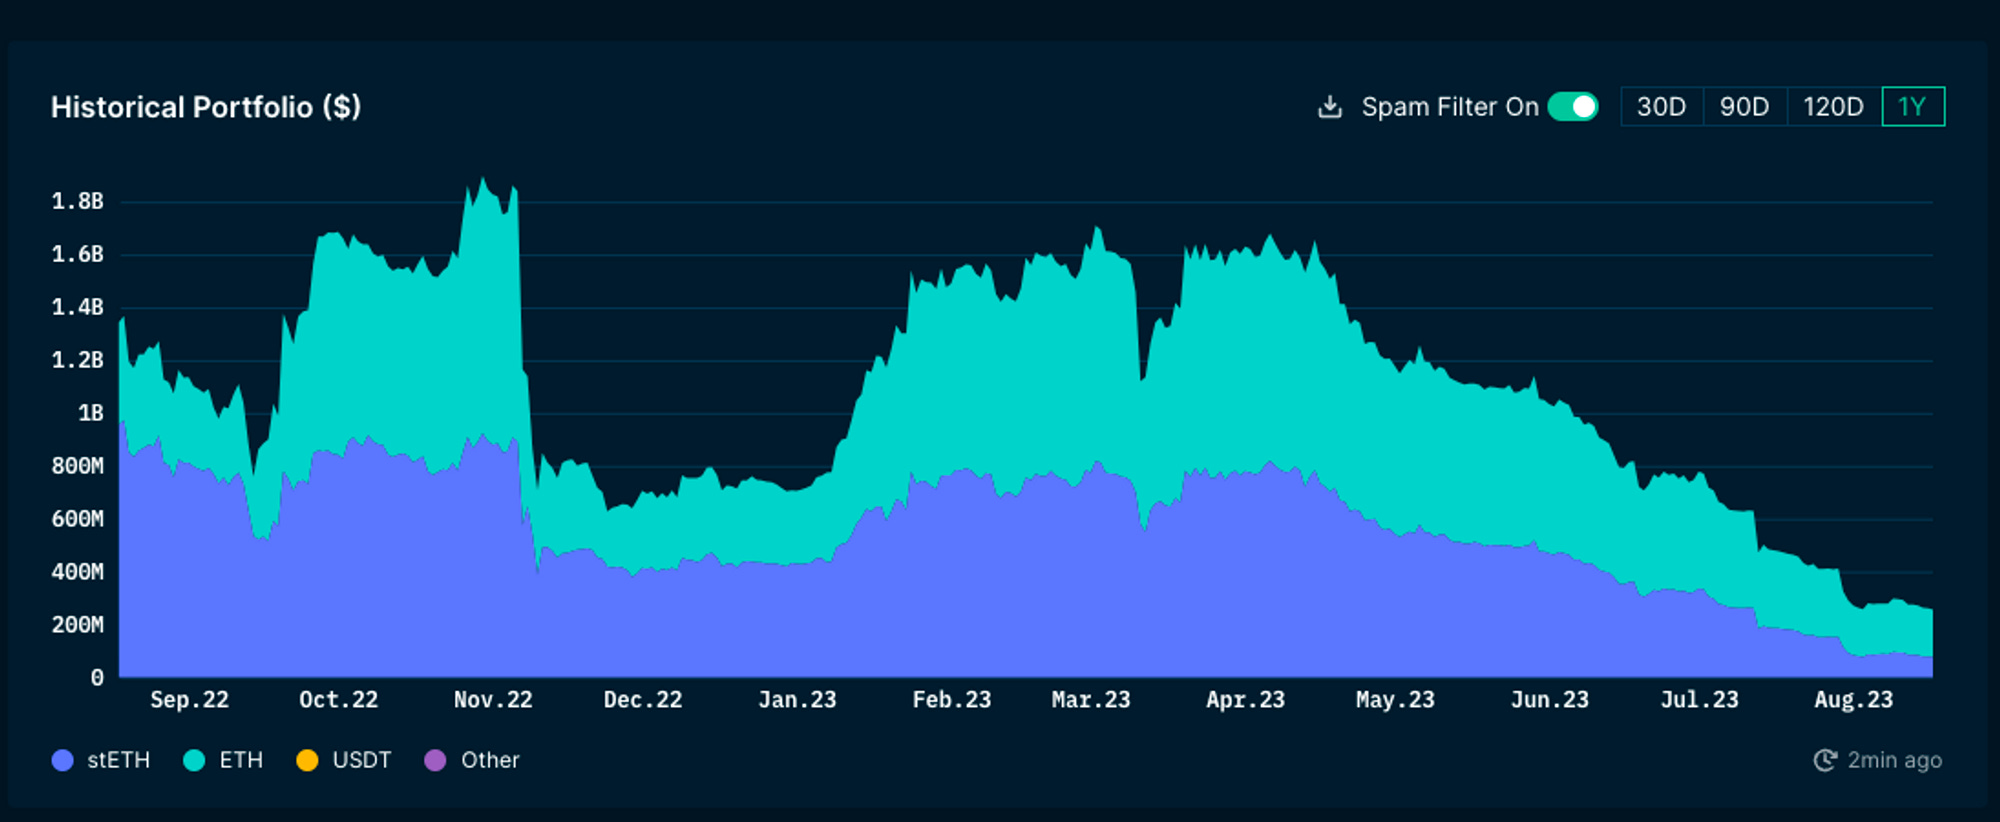
Other LSTs, such as wstETH and rETH, reflect staking rewards through rising exchange rates relative to ETH. In this category, Curve holds no distinct advantage. wstETH trading is concentrated on Maverick and Uniswap, where LPs set very narrow liquidity ranges to earn excess returns. While these LSTs exhibit some stablecoin-like traits, their prices aren’t fixed but rise at a relatively steady pace.
Therefore, for such LSTs, there’s a significant difference in management costs between Uniswap V3 LPs and Maverick LPs. As shown below, Uniswap V3’s wstETH range is only 0.03%. Given Lido’s 4.5% annual staking yield, users must adjust their range every three days. Each entry and exit incurs $30 in gas fees. To offset this, a user needs about $45K in principal; to generate extra profit, at least $150K is recommended. Such thresholds are unaffordable for most on-chain users. Maverick, through its auto-follow feature, checks price and bin relationships on every trade and adjusts bins accordingly, effectively saving users management effort and gas costs, while delivering annualized returns comparable to Uniswap—minimizing participation barriers.
Conclusion: How Do We Define a Good DEX?
DEXs are undoubtedly the cornerstone of the DeFi ecosystem. Without DEXs, no DeFi protocol could exist.
How do we define an excellent DEX? Different participants in the blockchain space emphasize different aspects, leading to varied answers.
-
Traders seek better trading depth (lower slippage) and reduced gas fees.
Join TechFlow official community to stay tuned
Telegram:https://t.me/TechFlowDaily
X (Twitter):https://x.com/TechFlowPost
X (Twitter) EN:https://x.com/BlockFlow_News
Add to FavoritesShare to Social MediaAuthorLongStory Research






