
Glassnode's Weekly On-Chain Report: Changes in Liquidity Funds May Reveal Market Sentiment and Expectations
TechFlow Selected TechFlow Selected
Glassnode's Weekly On-Chain Report: Changes in Liquidity Funds May Reveal Market Sentiment and Expectations
Liquidity funds are highly sensitive to market events, and insights can be gained from the volatility and price expectations of liquidity providers.
 Navigating Web3 tides with focused insights
Written by: Glassnode, Alice Kohn
Compiled by: TechFlow
The digital asset market is experiencing renewed volatility, with ETH and many tokens seeing exaggerated pullbacks. Derivatives markets show a continued migration of liquidity up the risk curve. In this article, we explore how deeper market insights can be extracted from liquidity pools.
Summary
-
Over recent weeks, event-driven volatility has re-entered the digital asset market, accompanied by clear signs of capital outflows.
-
Derivatives markets show ongoing liquidity withdrawal, particularly in the ETH futures market, indicating that capital continues to shift up the risk curve in search of relatively safer positions.
-
We examine the many similarities between Uniswap liquidity pools and options markets—liquidity providers’ behaviors effectively express views on volatility and price levels.
Reawakening of the Digital Asset Market
In recent weeks, the digital asset market has awakened from a historically low-volatility period, primarily driven by two key events:
-
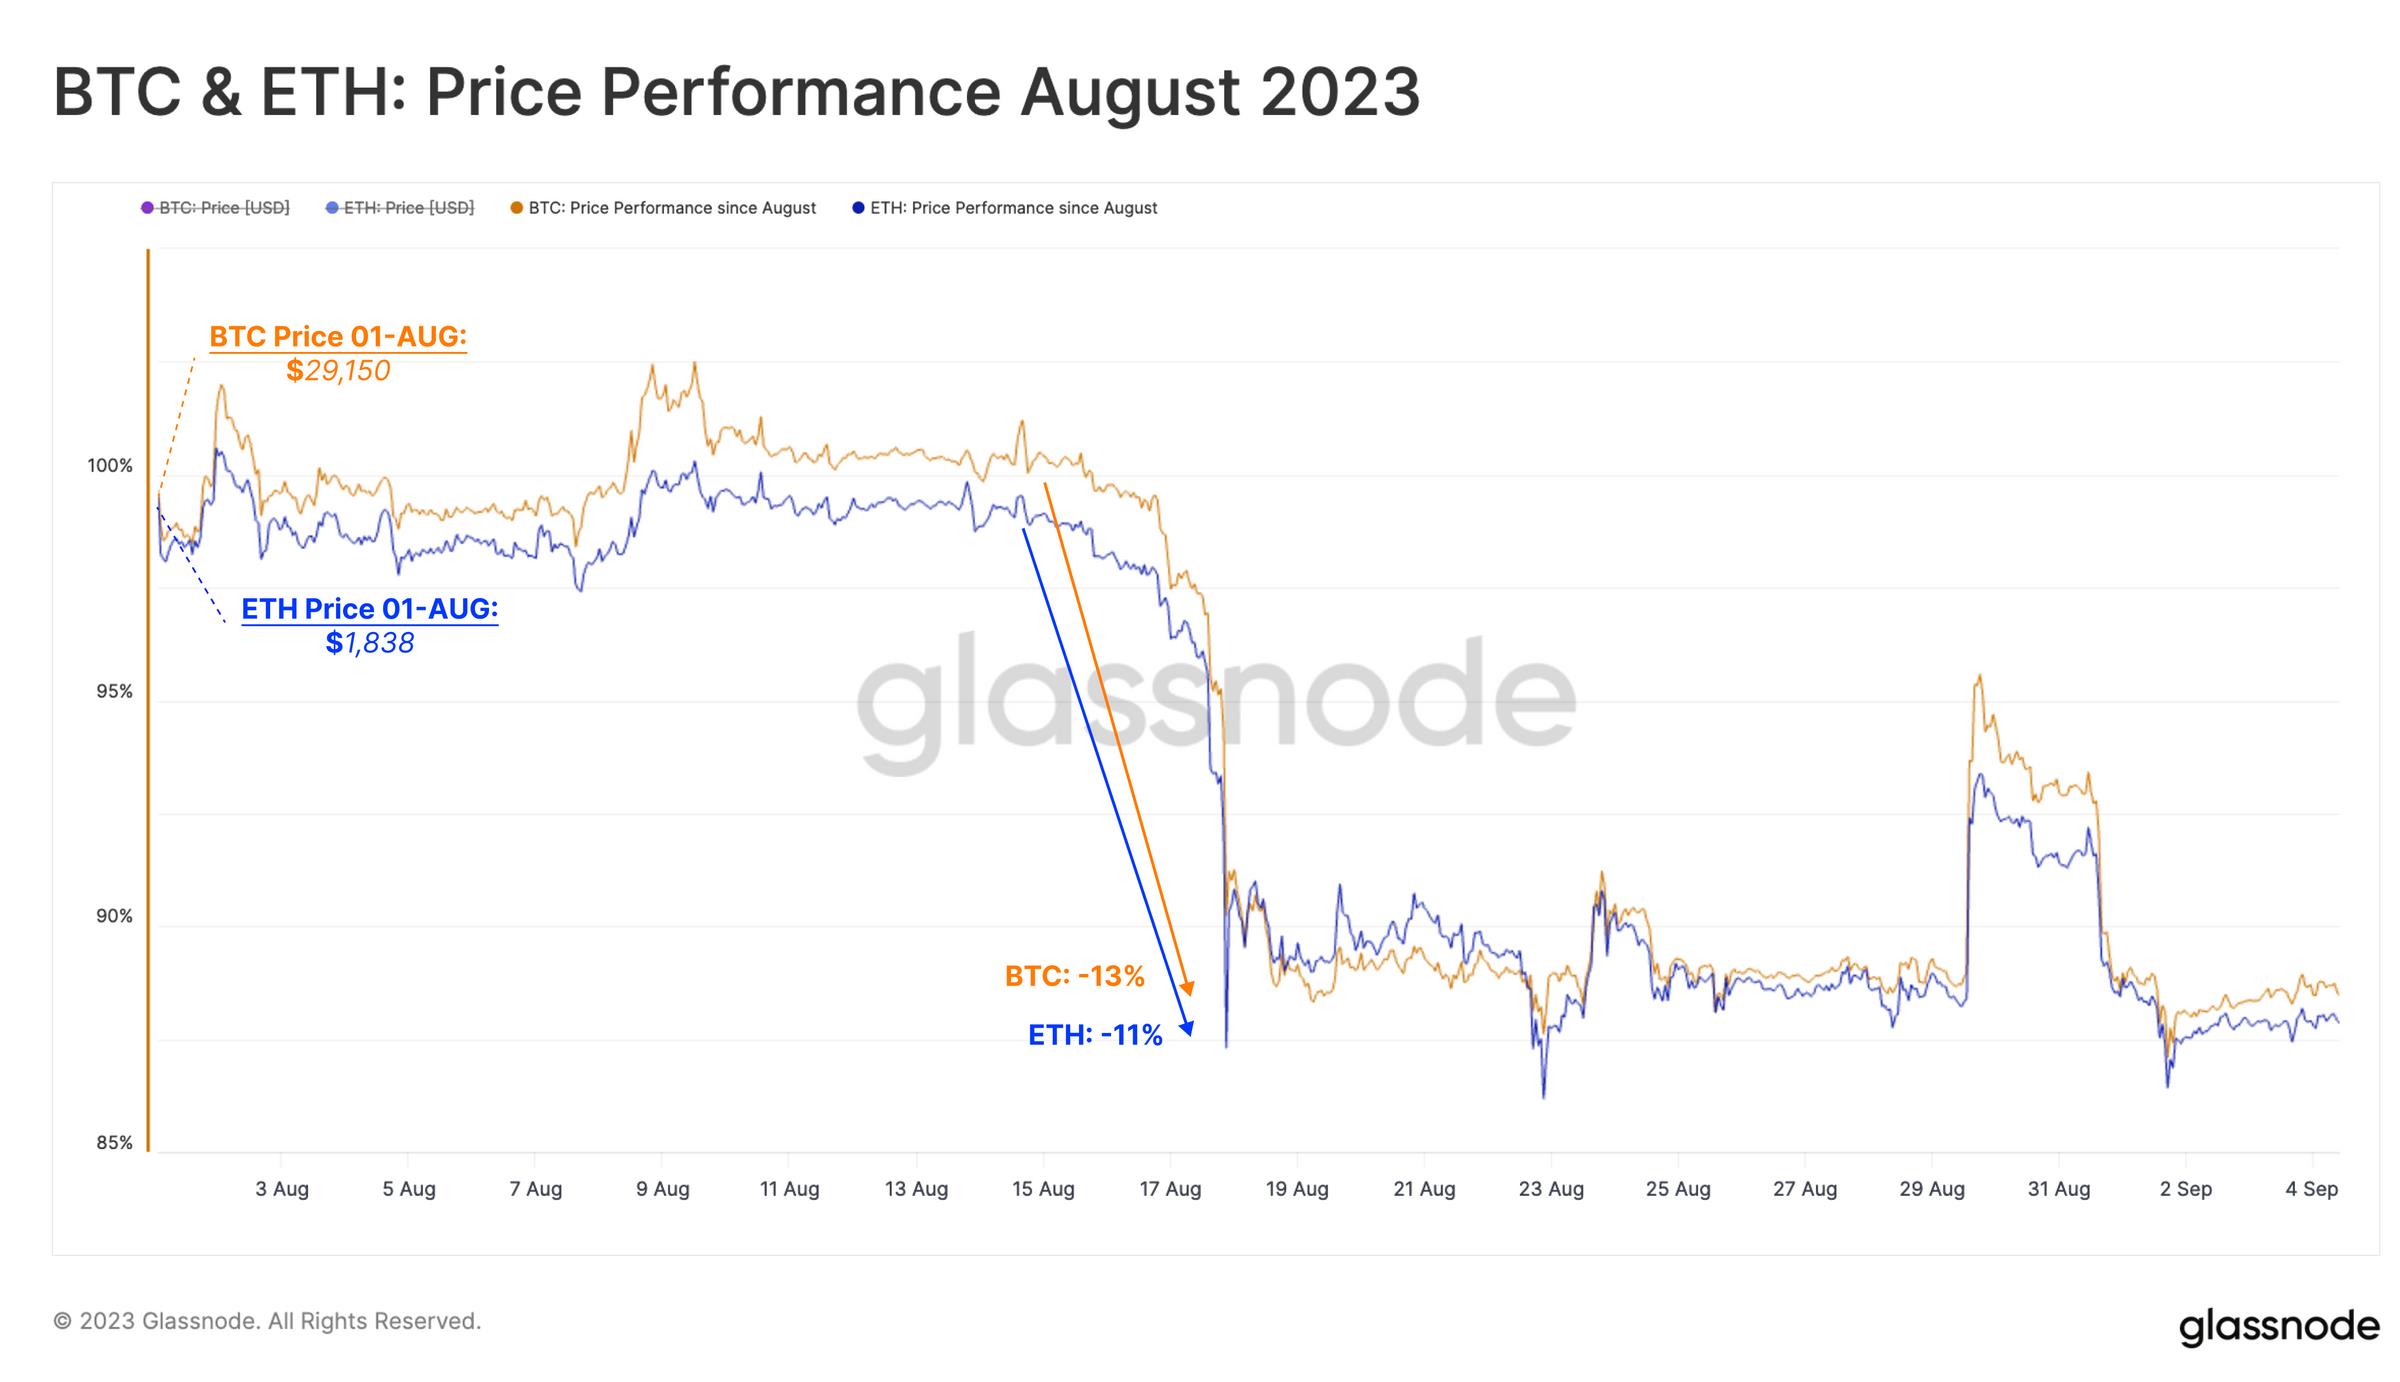
A flash crash on August 17, where BTC and ETH dropped 11% and 13%, respectively.
-
On August 29, news of Grayscale’s legal victory against the SEC caused a temporary price surge, but all gains were erased over the following three days.
Currently, both BTC and ETH spot prices are stagnating near their August lows.
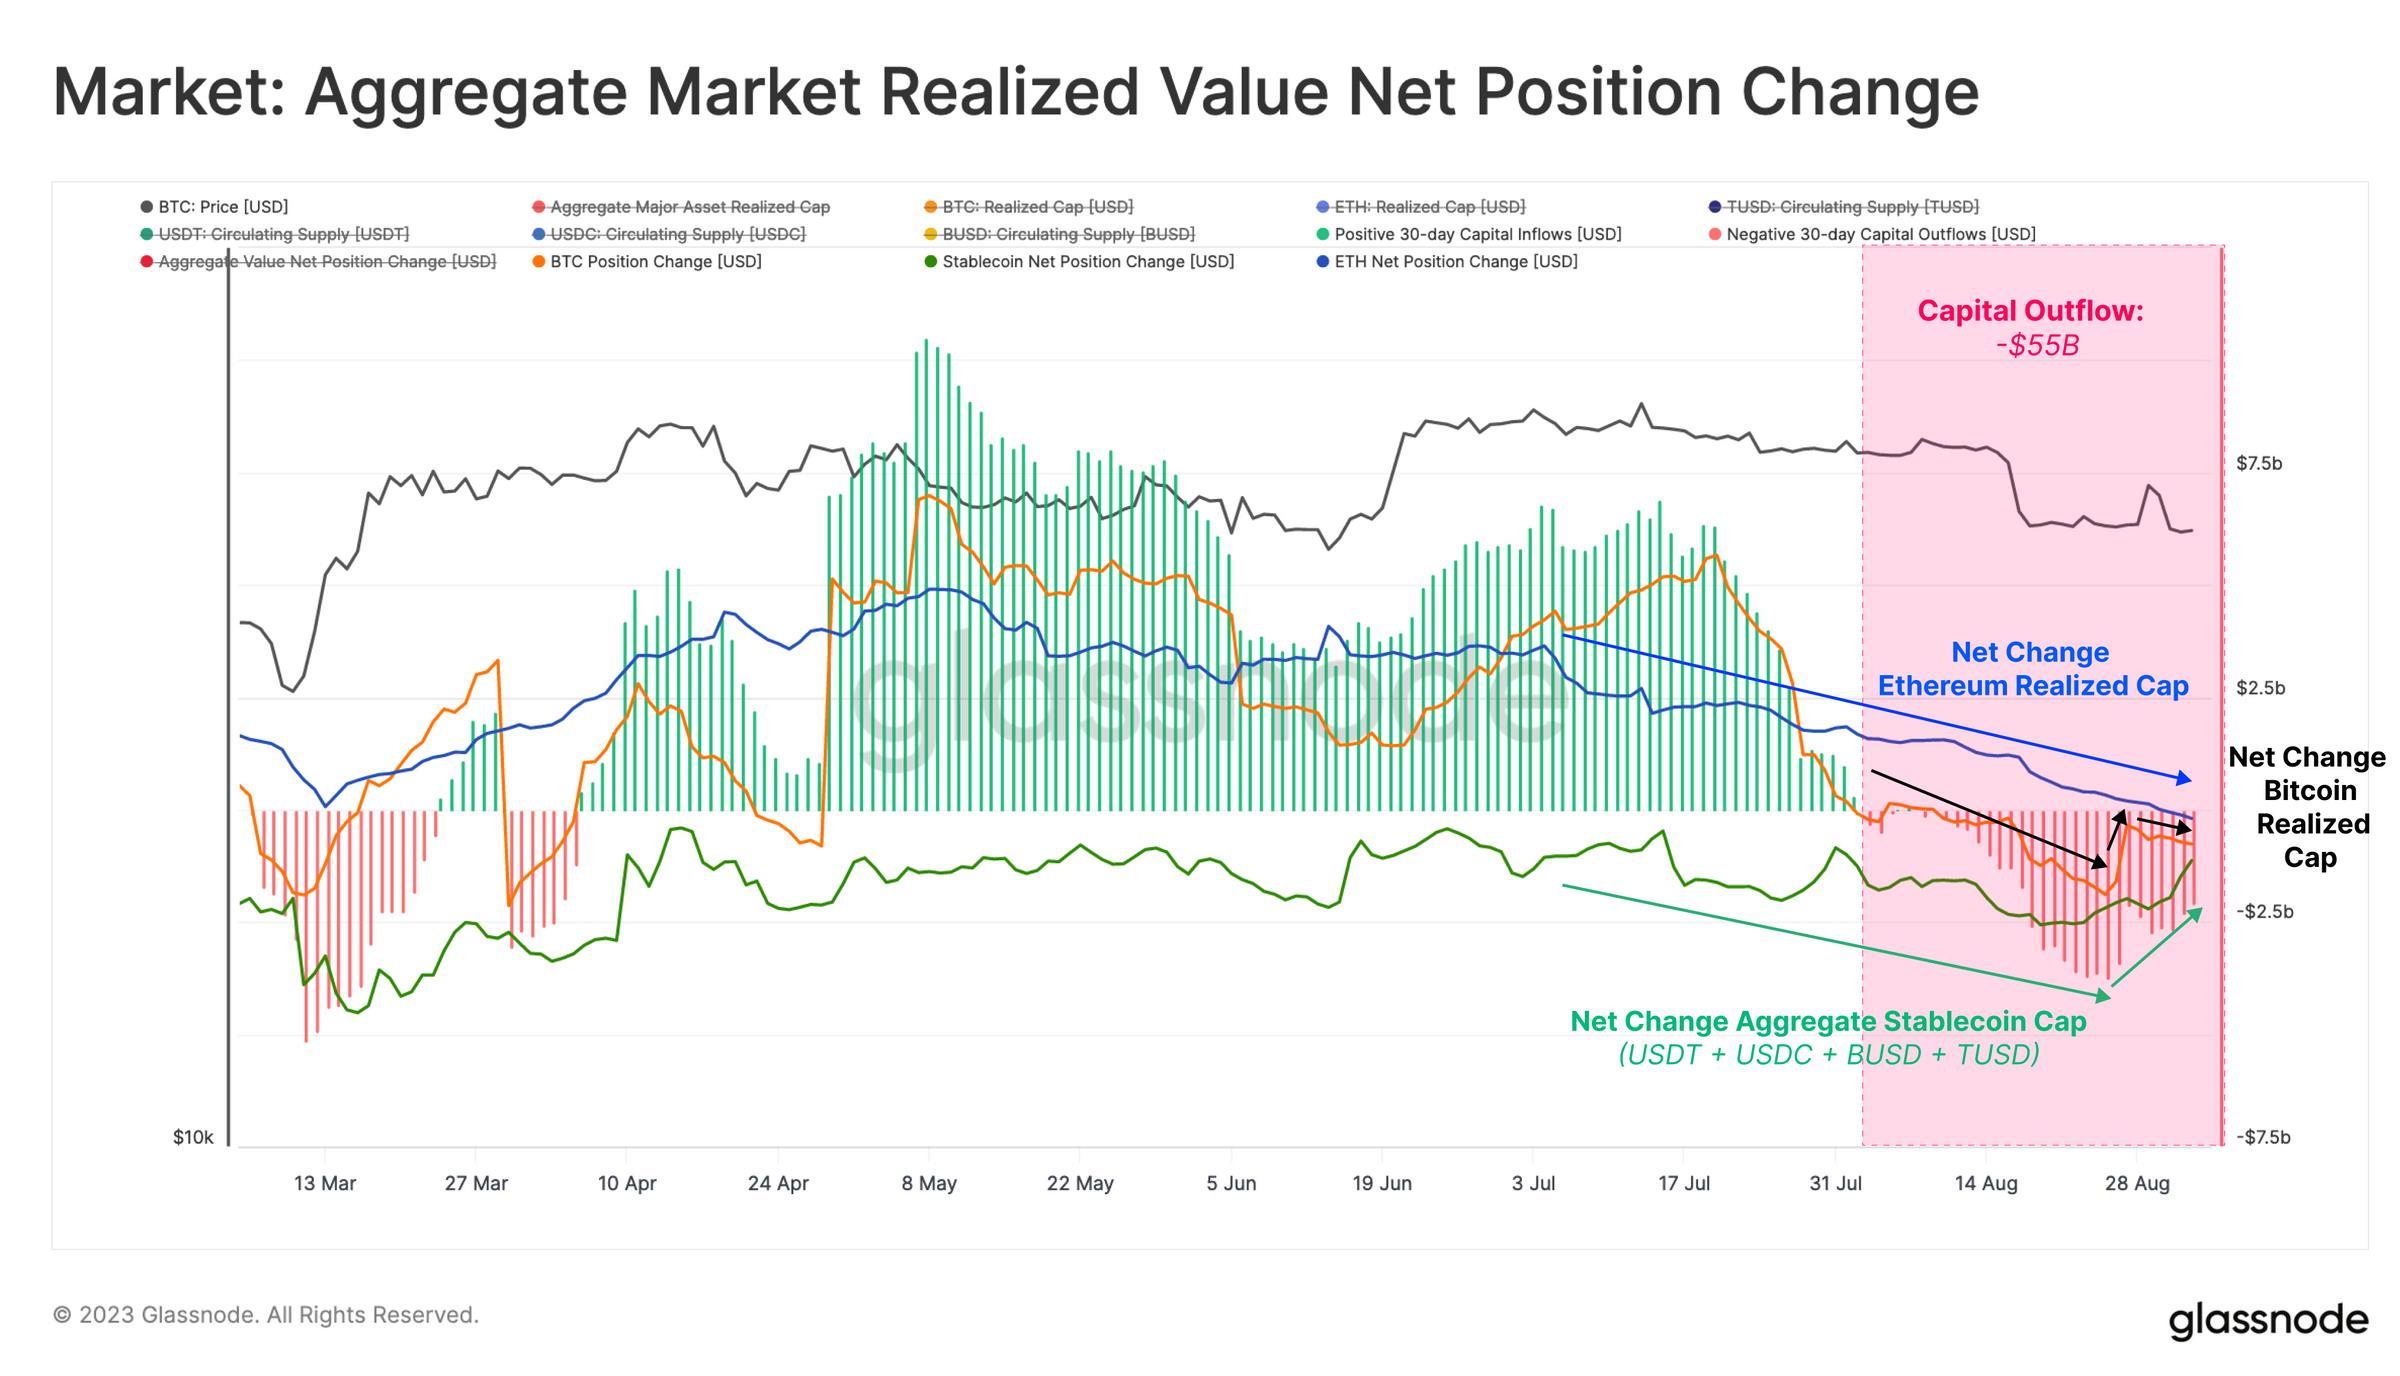
A key metric for tracking industry capital flows is the Total Realized Value indicator. This tool combines:
-
Market capitalizations of the two major digital assets, BTC and ETH
-
Supply volumes of five major stablecoins: USDT, USDC, BUSD, DAI, and TUSD
This metric clearly shows that the market entered a phase of capital outflow in early August—well before these two major events. Throughout August, approximately $55 billion exited the digital asset space.
This trend was driven by capital outflows across Bitcoin, Ethereum, and stablecoins.
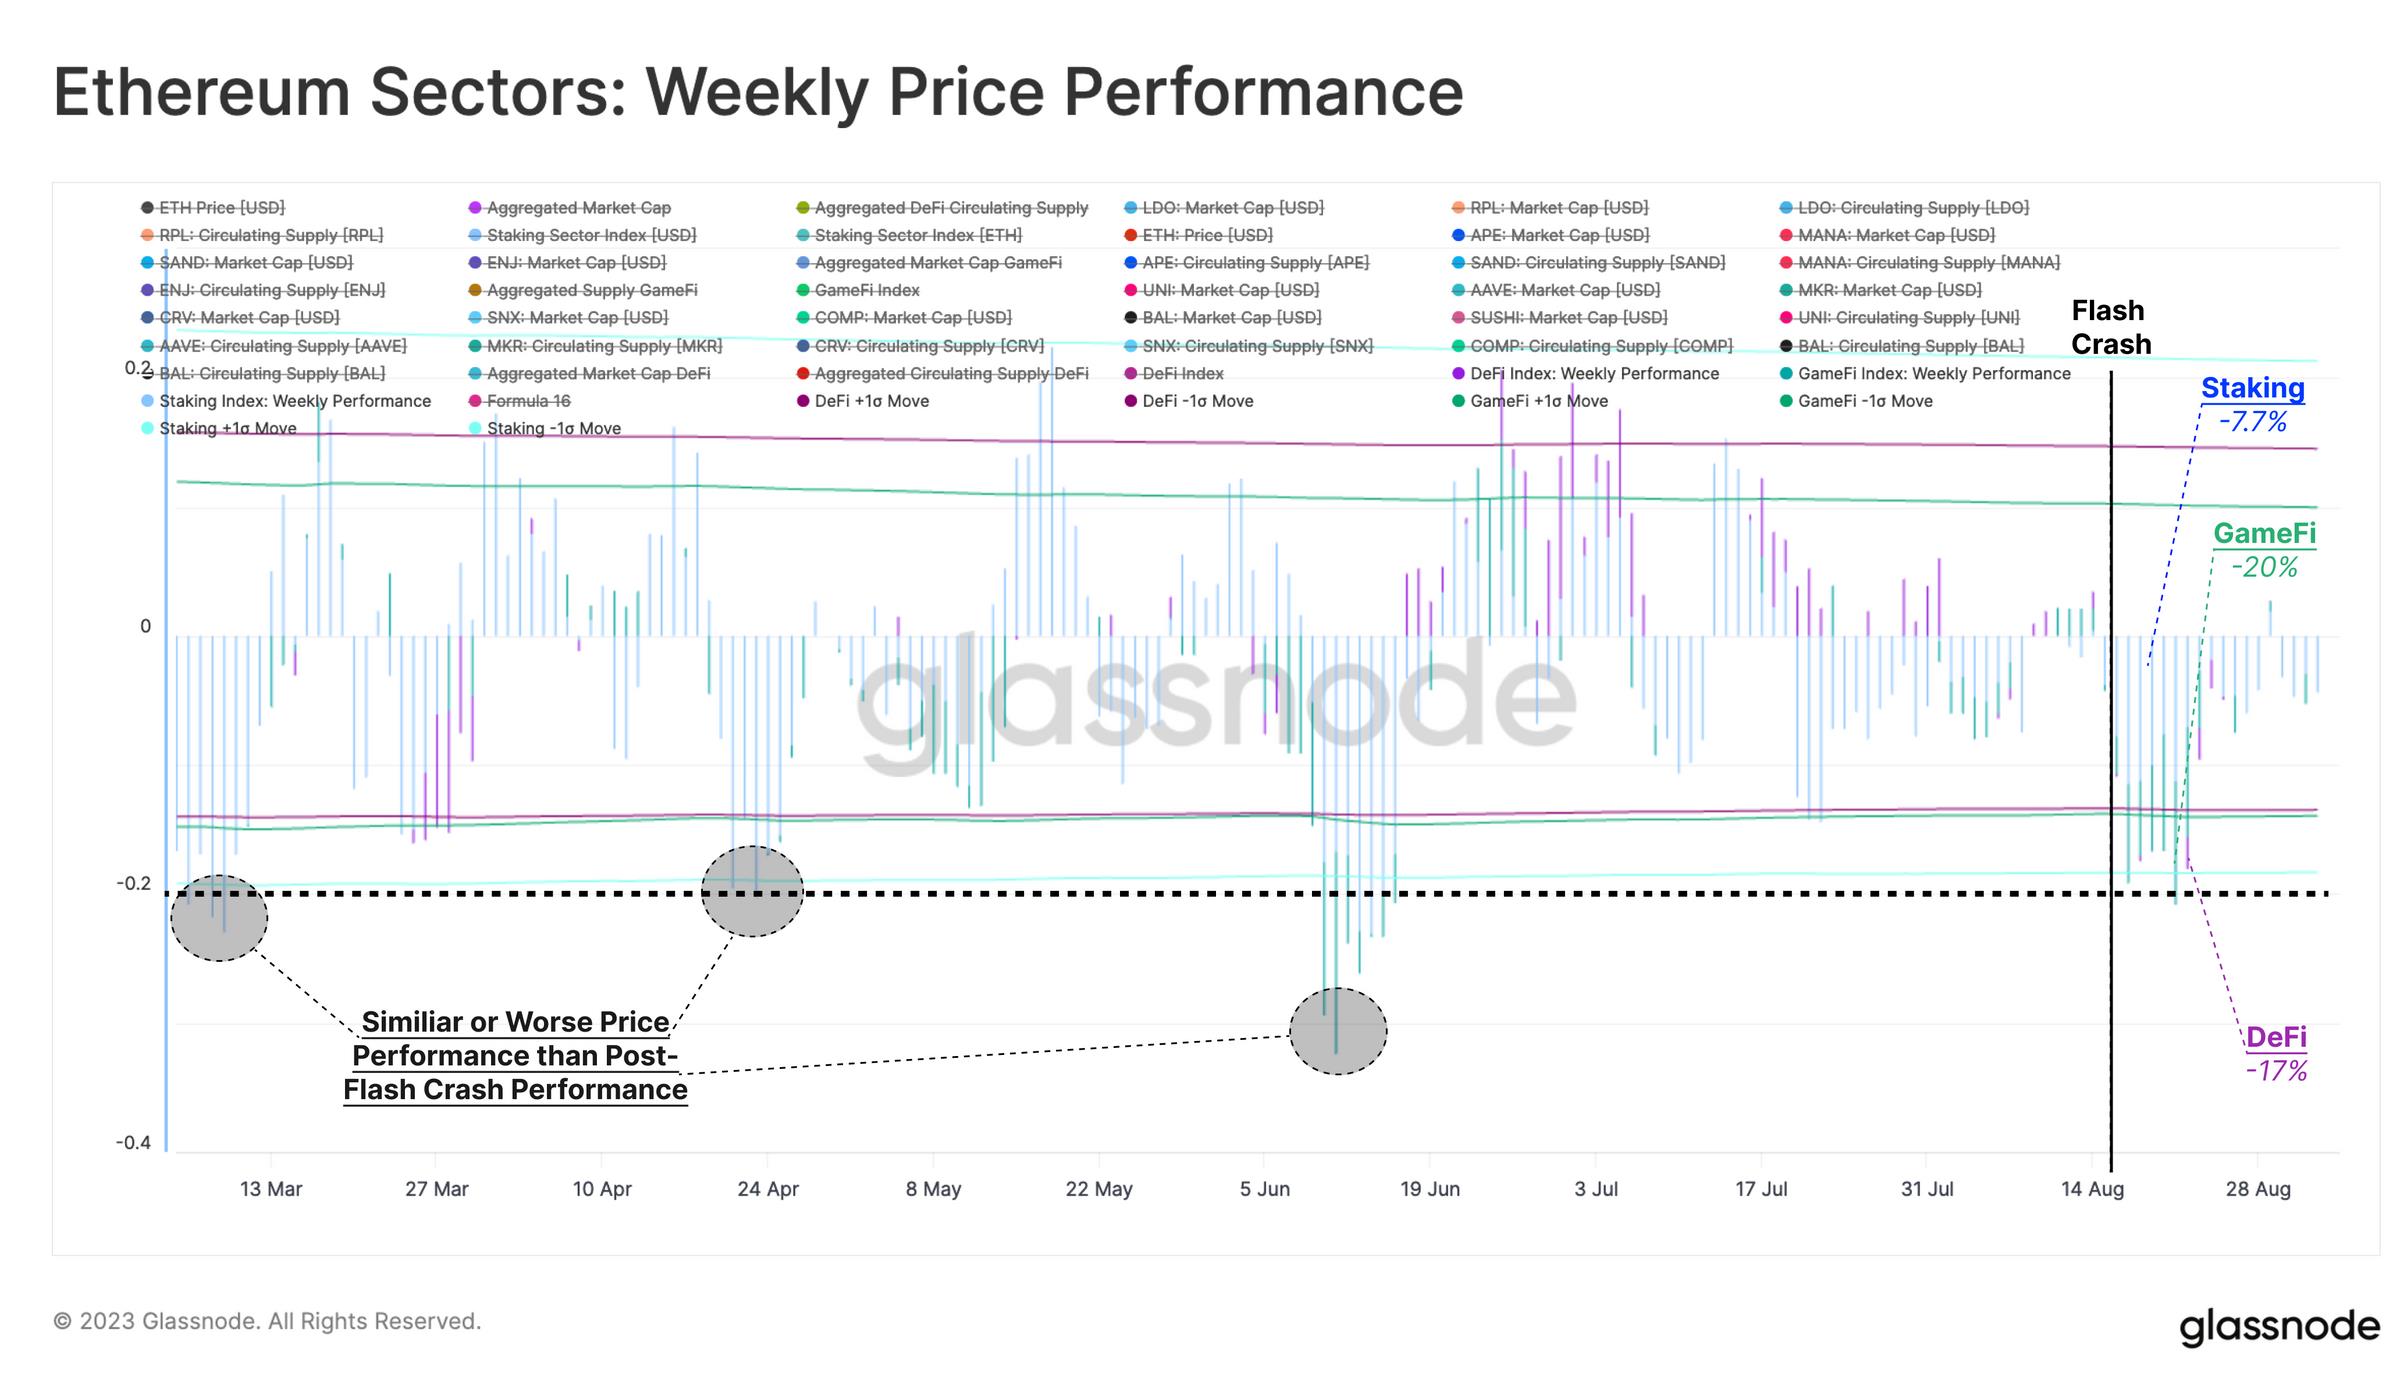
Within the Ethereum ecosystem, indices for DeFi, GameFi, and Staking have reacted differently. Each index consists of an average supply-weighted price of “blue-chip” tokens within its respective sector.
We observe that DeFi and GameFi tokens underperformed relative to the main digital assets, falling 17% and 20% respectively, while liquid staking tokens fared slightly better (down 7.7%). Overall, however, the downward price action is similar to or milder than the declines seen in March, April, and June.
Declining Risk Appetite in Derivatives Markets
A key development during the 2021–2023 cycle has been the maturation of derivatives markets, particularly for Bitcoin and Ethereum. The way derivatives price these assets provides valuable insight into market sentiment and positioning.
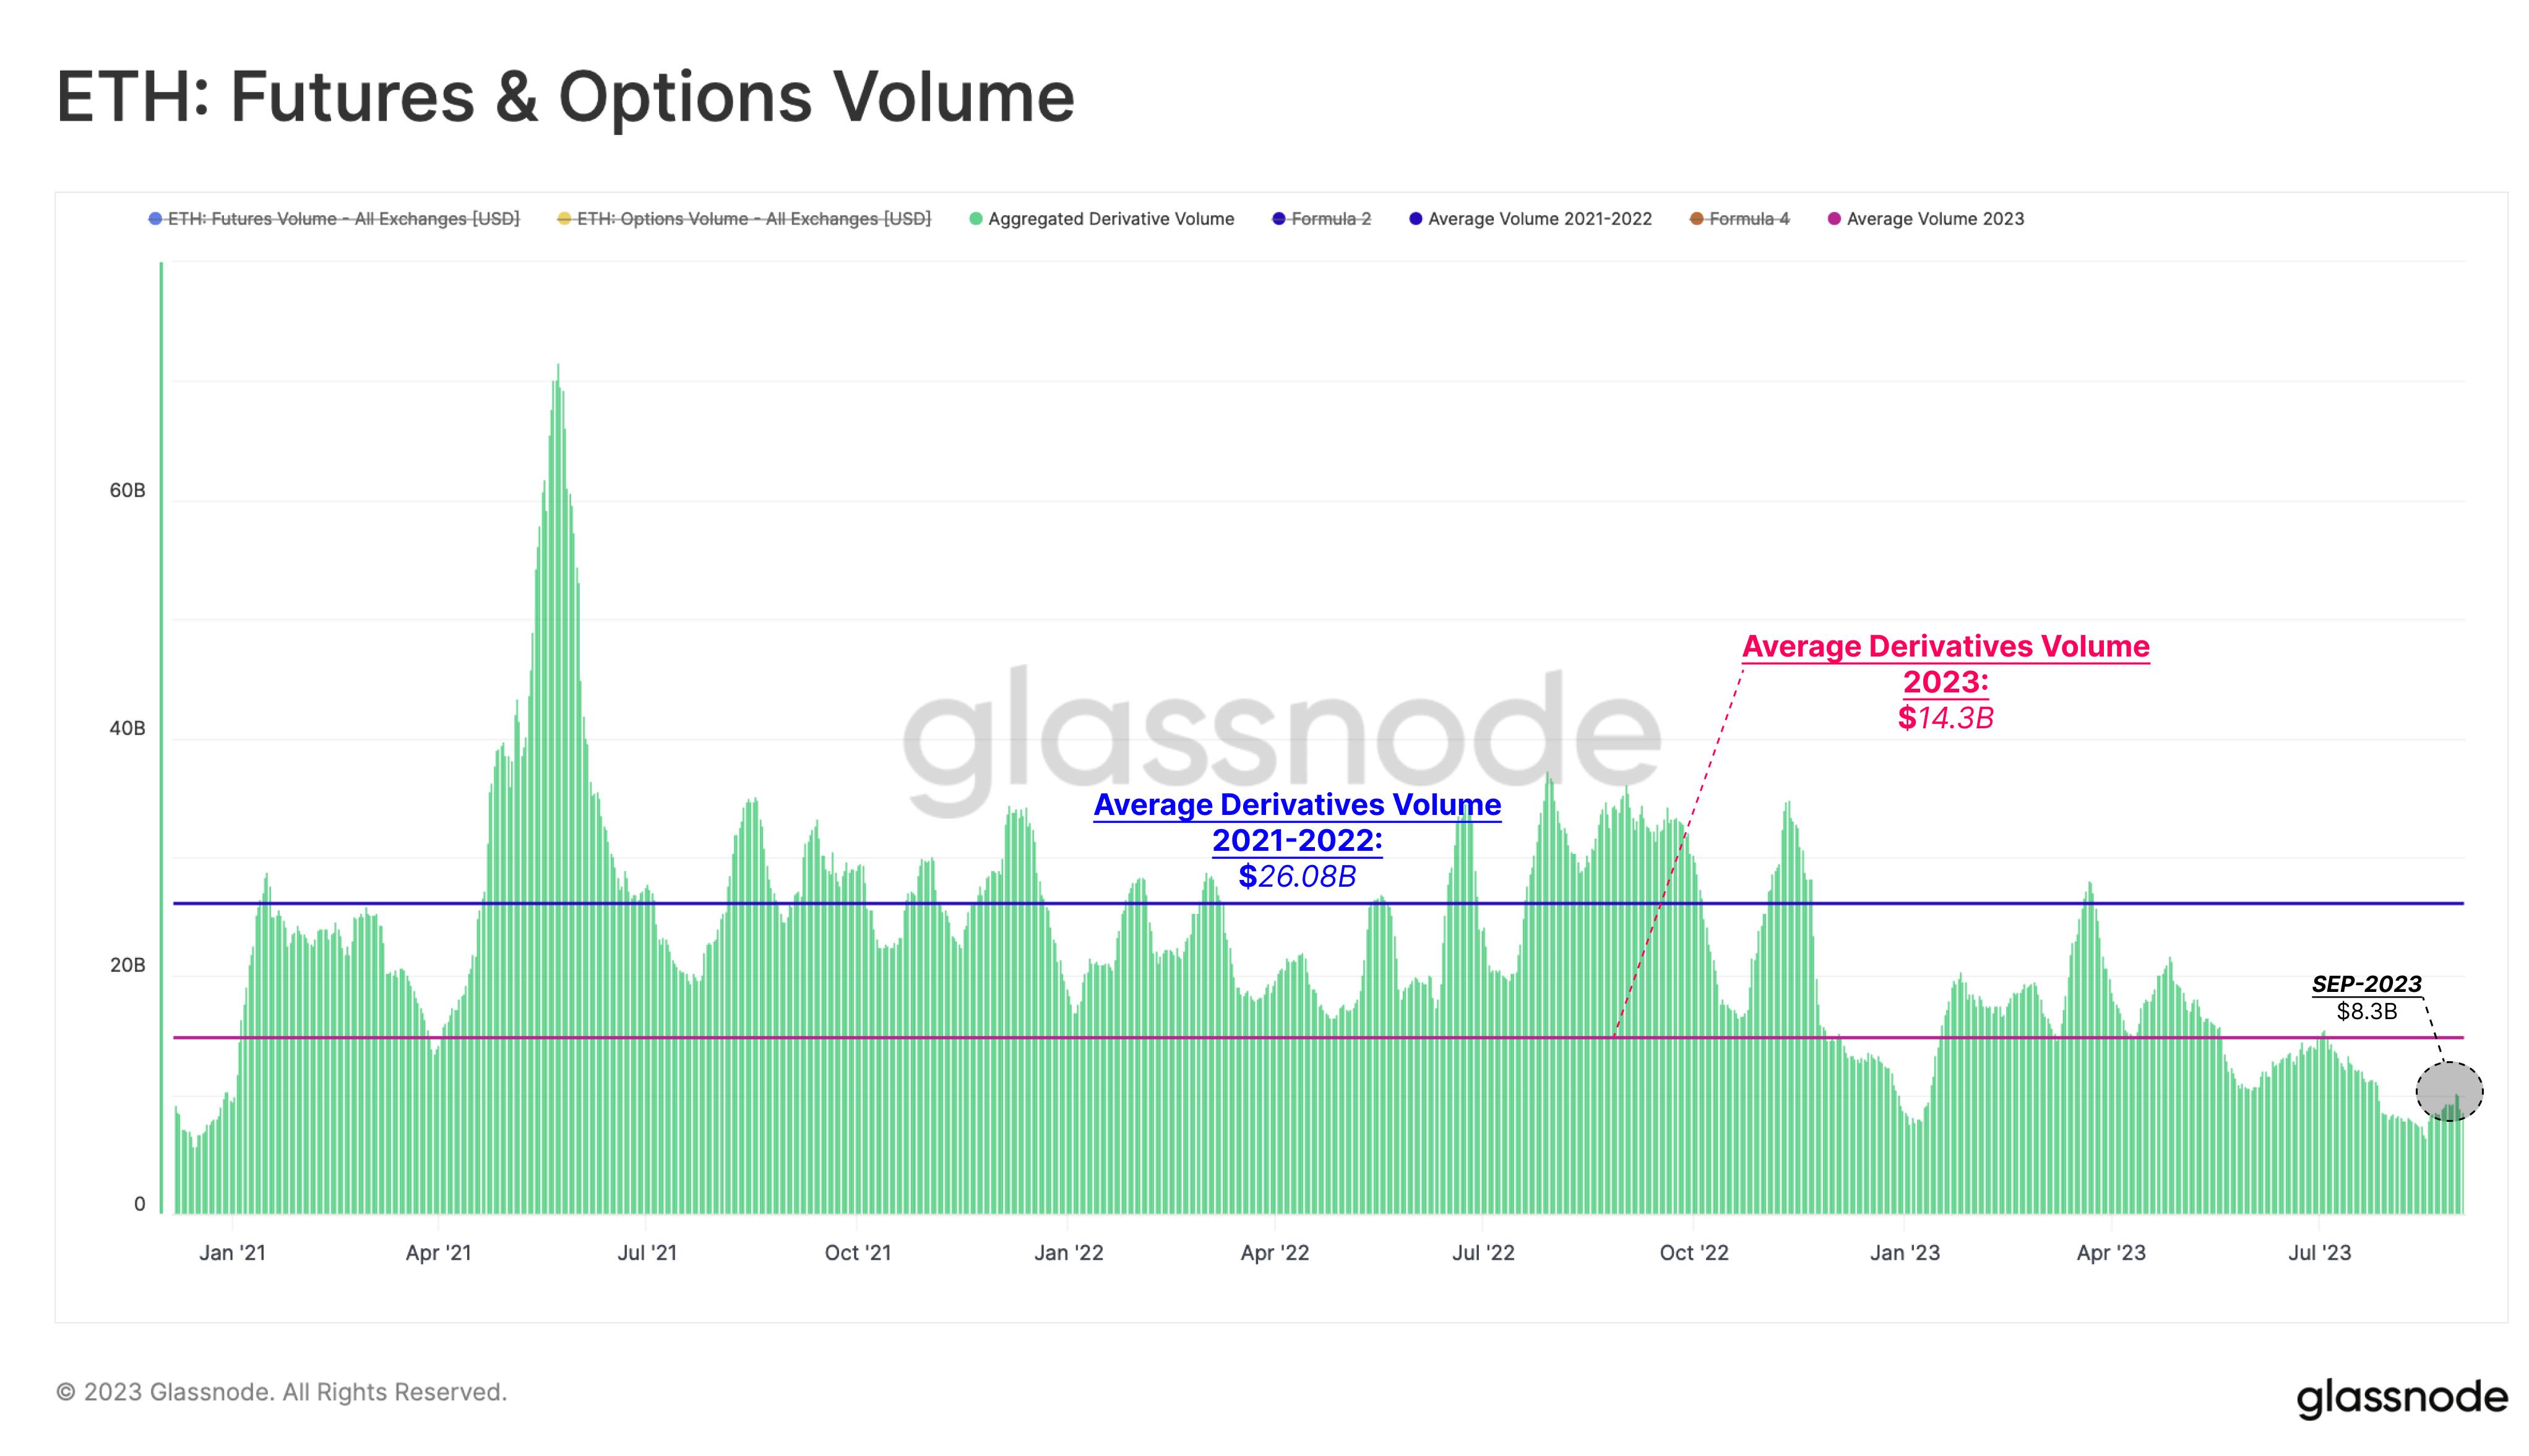
Overall activity in Ethereum’s futures and options markets in 2023 has been significantly lower than in 2021 and 2022. Average daily trading volume across both markets has declined to just $14.3 billion per day—about half the average of the past two years. This week, volumes dipped even further to $8.3 billion per day, indicating continued liquidity drain from the market.
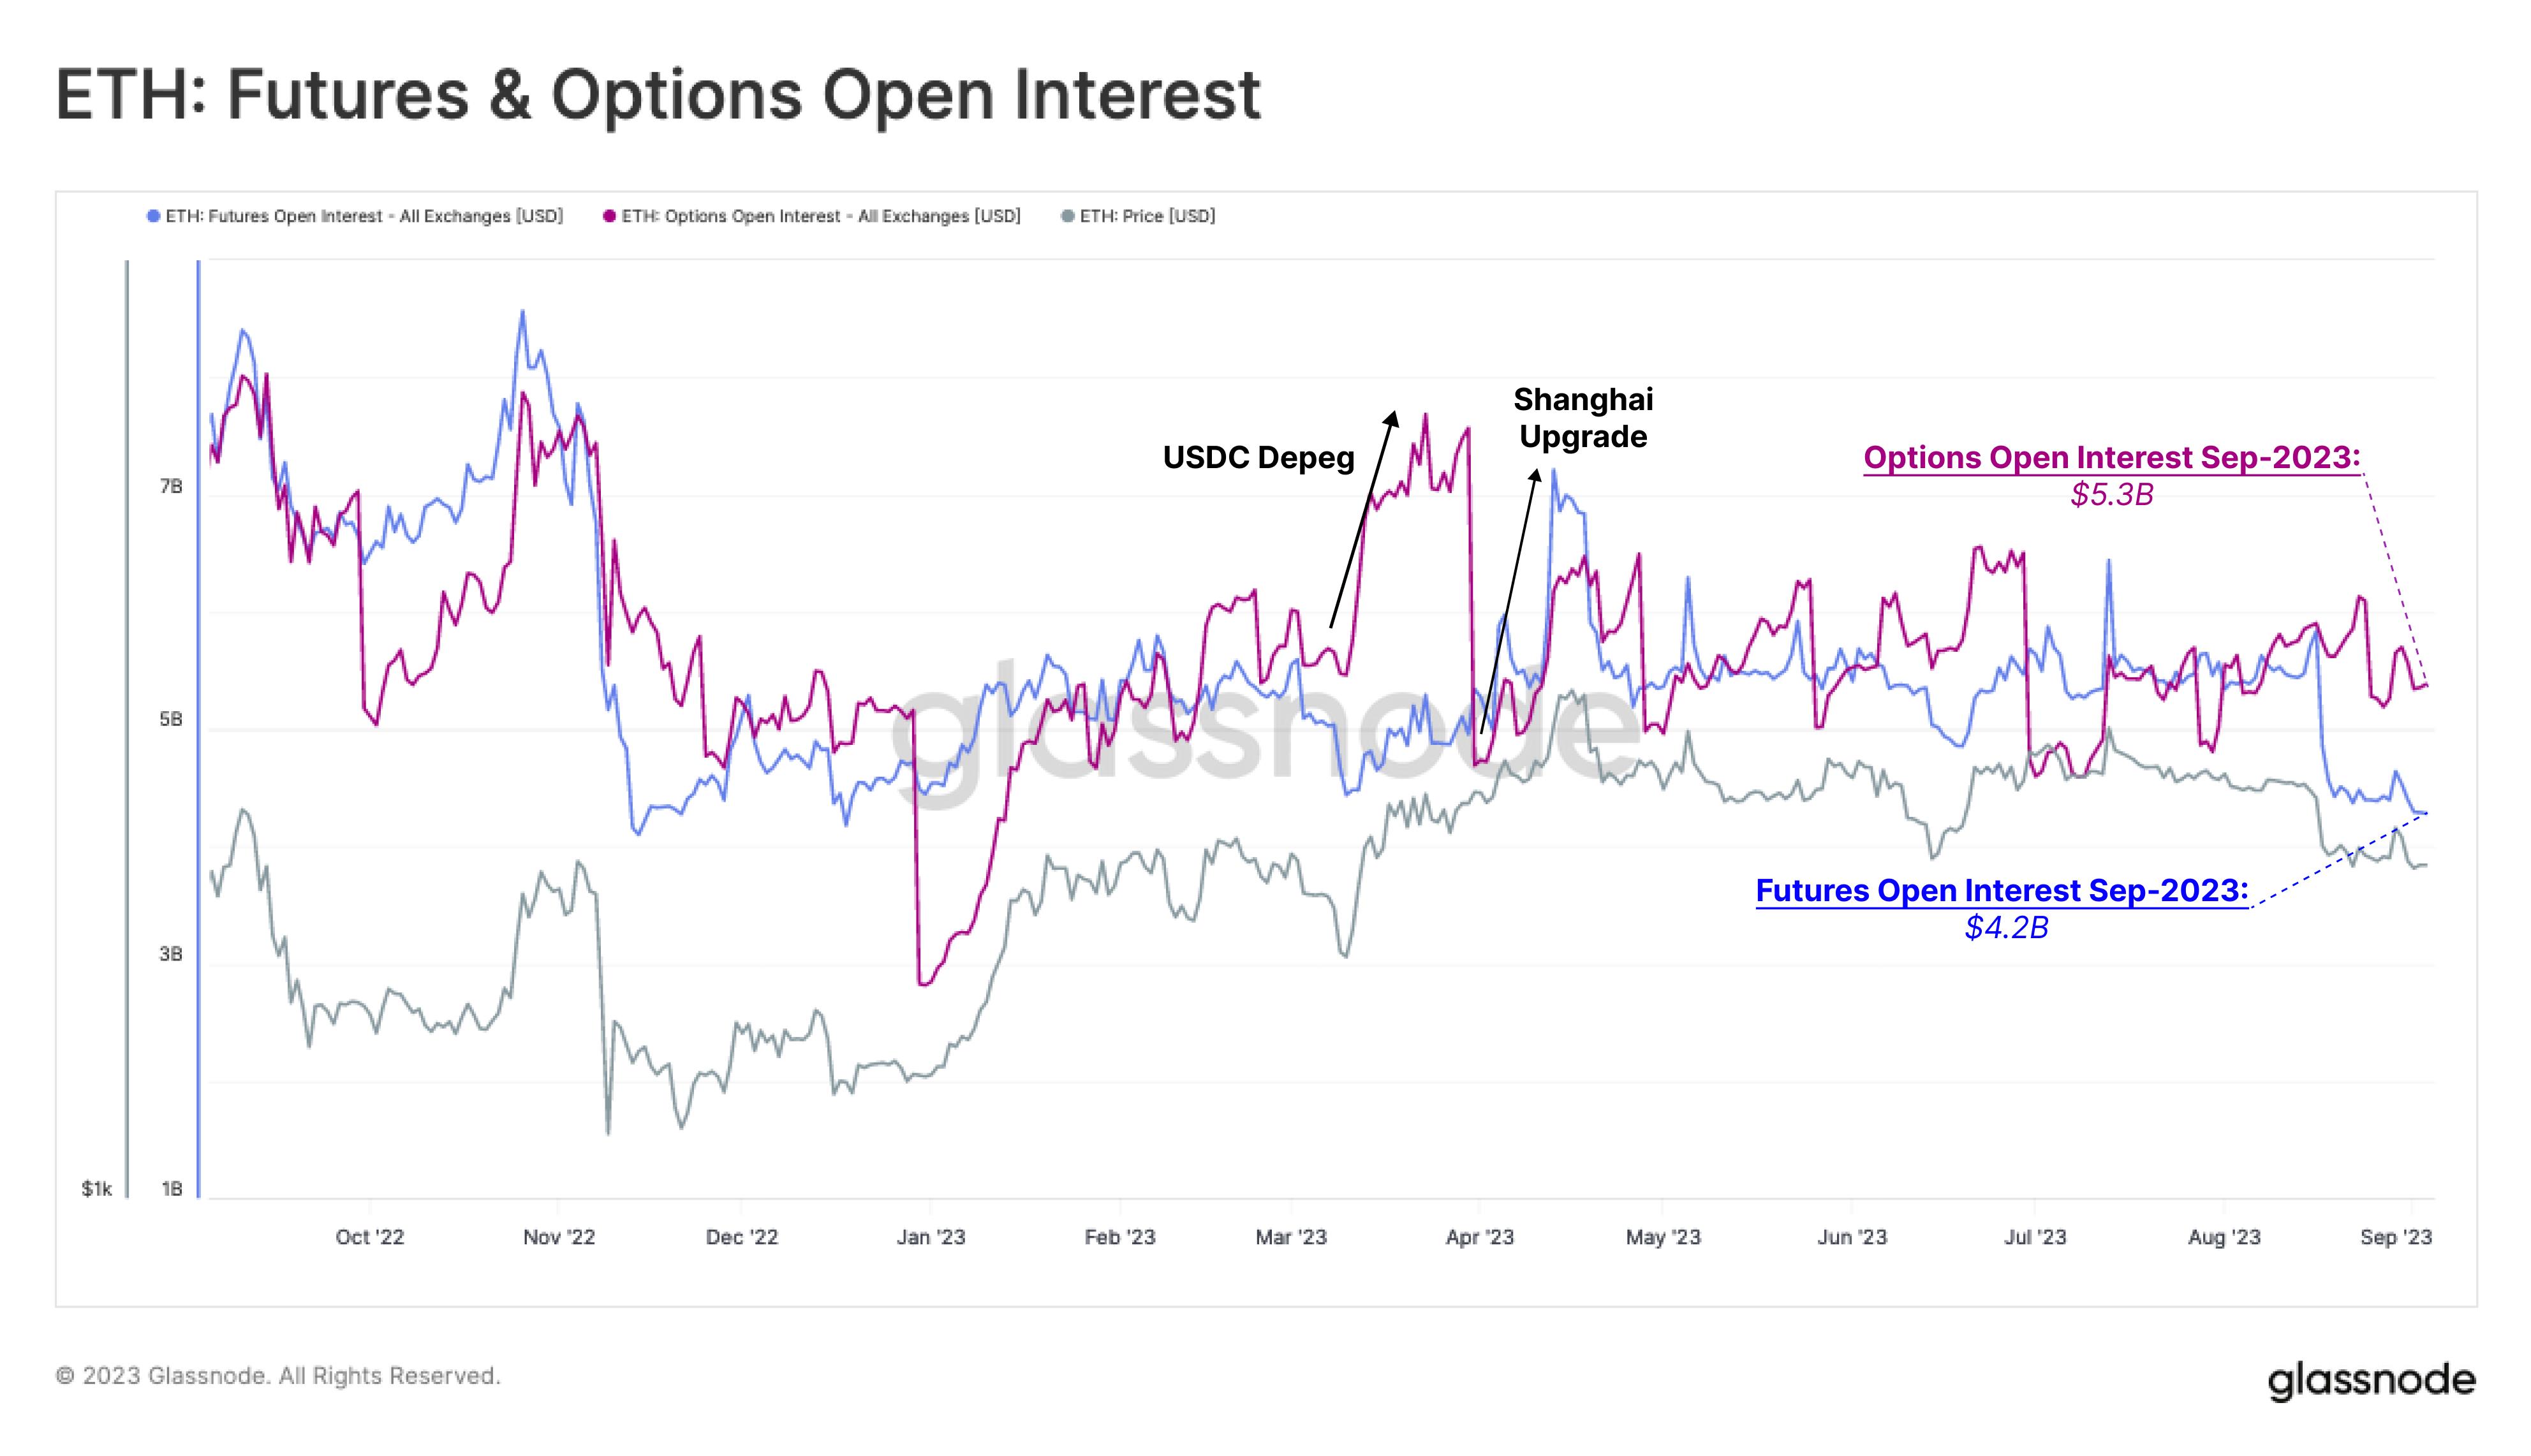
This trend is also reflected in open interest. After hitting post-FTX collapse lows, options open interest began rising at the start of 2023. For options, open interest peaked during the March banking crisis when USDC depegged from $1. Ethereum futures open interest peaked around the Shanghai upgrade, suggesting this was the last major speculative event for the asset.
Since then, the notional value of active contracts in both markets has remained relatively stable. Similar to our observations in the Bitcoin market (WoC 32), the Ethereum options market is now comparable in size ($5.3 billion) to the futures market ($4.2 billion)—and actually slightly larger.
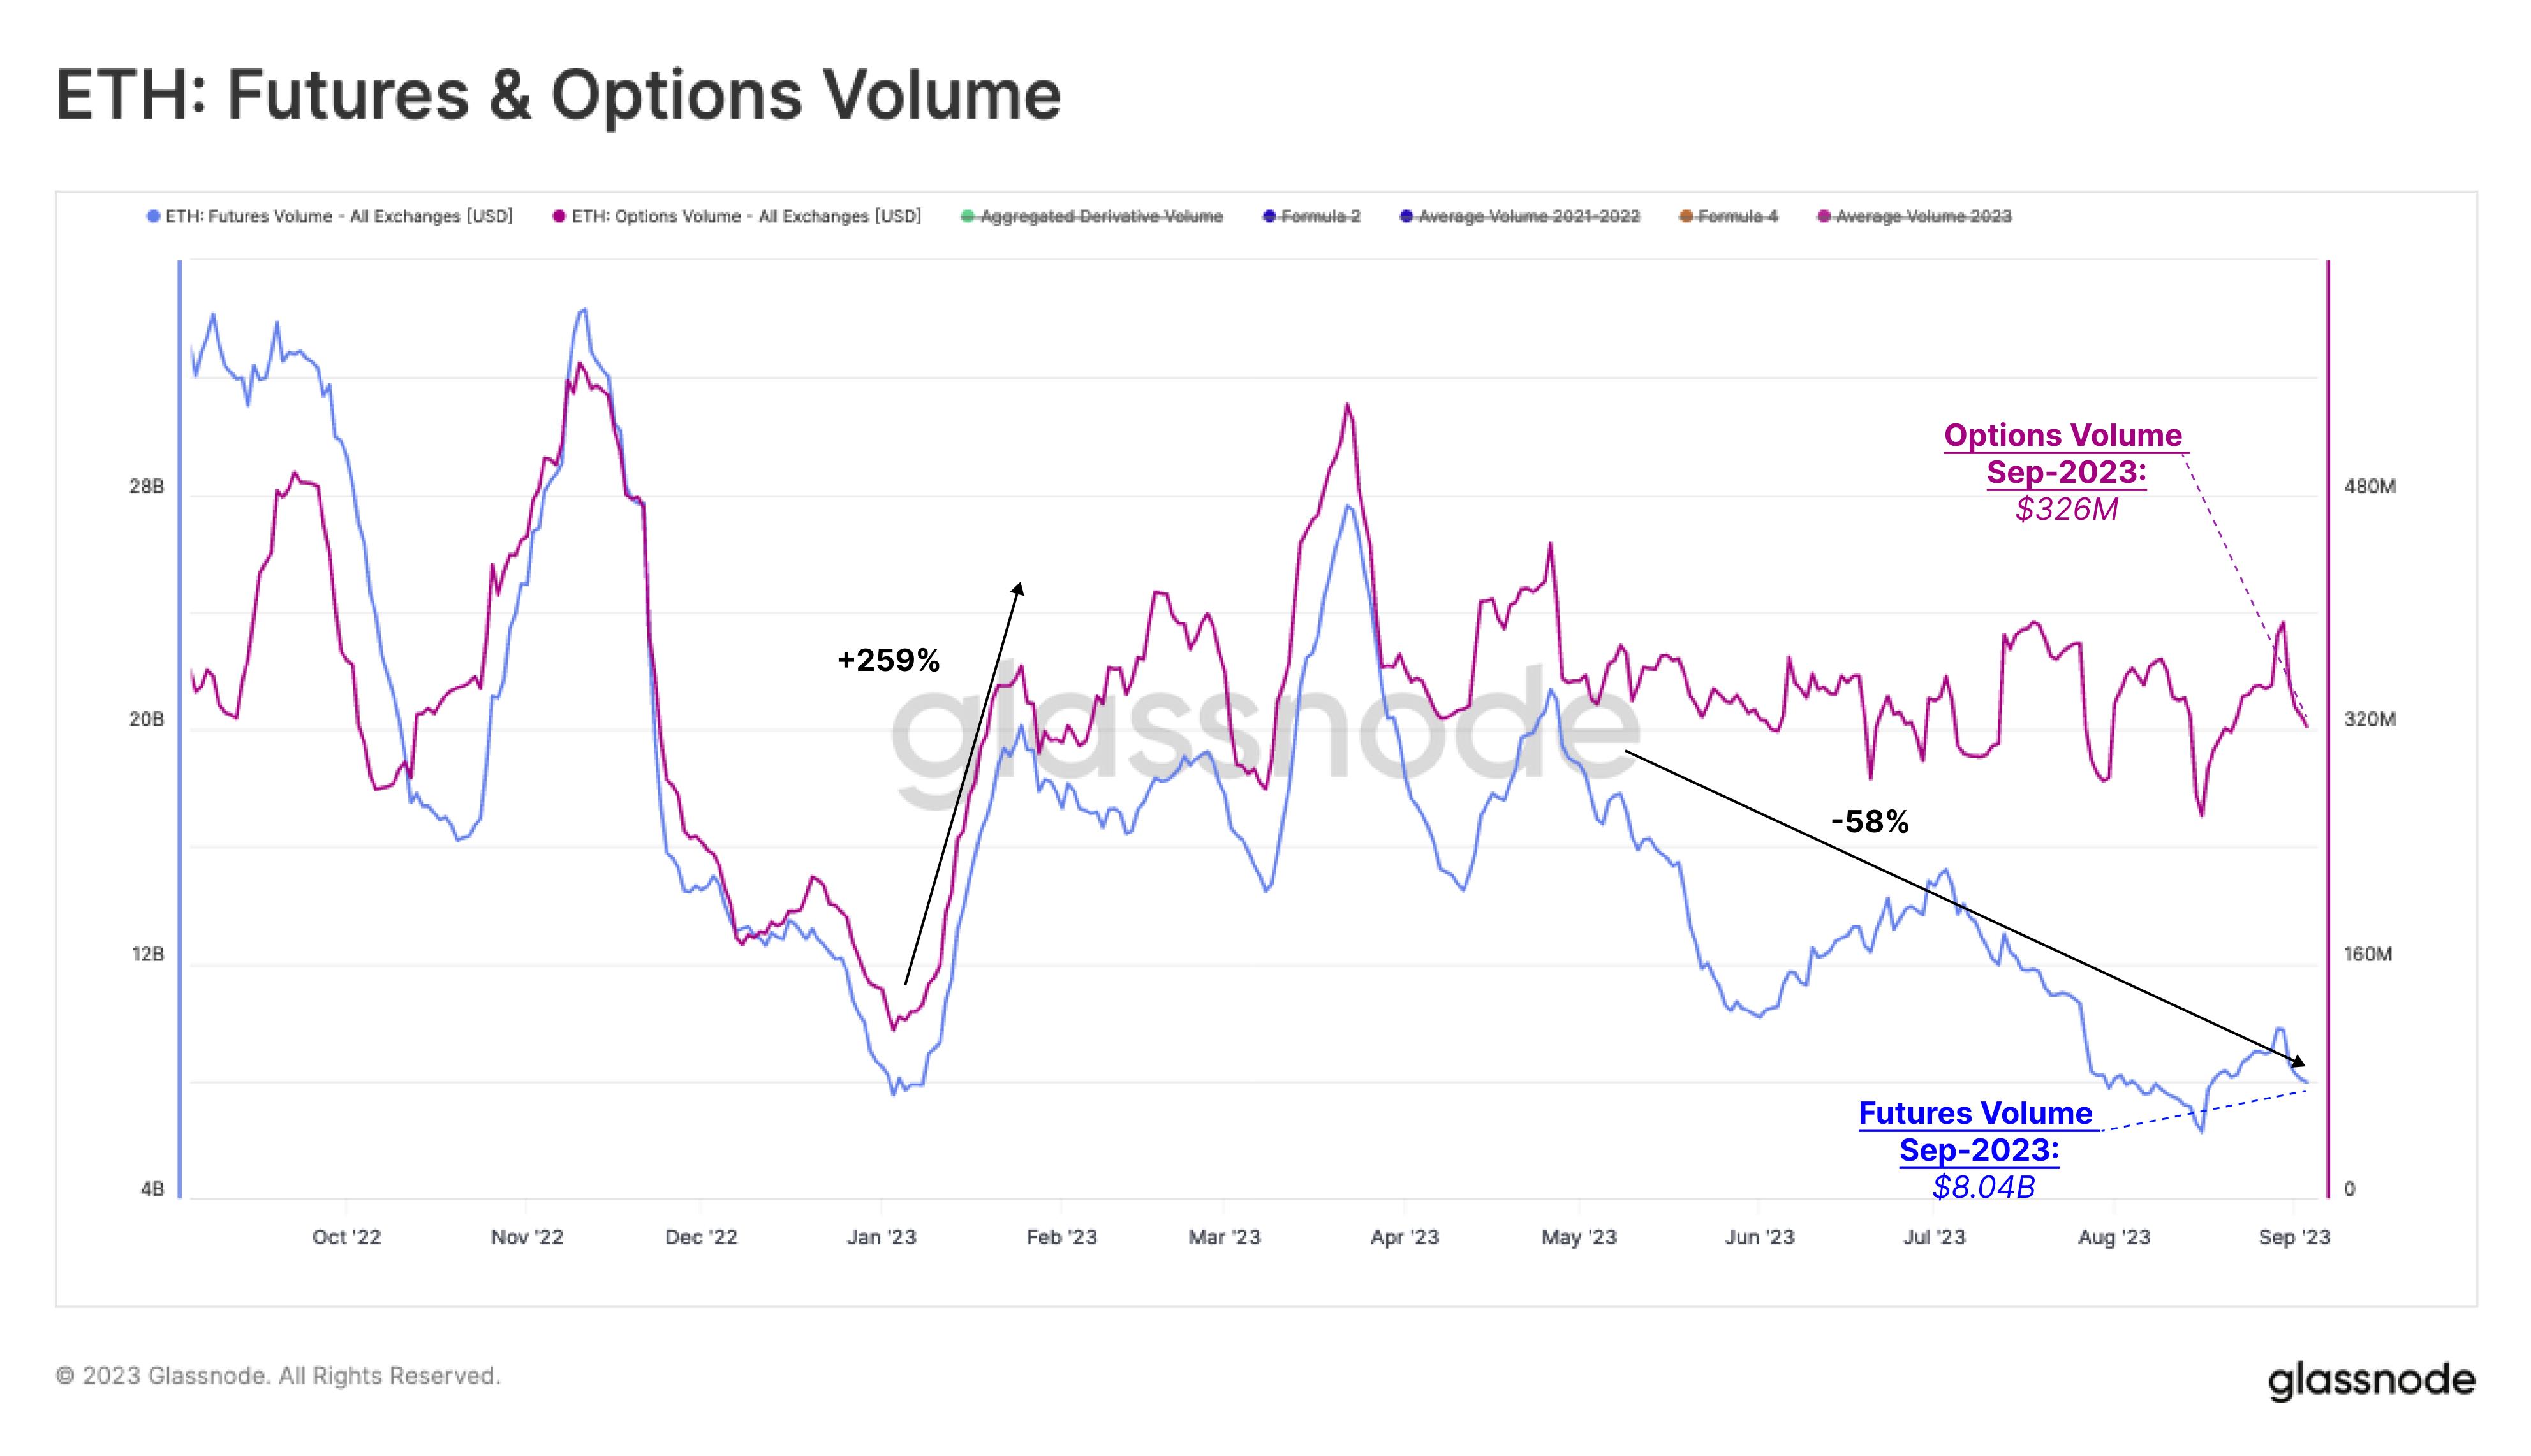
Since the beginning of the year, the Ethereum options market has grown significantly, with trading volume increasing by 256% to $326 million per day. Meanwhile, futures trading volume has steadily declined this year—from $20 billion per day in early January to $8 billion today. The only notable exception occurred during the Shanghai upgrade, when volume briefly surged to about $30 billion per day.
Given that trading volumes in both markets showed no significant change in August, this suggests traders continue migrating liquidity up the risk curve.
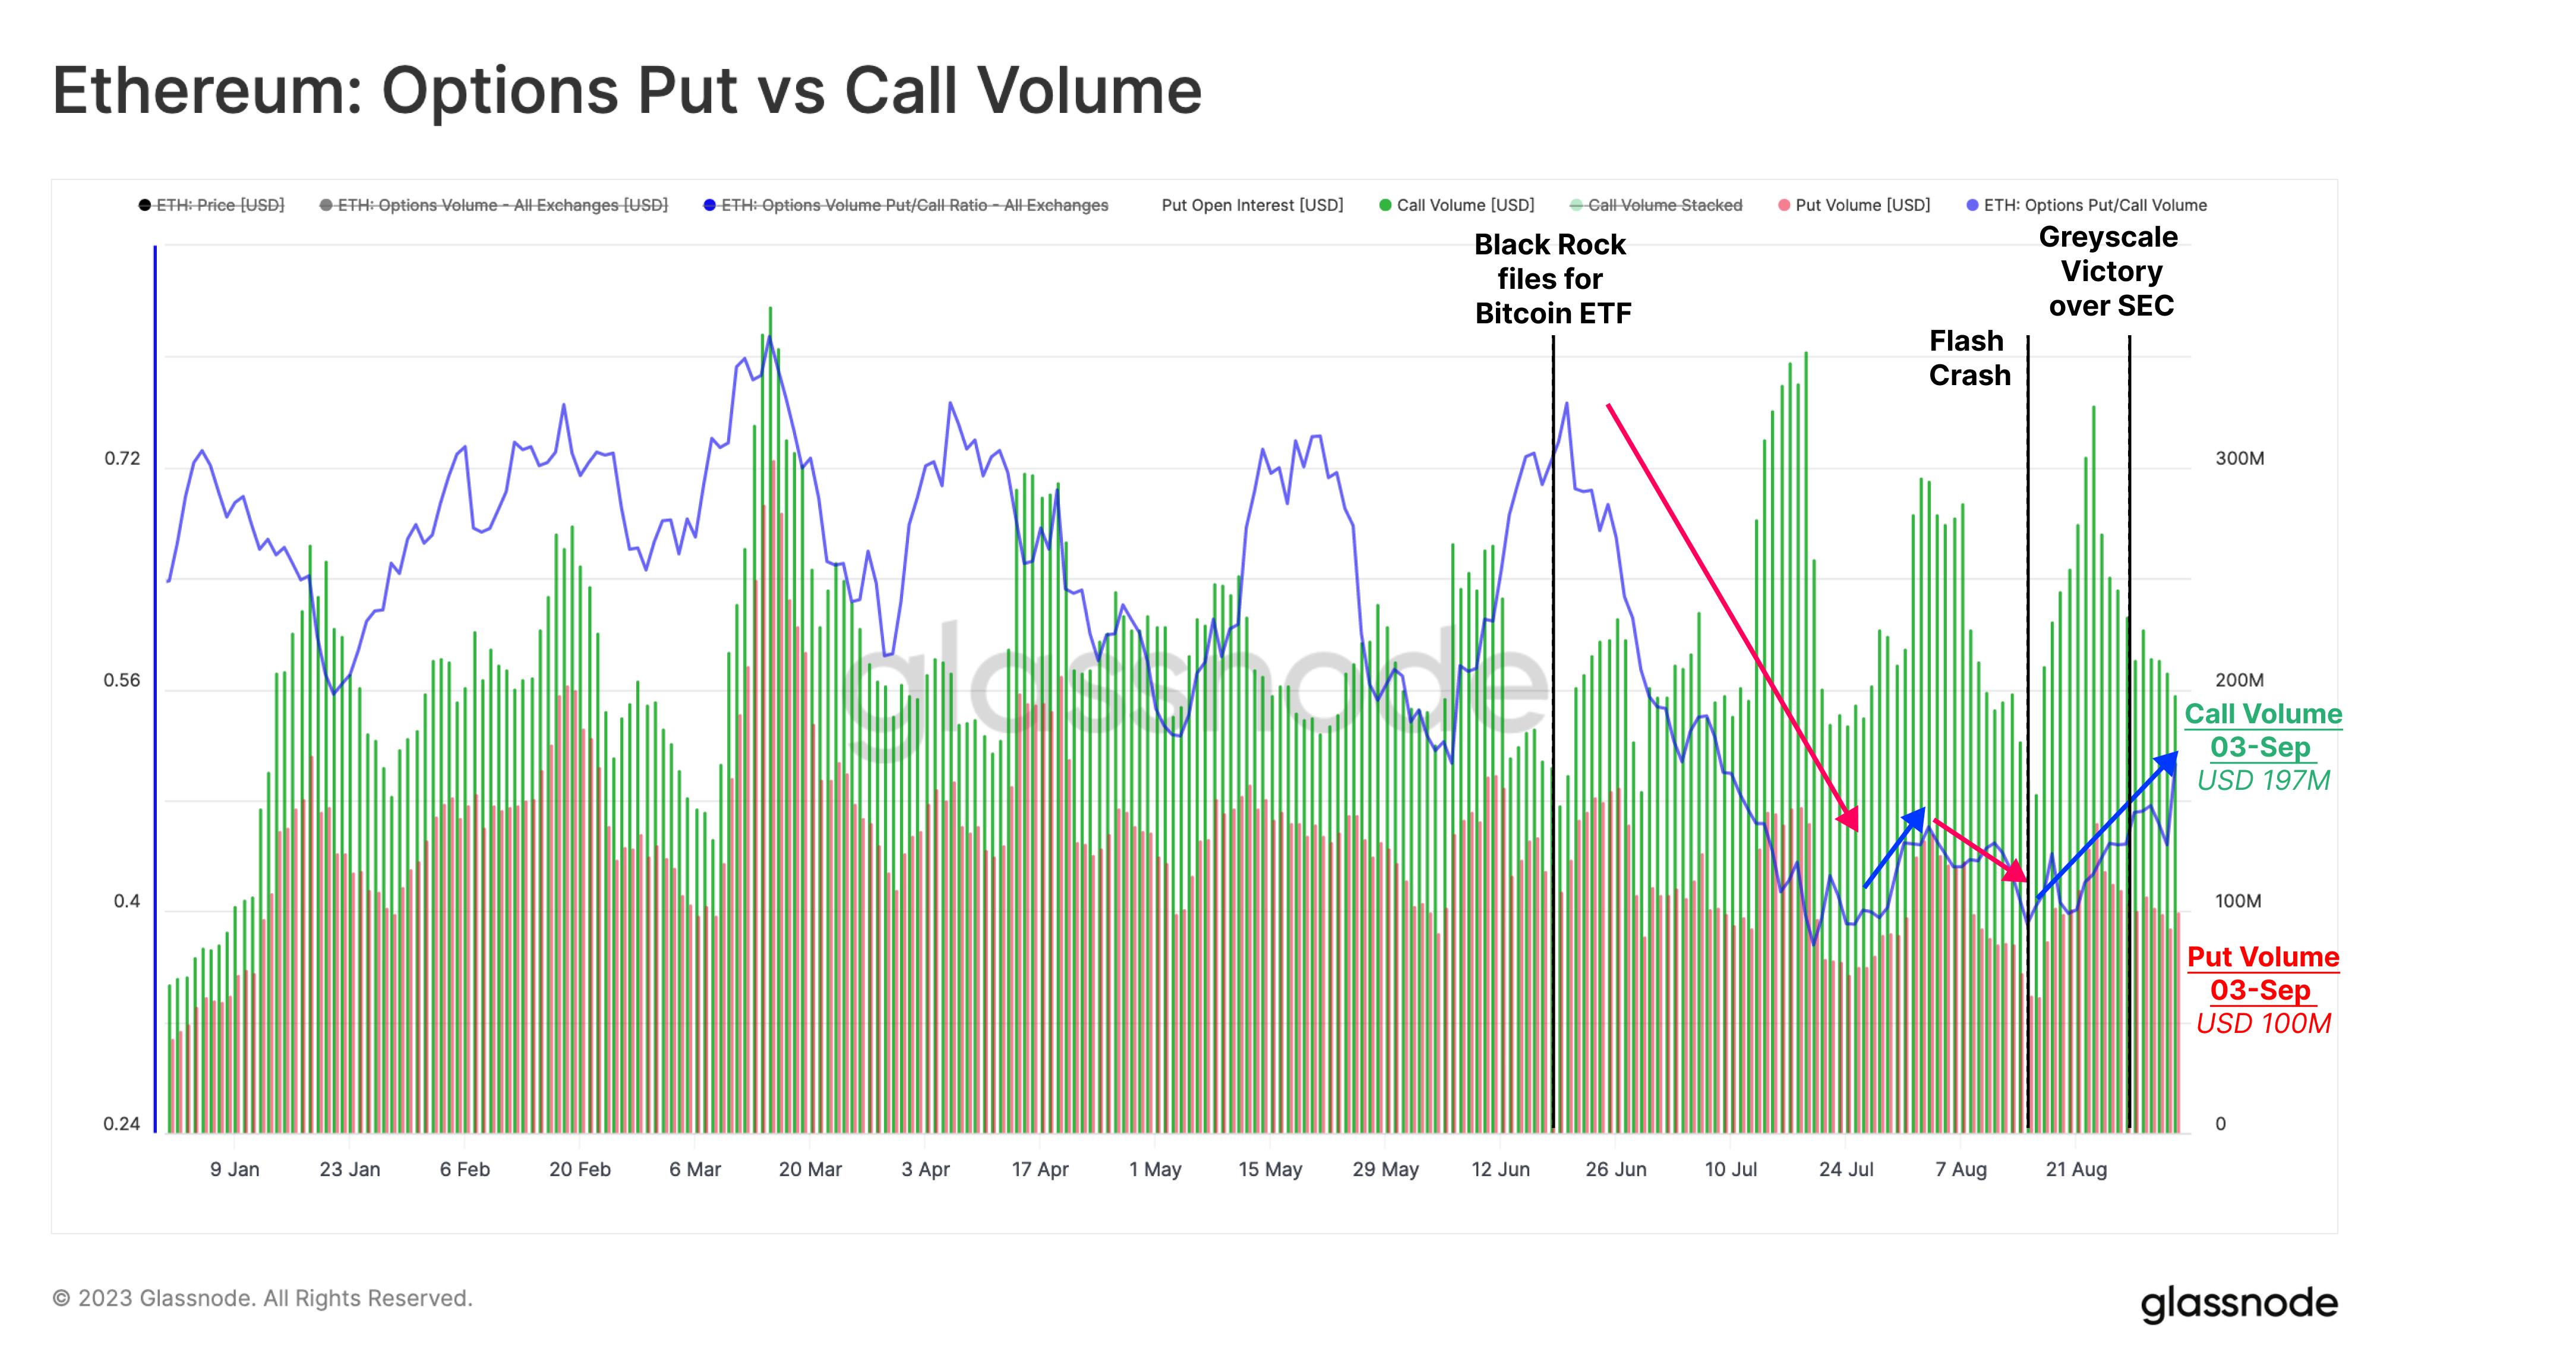
From the Put/Call ratio, we can see high responsiveness to major news events. For example, after BlackRock filed for a Bitcoin ETF, sentiment turned more bullish, and the ratio dropped from 0.72 to 0.40.
However, this changed during the August 17 sell-off, when the put/call ratio rose to 0.50, and bullish trading volume plummeted from $320 million per day to $140 million.
Are Liquidity Pools Like Options Markets?
To support our analysis above, we now turn to examining activity in automated market makers such as the Uniswap ETH/USDC liquidity pool. Since the introduction of concentrated liquidity in Uniswap V3, there's been a view that Uniswap liquidity positions can be interpreted similarly to priced call and put options. While we don't believe the options analogy fully captures these dynamics, there are indeed many similarities worth exploring.
Our analysis focuses on the USDC/ETH 0.05% fee tier pool—the most active Uniswap liquidity pool—and thus expected to provide the strongest signal. This pool has a 7-day trading volume of $1.51 billion and a total value locked (TVL) of $260 million.
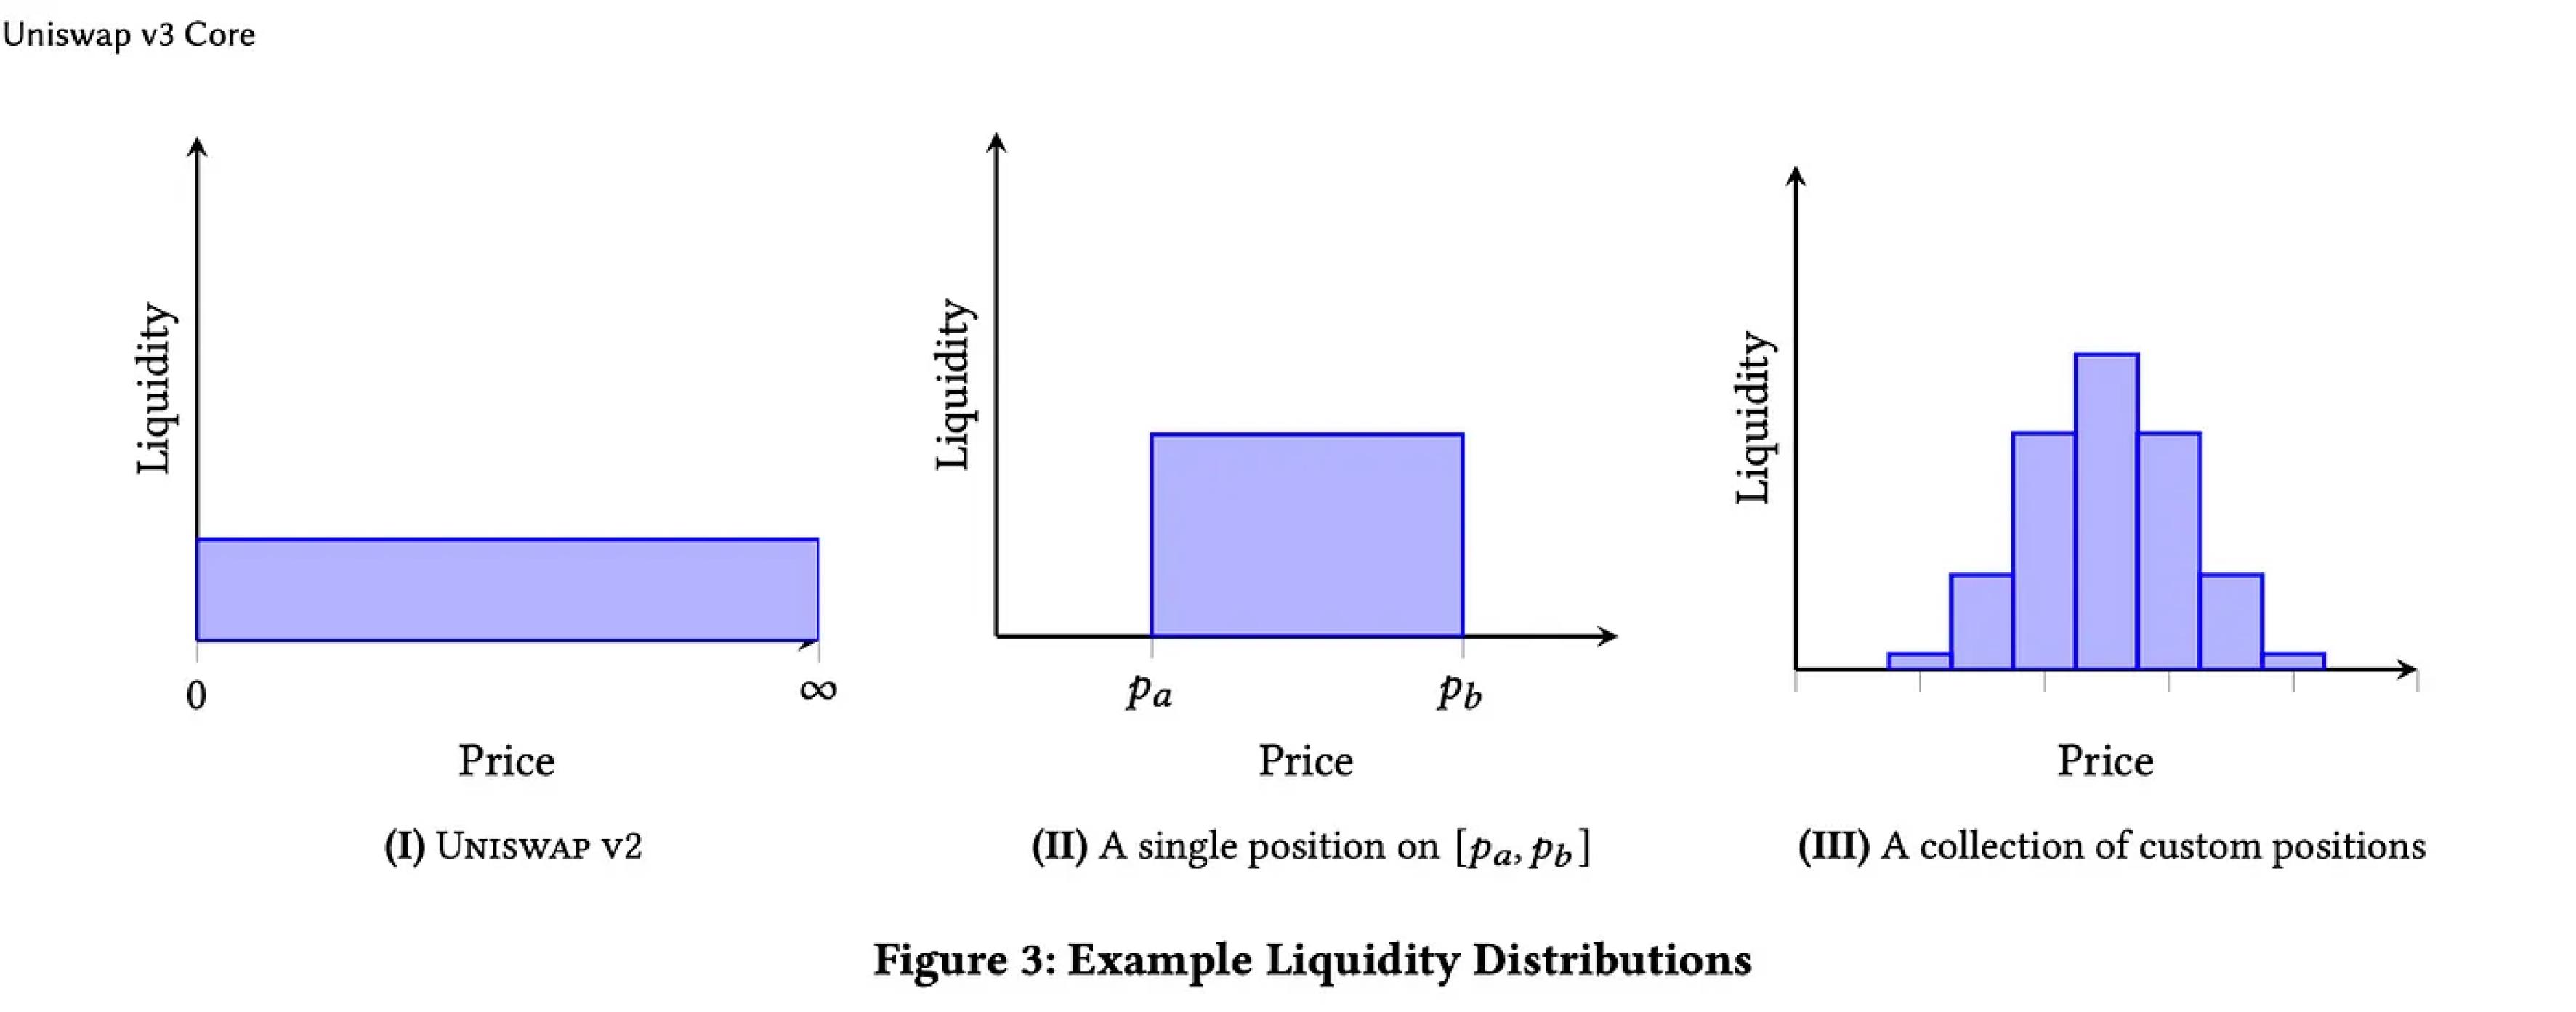
Uniswap V3’s unique feature is concentrated liquidity. Liquidity providers (LPs) can choose a price range within which their liquidity will be concentrated. Fee income is only earned when the market trades within that range (similar to strike prices), and the narrower the range, the higher the relative fee income. This improves the user experience for DEX traders due to tighter spreads and increases capital efficiency for LPs.
Therefore, LPs’ capital allocation must reflect expectations about volatility (the gap between upper and lower bounds) and expected price ranges (upper and lower strike levels). Assuming LPs actively manage their positions, we may derive insights similar to those from options market data.
We first examine overall activity in the USDC/ETH 0.05% pool. For various reasons, we avoid using TVL as a proxy for pool activity or the underlying token pair’s activity. Instead, we use two alternative metrics:
-
Daily Mints: the number of new liquidity positions opened by LPs,
-
Daily Burns: the number of liquidity positions closed by LPs.
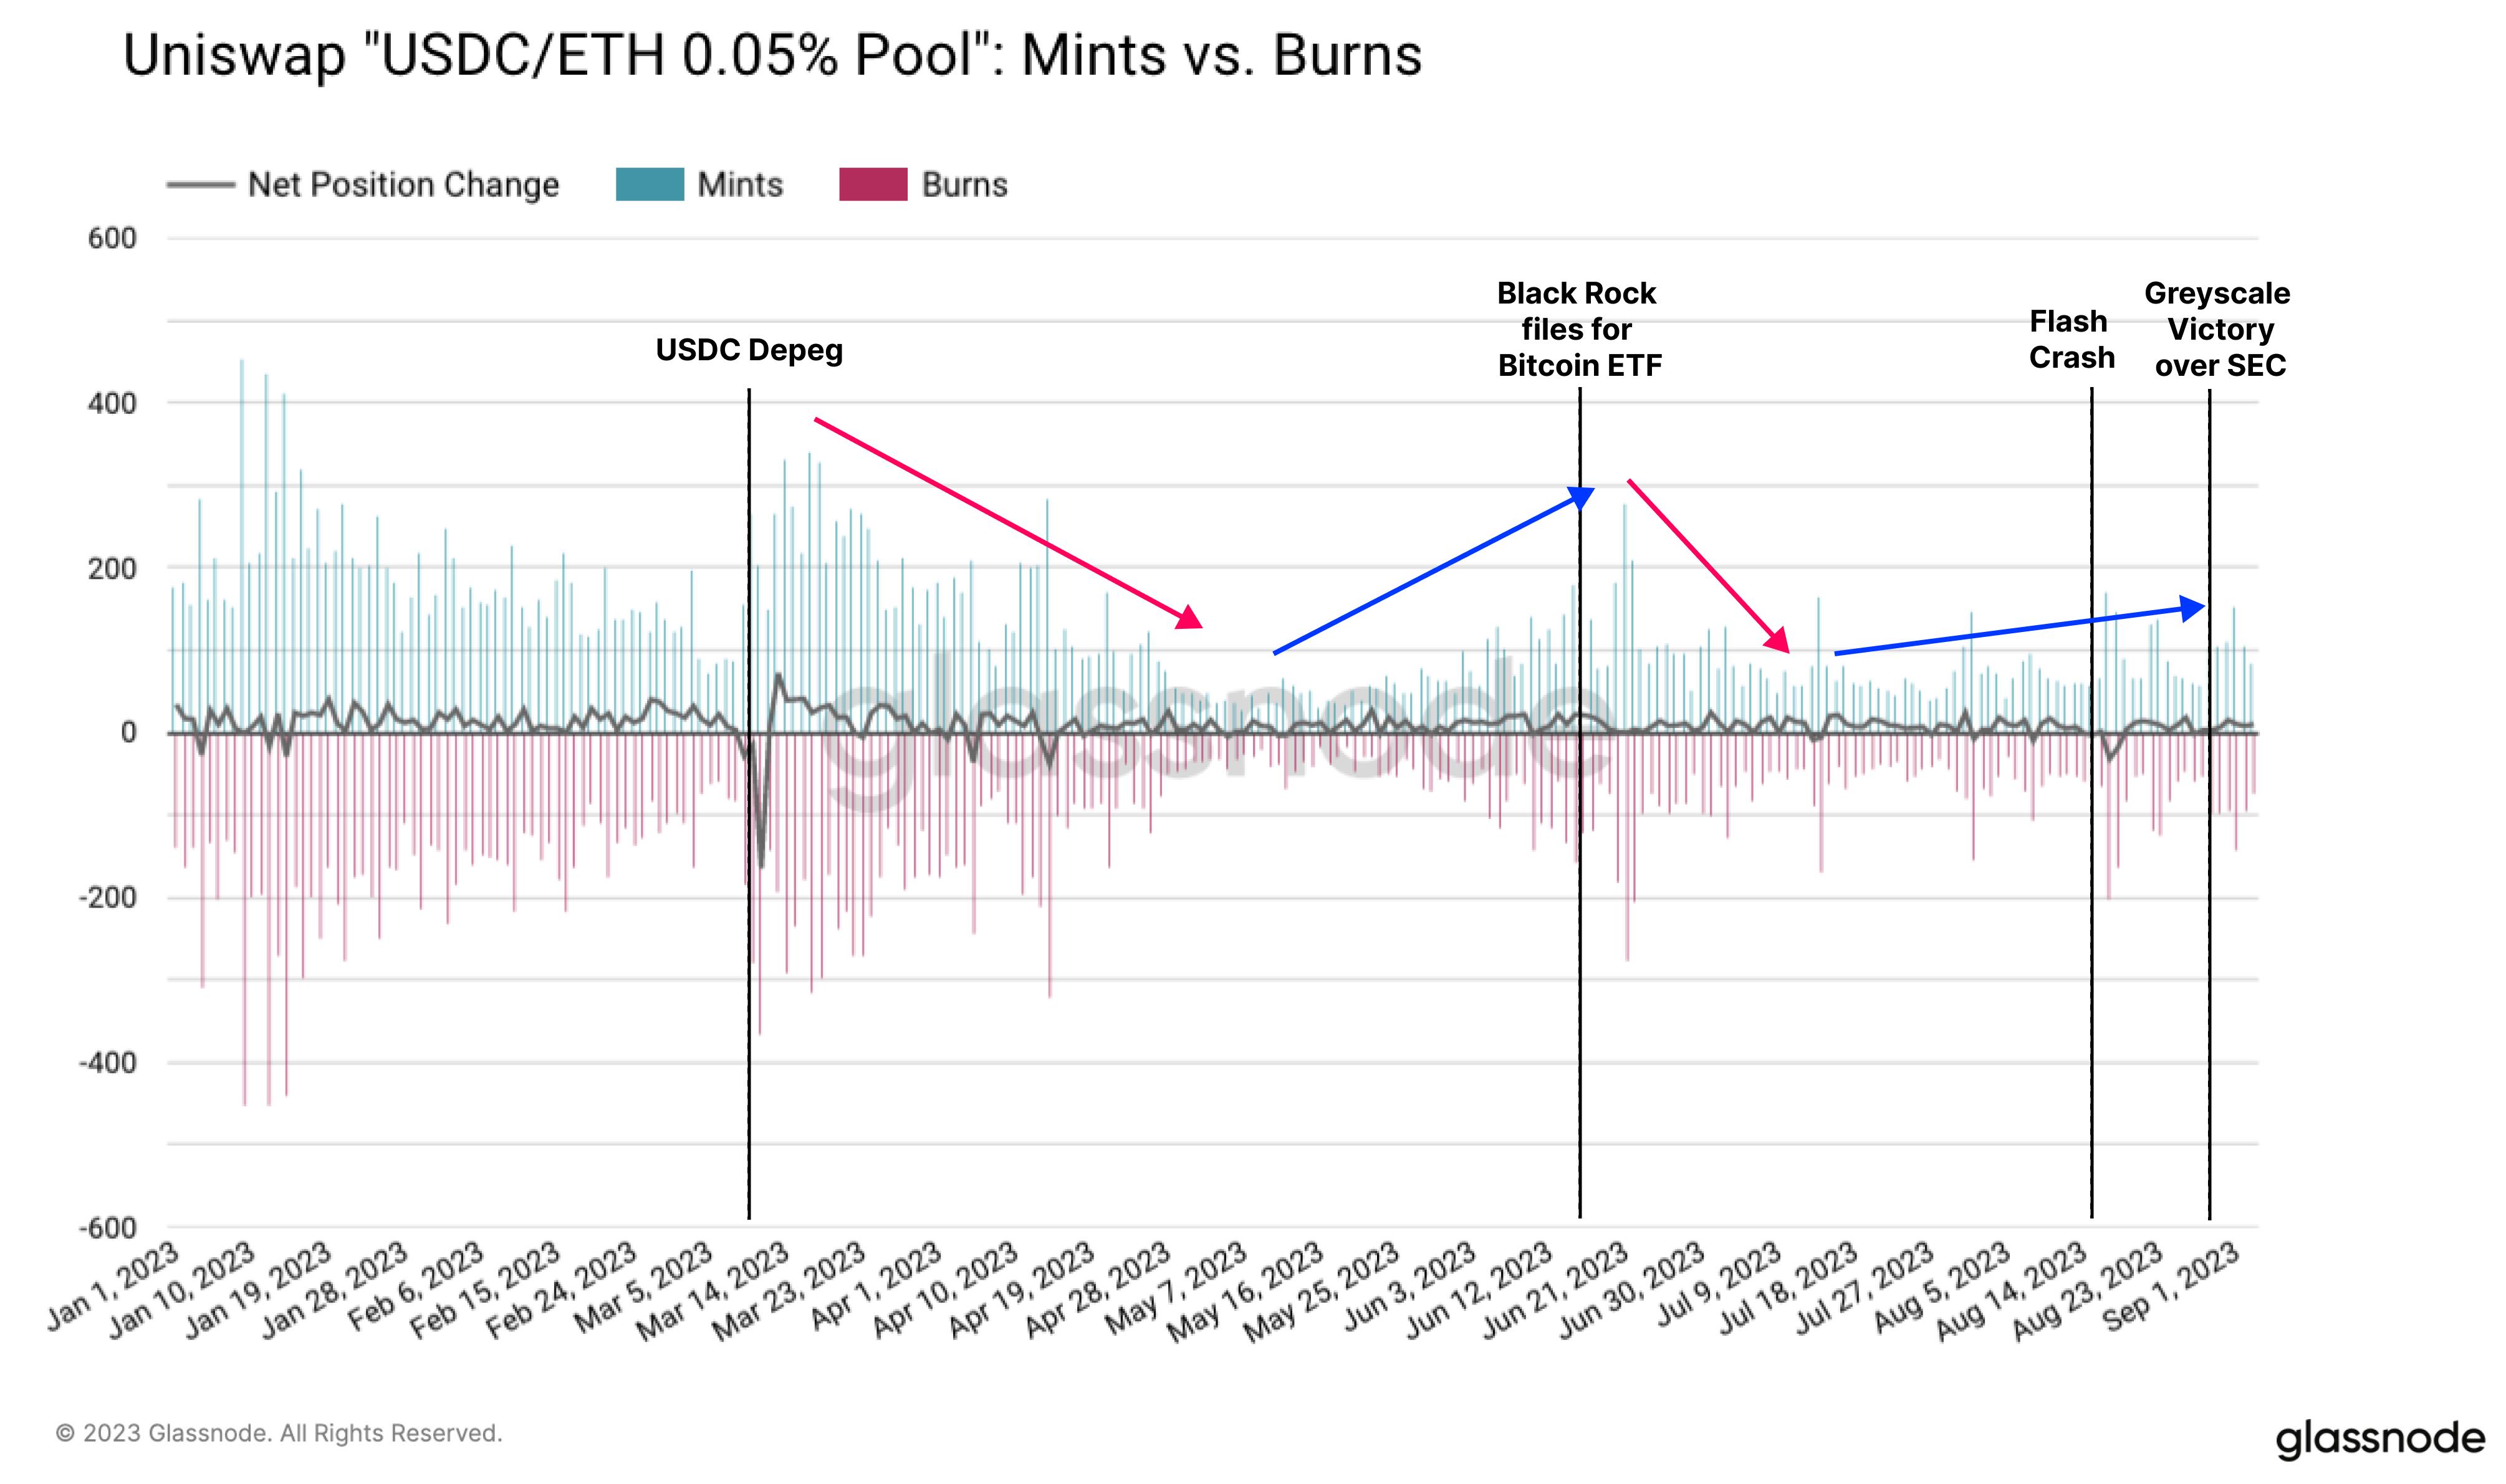
According to these metrics, activity contracted after the March banking crisis and the April Shanghai upgrade, remaining relatively low until early June. Then we observe sharp spikes in both mints and burns during the BlackRock ETF announcement and the August 17 sell-off.
The chart below also shows the net change in the number of LP positions, measuring the balance between openings and closings. We note that this metric is less influenced by broader market trends and more responsive to specific events, suggesting short-term volatility is a key driver.
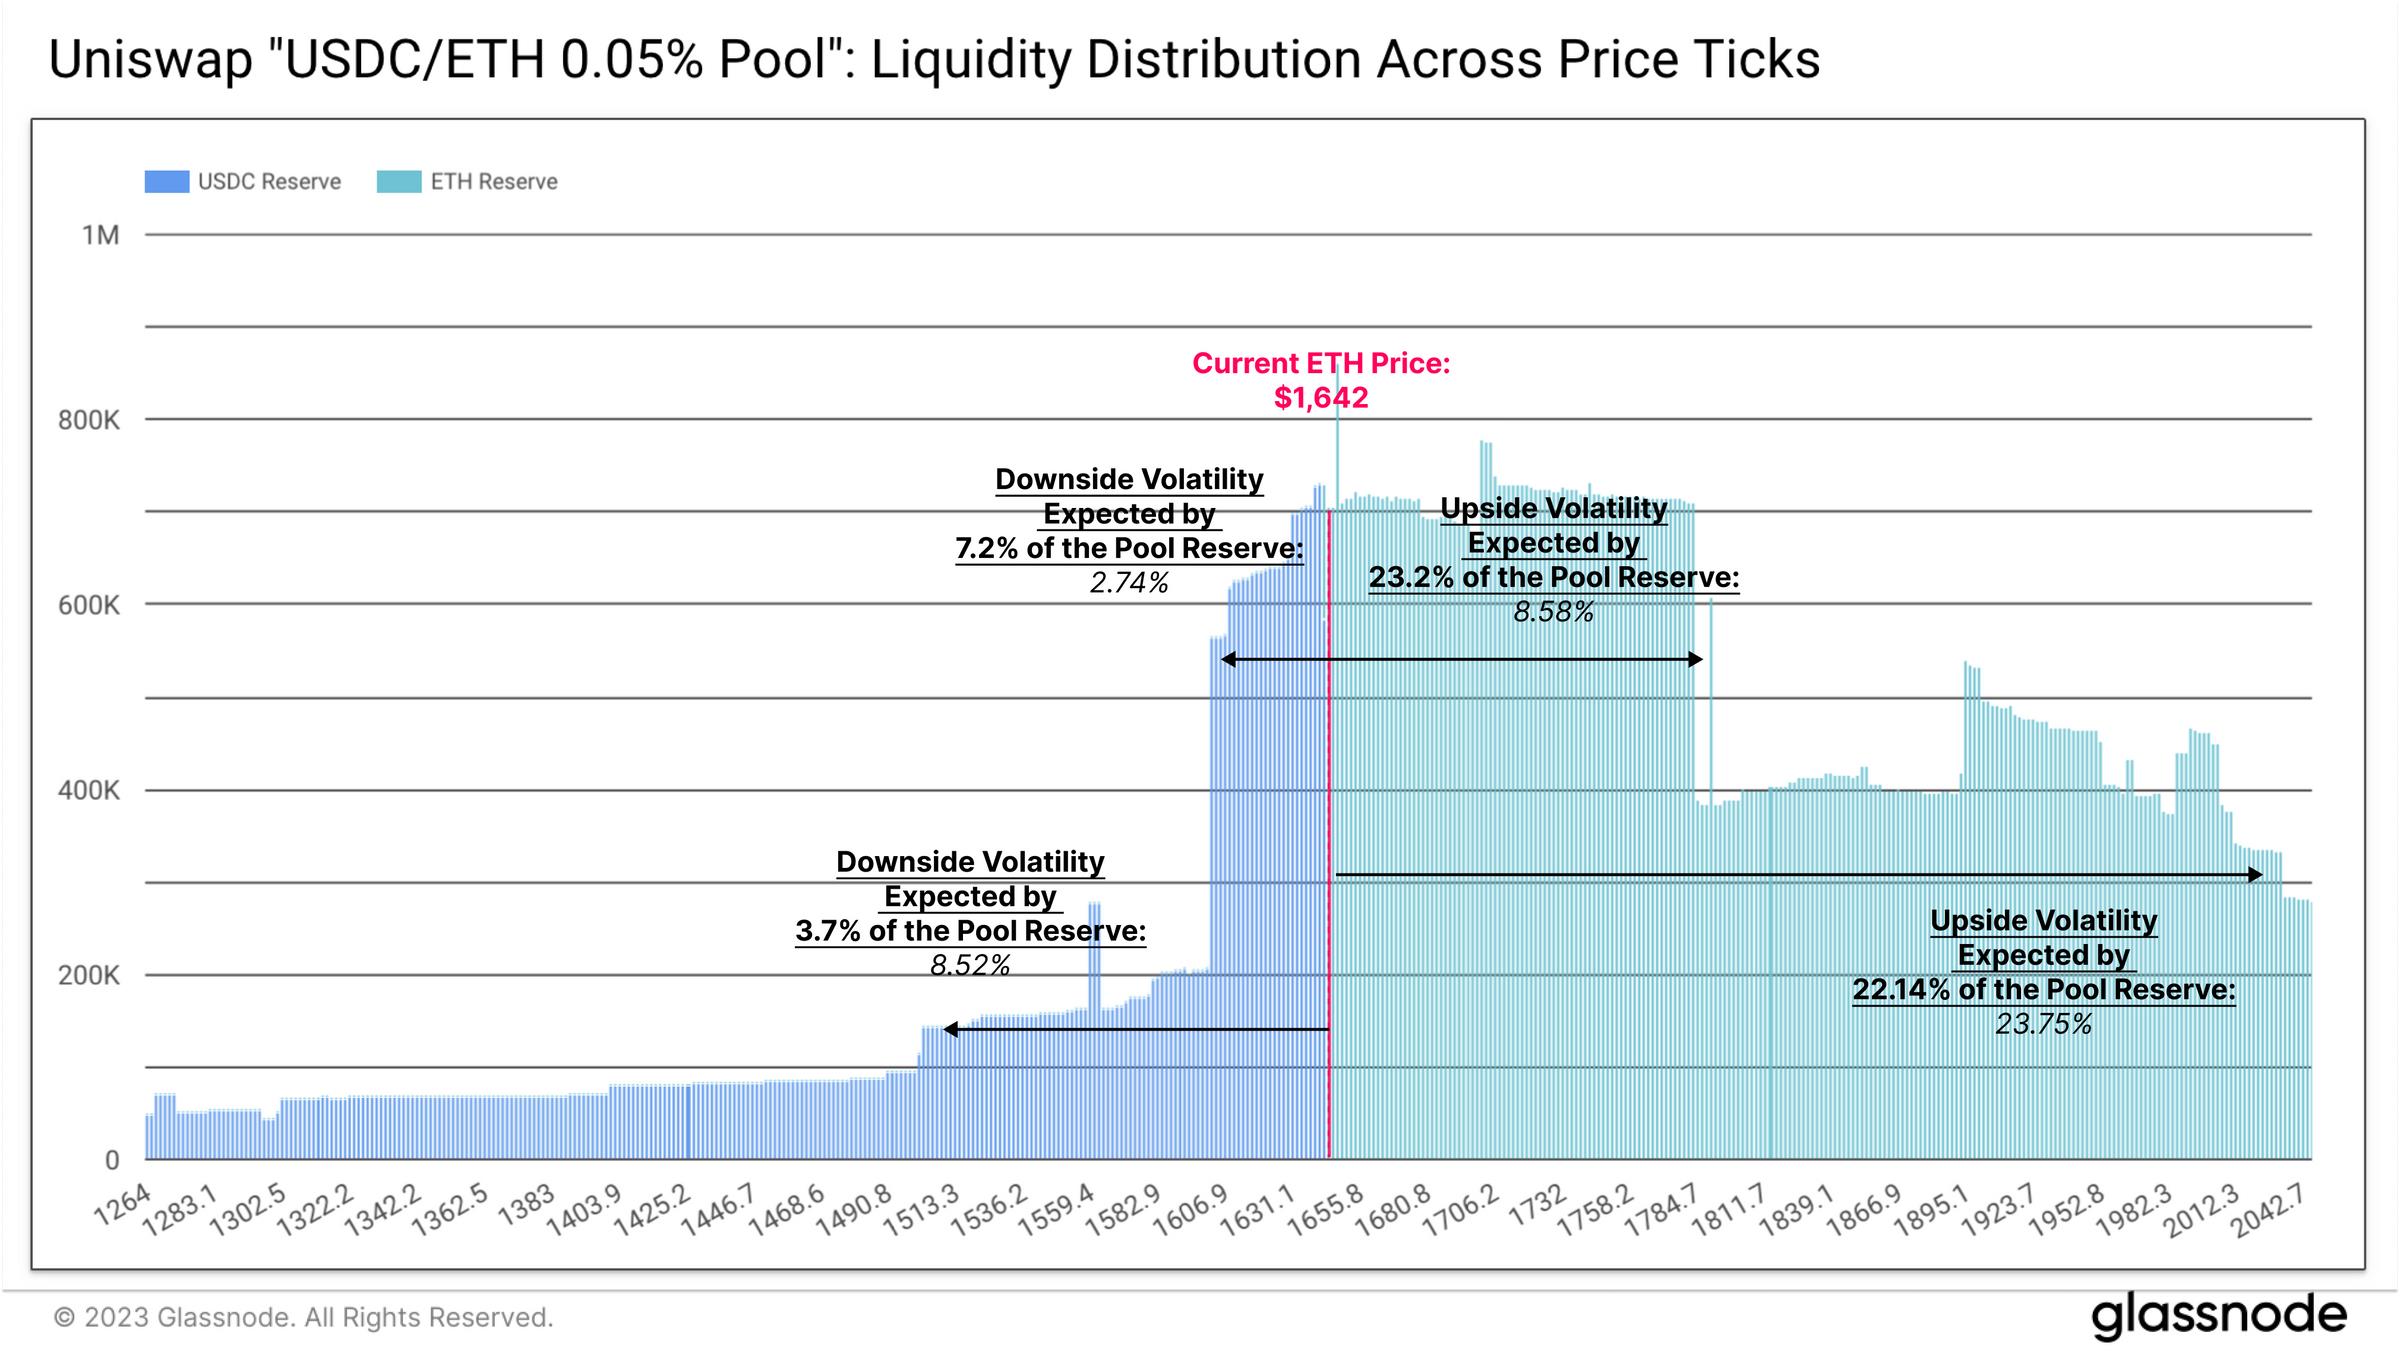
When we analyze the distribution of liquidity across different price ranges in the Uniswap pool, we see that currently, LPs have allocated the majority of liquidity above the current price.
The most concentrated liquidity (about 30.4% of total funds) lies within an 11% price range, implying a downside risk of -2.7% and upside potential of +8.6%. The second layer of liquidity spans a range with downside risk of -8.5% and upside potential of +23.7%. Clearly, Uniswap LPs are expressing an overall optimistic outlook and expectation of upward price movement for Ethereum.
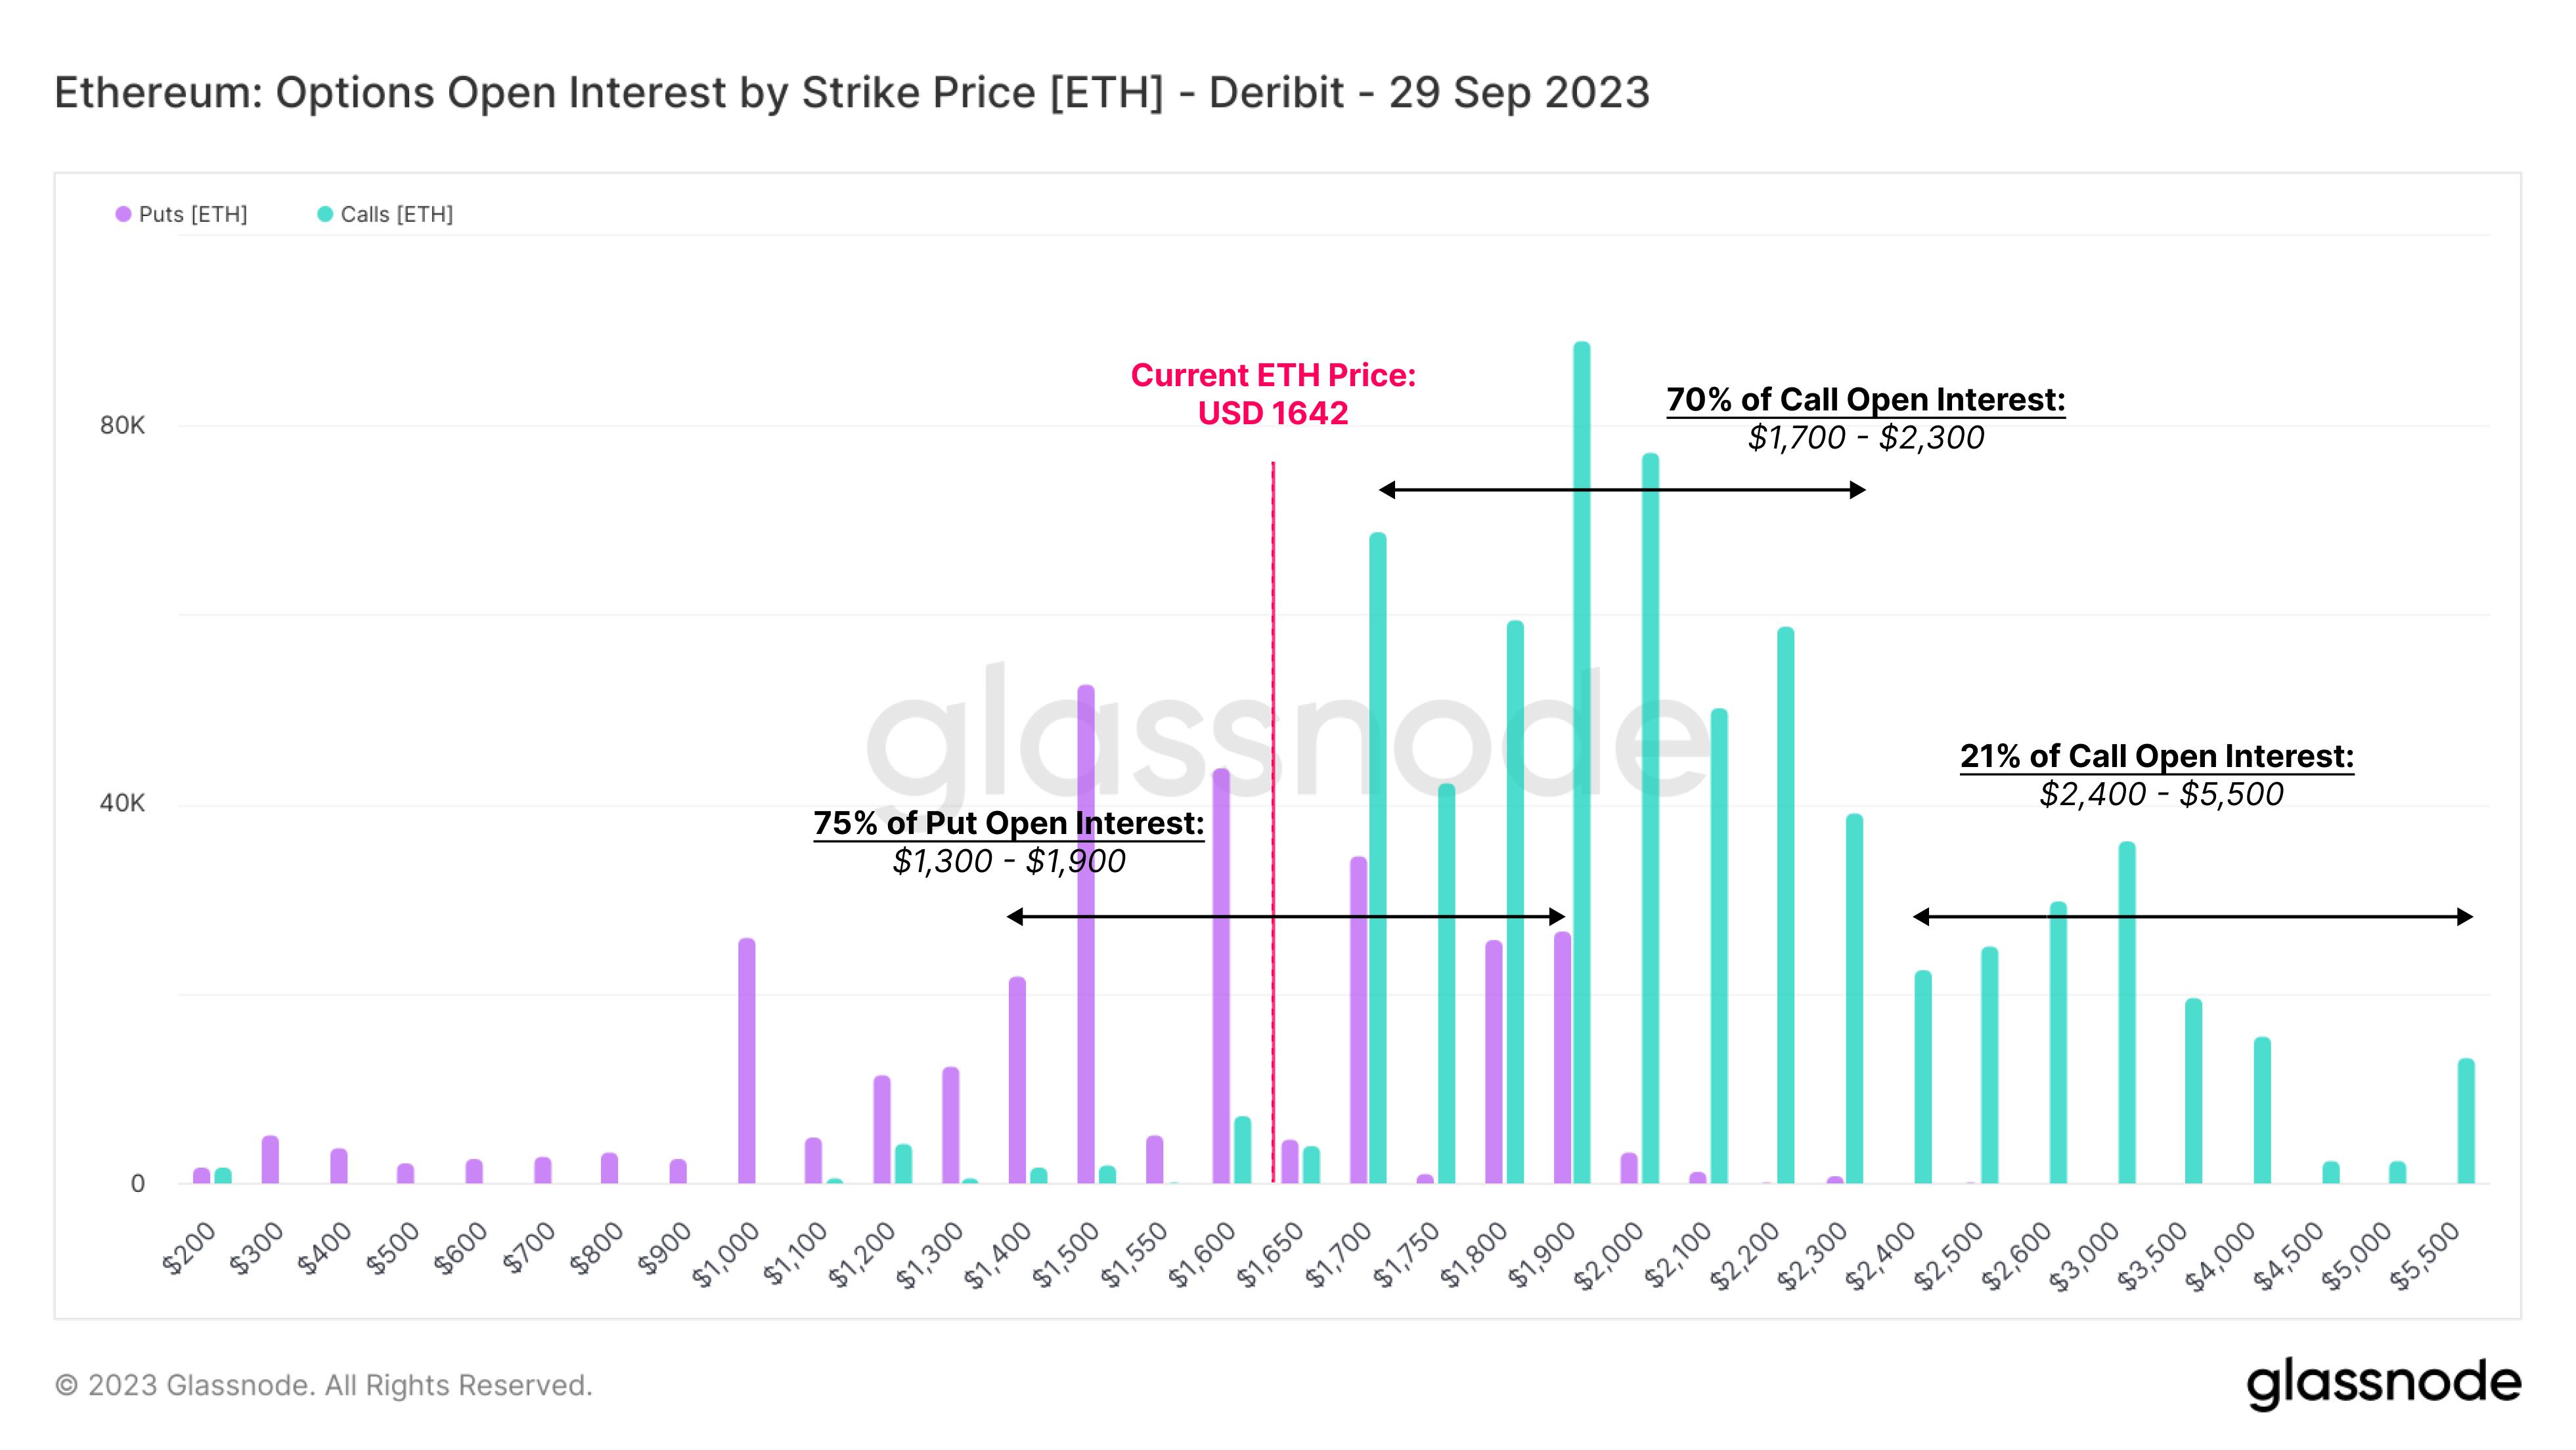
Comparing this with option strike prices expiring at the end of September, we see a similar positive outlook. 70% of call options have strike prices between $1.7k and $2.3k, while 75% of put options are concentrated between $1.3k and $1.9k. These levels align closely with the liquidity distribution in the Uniswap pool.
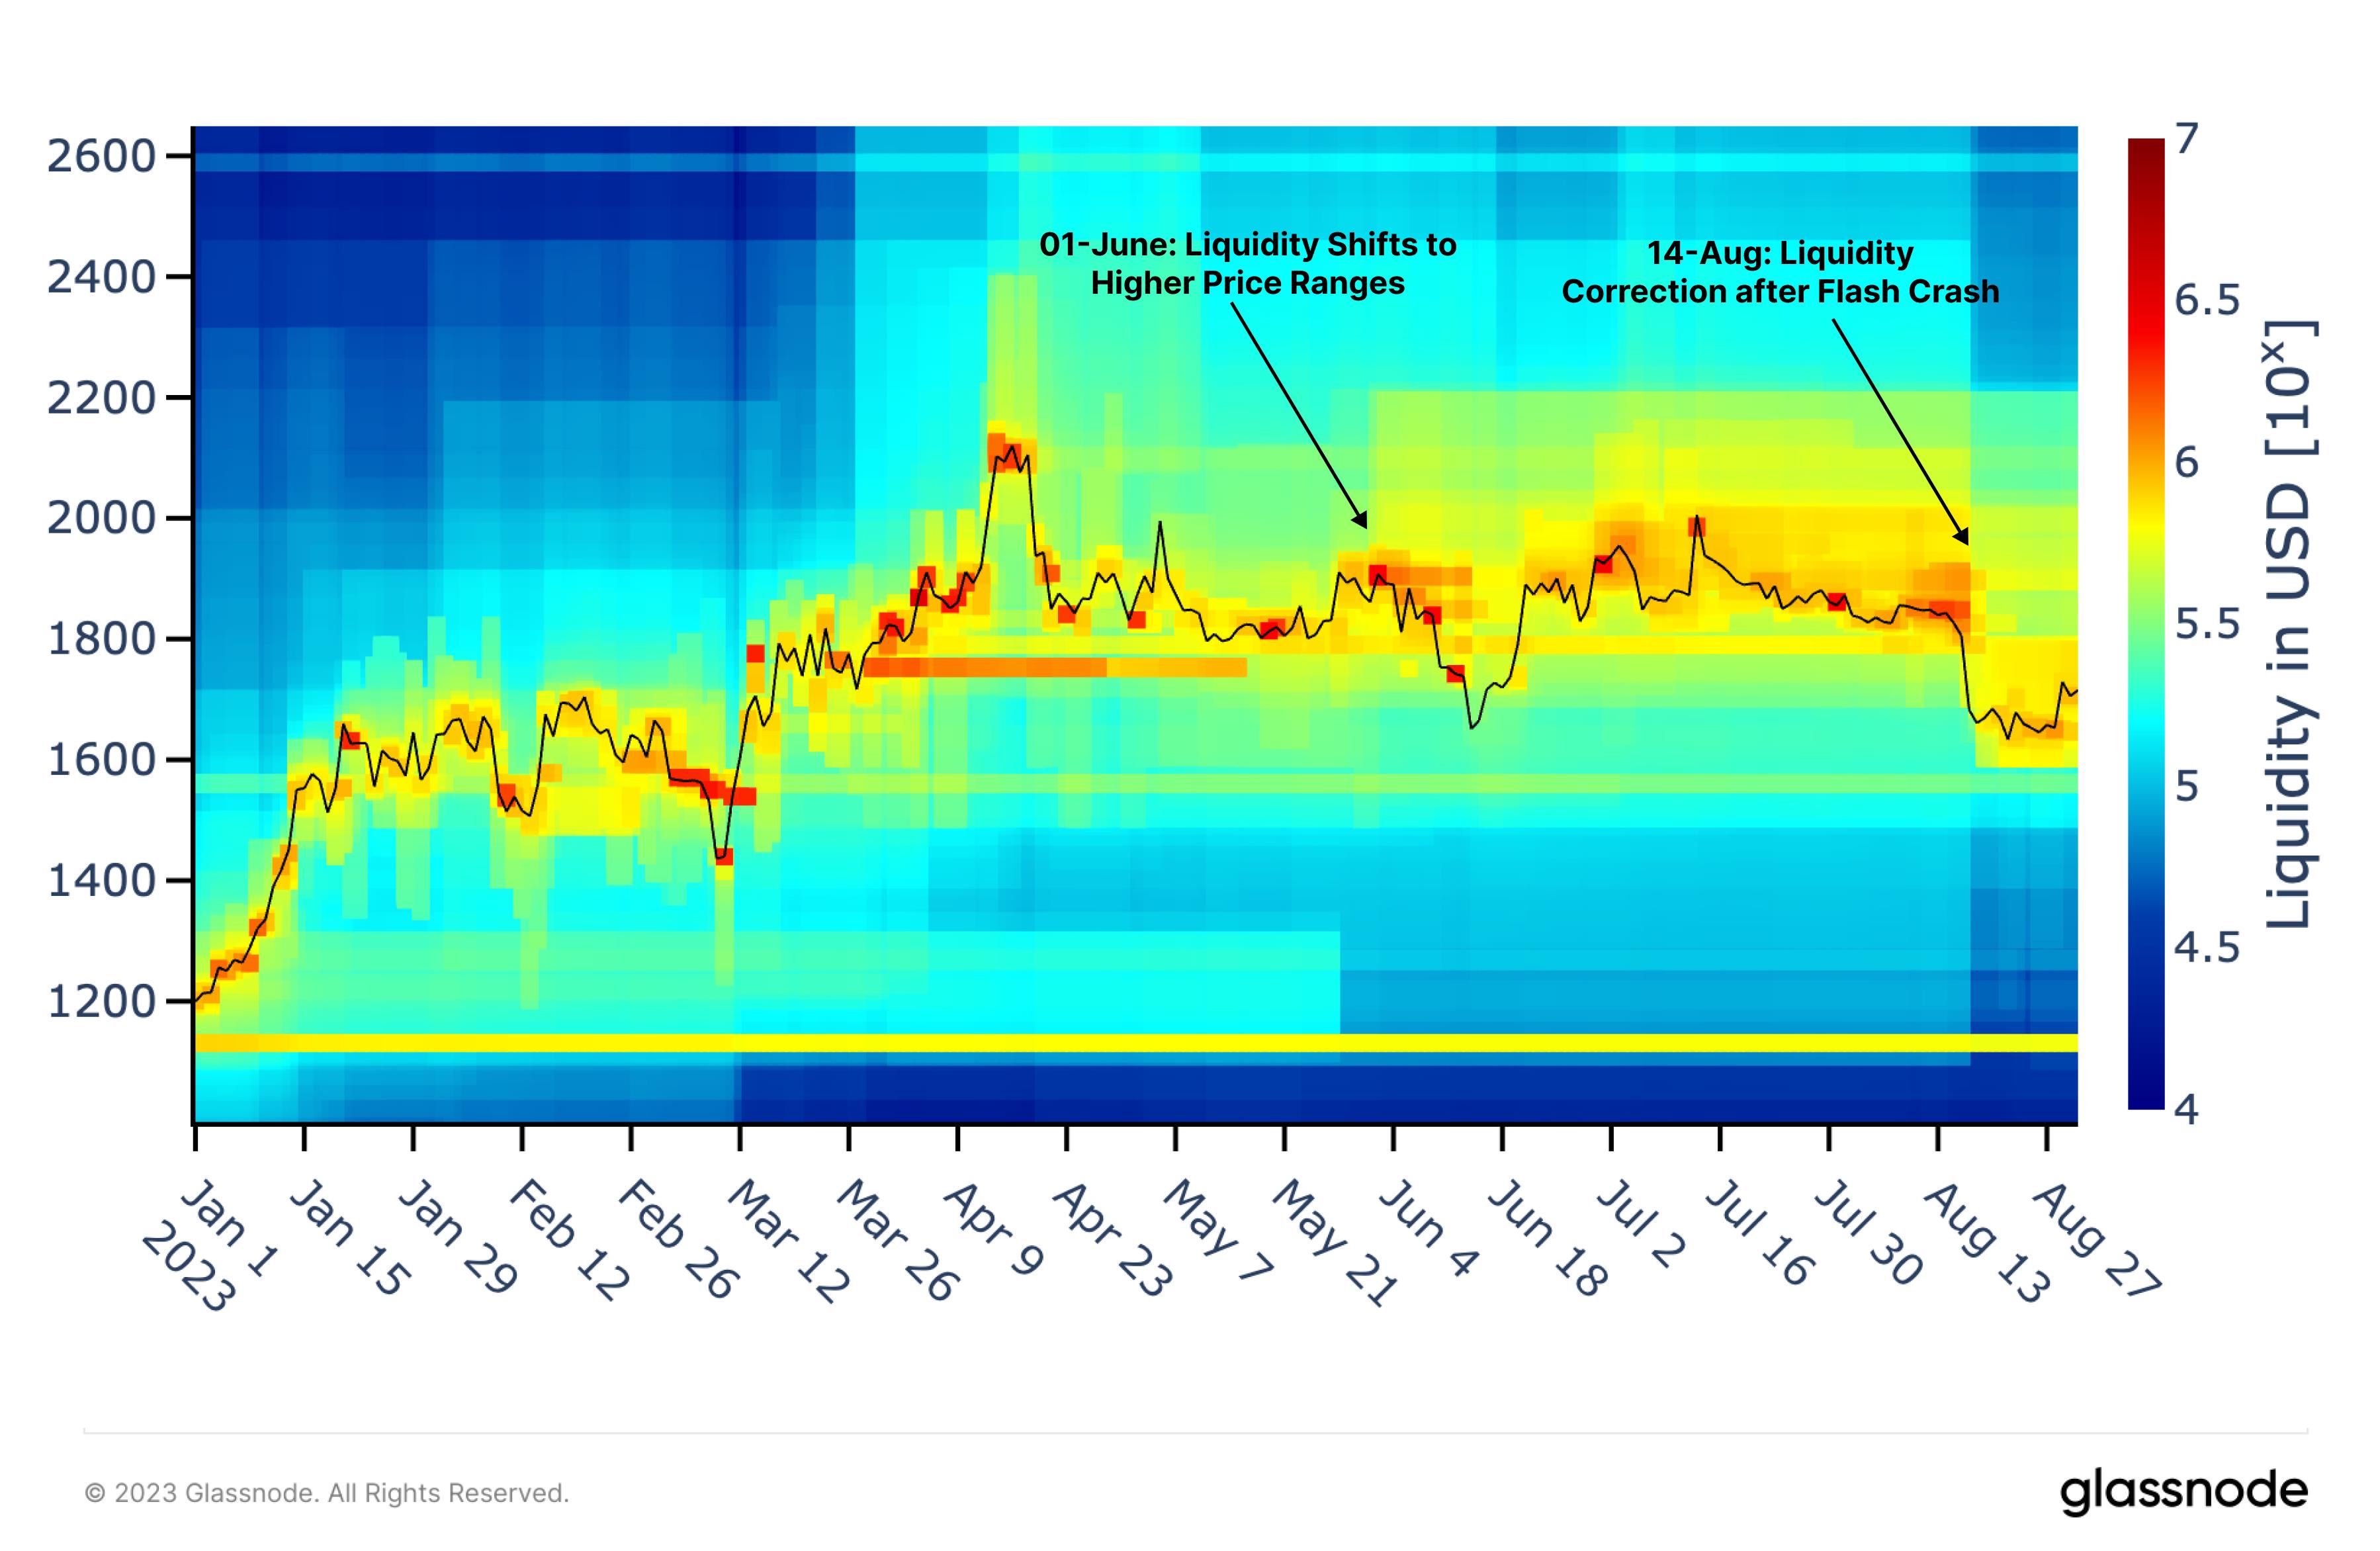
Returning to the USDC/ETH Uniswap pool, we can analyze how the concentration of liquidity has adjusted over time. The heatmap below illustrates liquidity density, with cooler to hotter colors indicating increasing concentration.
As automated liquidity provision strategies expand, LPs have successfully positioned liquidity very close to the spot price during periods of high volatility. On June 1, substantial liquidity was extended above the prevailing price (shown by deeper yellow areas), likely reflecting market makers’ anticipation of higher fee income in that zone. This concentration persisted until the August flash crash, after which liquidity was gradually shifted below $1.8k. The chart offers a clear view of LPs’ responsiveness to market events and volatility.
Interestingly, areas of high liquidity concentration (shown in red) coincide with strong price volatility and trend reversals. This observation suggests that Uniswap liquidity pools may serve as a valuable source of information for gauging market sentiment and positioning.
Conclusion
Optimism surrounding Grayscale’s victory over the SEC was short-lived, as Ethereum’s value quickly reverted to August lows within days. Spot markets continue to experience capital outflows, and liquidity in derivatives markets remains subdued. Overall, investors appear reluctant to re-enter the market, preferring instead to allocate capital toward higher-risk domains.
This article examined Uniswap liquidity pools to determine whether they offer pricing signals similar to options markets. Our analysis indicates that liquidity flows are highly sensitive to market events and that meaningful insights can be drawn from LPs’ implied volatility and price expectations.
Join TechFlow official community to stay tuned
Telegram:https://t.me/TechFlowDaily
X (Twitter):https://x.com/TechFlowPost
X (Twitter) EN:https://x.com/BlockFlow_News
 @glassnode