A Comprehensive Guide to the Six Most Common On-Chain Data Analysis Tools
TechFlow Selected TechFlow Selected
A Comprehensive Guide to the Six Most Common On-Chain Data Analysis Tools
With the emergence of a multi-chain landscape (including Layer 1 and Layer 2), on-chain data analysis will remain a massive market in the foreseeable future.
 Navigating Web3 tides with focused insights
Author: Madoka, IOBC Capital
In the recent FTX collapse, many analysts and researchers have attempted to gain a clearer understanding of the full picture by analyzing FTX’s and Alameda’s on-chain assets and their fund flows with other entities.
The evolution of Web2 has taught us that data has become one of the most important means of production.
On-chain data analysis has long been an indispensable tool within the blockchain industry. In the early days when public chains were limited, data analysis tools primarily focused on simple metrics such as the number of addresses, holdings, holding duration, and transaction counts on Bitcoin and Ethereum.
As numerous public chains emerged, DeFi matured, NFTs gained mainstream traction with explosive trading volumes, and on-chain social activities became richer, user demand for on-chain data analysis has increased significantly, along with growing complexity in analytical dimensions.
It is well known that on-chain data is public and transparent—everyone stands equal before this data. However, this does not mean everyone possesses the same level of insight; differences in data analysis capabilities lead to varying market understandings, ultimately resulting in different trading behaviors.
How to extract valuable insights from publicly available data is a question every trader in this space constantly considers. Both individual traders and large institutions increasingly rely on various analytical tools to inform their investment decisions.
In recent years, the on-chain data analytics sector has seen the emergence of several outstanding products, some achieving valuations of hundreds of millions or even billions of dollars in the primary investment market.
Below is a brief introduction to the business models and service offerings of six such platforms: Nansen, Glassnode, Token Terminal, Eigenphi, Dune Analytics, and Footprint Analytics.
Nansen
Nansen specializes in tracking on-chain activity and is best known for "labeling wallet addresses," particularly the famous "smart money" label. Smart money refers to wallets belonging to elite participants in the crypto world whose trading behavior often generates substantial returns, making them highly followed by other traders.
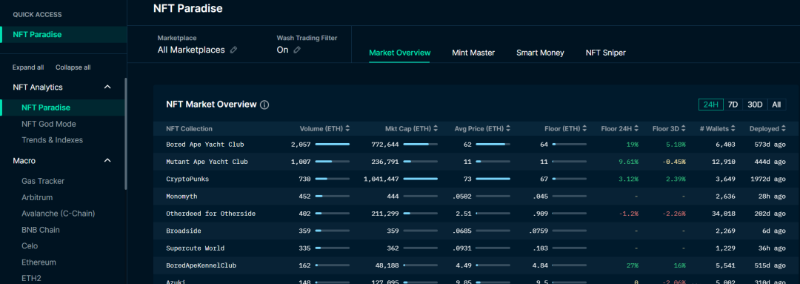
Nansen demonstrates strong rapid iteration capabilities—for example, quickly launching a series of NFT-related products such as NFT Paradise, NFT God Mode, and NFT Wallet Profiler following the rise of the NFT market.
【Key Features】
Main features offered by Nansen include portfolio tracking, smart alerts, and watchlists. On Nansen's homepage, users can view macro-level data across major blockchains, including DeFi, stablecoins, and basic NFT market metrics such as market cap, floor price, volume, sales, and holder counts for key NFT collections.
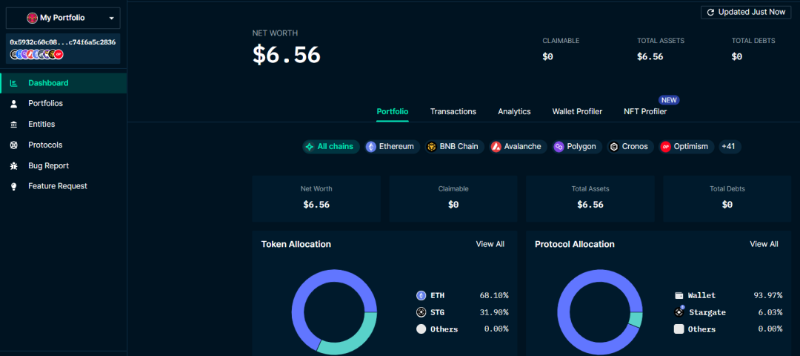
Portfolio: Users can log into Nansen using their wallet address and then view all assets, transaction history, and asset analysis associated with that wallet.
Smart Alerts: Nansen allows users to subscribe to smart alerts and receive notifications whenever tracked addresses perform on-chain activities.
Watchlist: Users can add wallet addresses to a watchlist to monitor their movements in real time.
Currently, Nansen offers limited free functionality, but most features require a paid subscription, which constitutes its primary revenue stream.
【Custom Data Support】
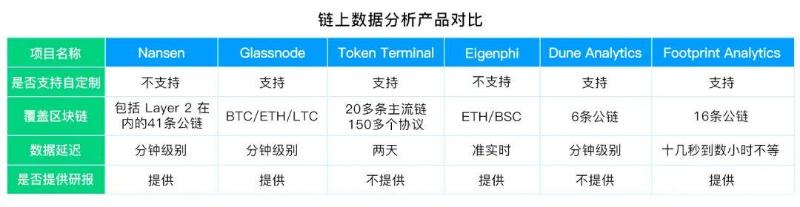
All data provided by Nansen is pre-processed and modeled by the platform, and custom data analysis is not supported. As Nansen primarily targets institutional investors requiring high-availability data, it delivers mostly finalized, ready-to-use datasets.
【Supported Blockchains】
Nansen supports data across 41 blockchains, including Layer 2 networks.
【Data Latency】
Minute-level delay.
【Research Reports】
Nansen has an analyst team of 18 members who publish research reports via the Nansen Research section of the website, covering topics such as L1/L2, NFTs, gaming, DeFi, and macro trends.
Glassnode
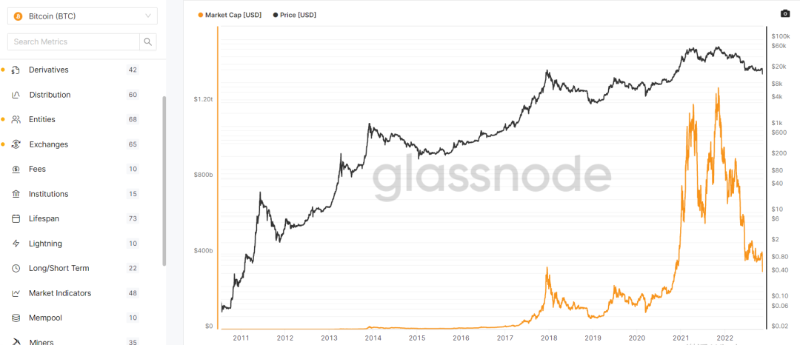
Glassnode primarily provides on-chain data for Bitcoin, Ethereum, DeFi tokens, exchange tokens, and some stablecoins. Its distinguishing feature is vertical focus—concentrating exclusively on BTC, ETH, and LTC chains—while offering a wide range of rich metrics, especially for Bitcoin, helping users assess the current position within the crypto market cycle.
【Key Features】
Provides various modeled data metrics—including addresses, token distribution, holder categories, fees, derivatives rates and leverage, exchange inflows/outflows, miner activity, market sentiment, profit/loss ratios, supply dynamics, and transaction counts—to help users comprehensively analyze market positioning and make informed trading decisions.
【Custom Data Support】
Most of the data provided by Glassnode consists of official modeled analytics. However, its Dashboard and Workbench modules now allow users to define custom metrics and generate charts based on their own requirements.
【Supported Blockchains】
Glassnode focuses on data from BTC, ETH, and LTC chains, covering these native coins as well as major ERC-20 tokens, stablecoins, leading DeFi tokens, and exchange tokens.
【Data Latency】
Minute-level delay.
【Research Reports】
Glassnode Insights offers a variety of research reports. True to its data focus, the reports emphasize macro-cycle analysis, publishing weekly series on on-chain conditions, along with research on Ethereum and DeFi developments.
Token Terminal
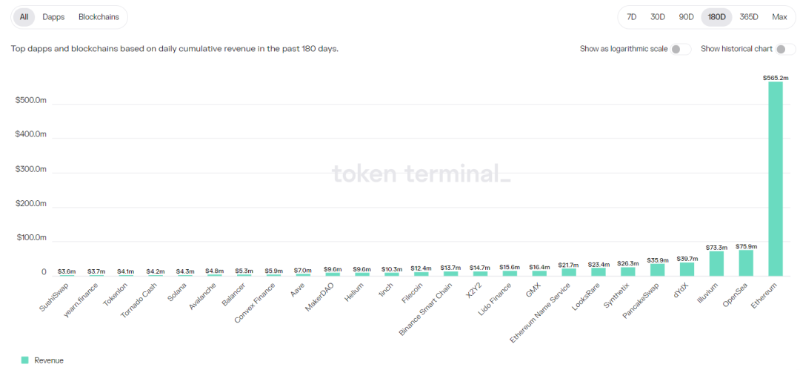
Token Terminal focuses on revenue metrics for on-chain projects, including total revenue, fees, TVL (Total Value Locked), and derived valuation multiples such as price-to-sales and price-to-earnings ratios. It provides reliable reference data for valuing crypto projects using traditional company valuation frameworks.
【Key Features】
Token Terminal primarily offers income data charts for numerous on-chain protocols, as well as data for major exchanges and leading blockchains.
【Custom Data Support】
Token Terminal currently supports downloading all data charts and provides API access, enabling users to build their own visualizations using the data.
【Supported Blockchains】
Currently supports data queries across more than 20 major blockchains and over 150 protocols.
【Data Latency】
Two days. Since the analysis mainly involves revenue data aggregated on a daily basis, the latency is relatively longer.
【Research Reports】
Does not currently offer research reports.
Eigenphi
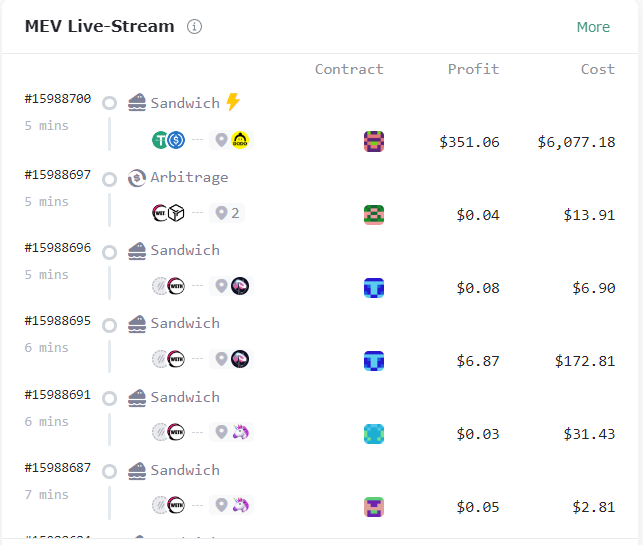
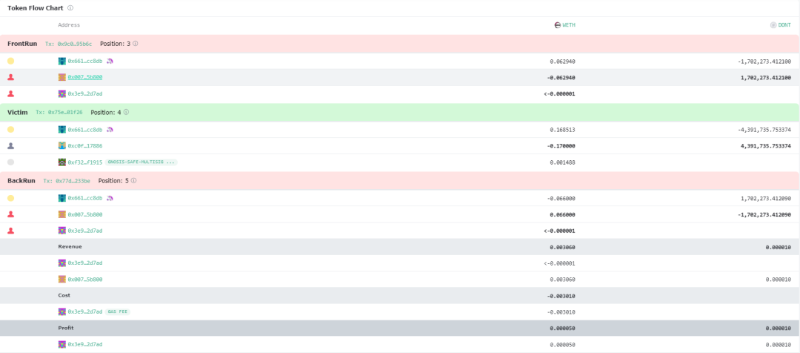
Eigenphi is an analytics tool primarily designed to analyze MEV (Maximal Extractable Value) activities within DeFi. Its standout feature is providing real-time token flow tracking, filtering out redundant information, and connecting fragmented transactions across multiple DeFi protocols to help users identify trading strategies.
【Key Features】
Eigenphi offers sandwich attack monitoring, lending and real-time liquidation tracking, flash loan behavior monitoring, and real-time MEV token flow visualization. It also provides tools to monitor the most popular liquidity pools, trending tokens, and potentially malicious tokens.
【Custom Data Support】
Does not currently support user-defined data analysis.
【Supported Blockchains】
Primarily supports Ethereum, with partial coverage on BSC. This is due to Ethereum’s more mature DeFi infrastructure and richer MEV arbitrage opportunities.
【Data Latency】
Near real-time.
【Research Reports】
Research is a newly launched feature offering DeFi-related reports.
Dune Analytics
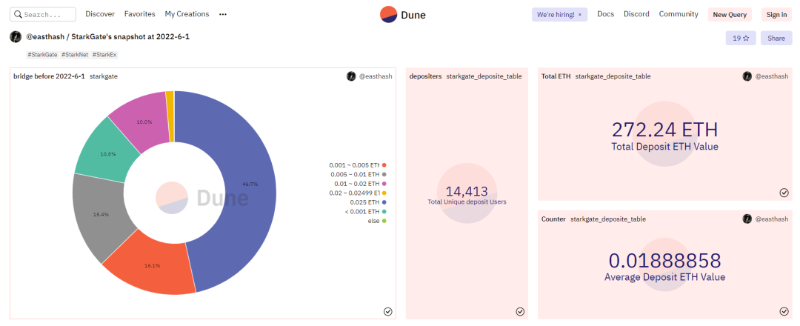
Dune’s key differentiator is its open UGC (user-generated content) community model. It exposes raw on-chain data to users, allowing them to write SQL queries for custom analysis and publish personalized dashboards for others to view. However, this requires a certain level of coding proficiency, posing a barrier to entry for non-technical users.
【Key Features】
Provides raw on-chain data across multiple chains, enabling users to conduct custom analyses using SQL and publish their findings.
Also offers Abstraction to project teams, allowing them to process their own protocol data and create customized analytics dashboards for their communities.
【Custom Data Support】
Yes. All displayed data is user-defined.
【Supported Blockchains】
Supports data from Ethereum, BSC, Optimism, Polygon, Gnosis Chain, and Solana.
【Data Latency】
Minute-level delay.
【Research Reports】
Not currently offered.
Footprint Analytics
Footprint shares similarities with Dune but also differs in key aspects. Like Dune, it opens data to users and supports custom dashboard creation. However, Footprint provides both raw on-chain data and processed, more user-friendly datasets.
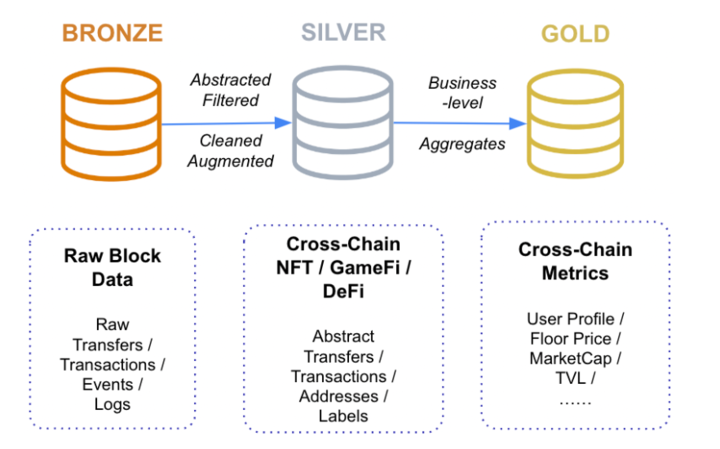
Footprint categorizes data into three tiers: Bronze, Silver, and Gold. Bronze-level data includes unprocessed raw transactions, transfers, events, and logs. Silver-level data covers NFT, GameFi, and DeFi metrics across multiple chains, with extracted and labeled transactions and addresses. Gold-level data consists of aggregated business-level metrics such as user profiles, market capitalization, and TVL, ready for direct use.
Footprint also provides simple charting tools that allow users to build custom dashboards without writing code.
【Key Features】
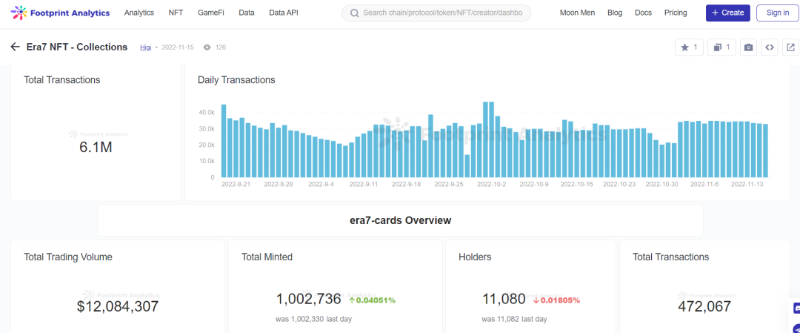
Offers both raw and processed data along with intuitive charting tools, enabling users to create and share custom analytics dashboards.
【Custom Data Support】
Yes. Supports both user-created dashboards and official ones.
【Supported Blockchains】
Supports data from 16 blockchains: Ethereum, BSC, Polygon, Fantom, Hive, Avalanche, Arbitrum, Harmony, Boba, Celo, DFK, HSC, IoTeX, Moonbeam, Moonriver, and ThunderCore.
【Data Latency】
Varies from tens of seconds to several hours depending on data type.
【Research Reports】
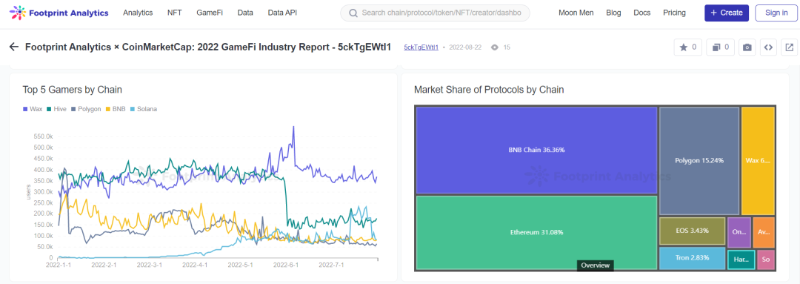
Collaborates with CoinMarketCap to publish industry reports, particularly in the GameFi sector.
Comparison
Conclusion
With the emergence of a multi-chain landscape—including both Layer 1 and Layer 2 solutions—the on-chain data analytics space represents a massive opportunity with significant room for growth in both depth and breadth in the foreseeable future.
Current on-chain analytics products each focus on specific niches, showing a trend toward vertical specialization. While several market leaders have already emerged, there remains potential for new entrants to break through by identifying the right niche.
Since blockchain data is fully public and transparent, unlike Web2 companies, these tools lack data moats. Therefore, they must continuously refine their products, iterate rapidly, and deliver more and better metrics to attract and retain users.
This sector holds immense potential and offers substantial value to traders. We remain highly optimistic about its future development.
Join TechFlow official community to stay tuned
Telegram:https://t.me/TechFlowDaily
X (Twitter):https://x.com/TechFlowPost
X (Twitter) EN:https://x.com/BlockFlow_News
 @iobc_capital