A Review of the Three-Year Crypto Bull Market with 50 Million Data Points: What Can We Learn?
TechFlow Selected TechFlow Selected
A Review of the Three-Year Crypto Bull Market with 50 Million Data Points: What Can We Learn?
Conduct a comprehensive review of this entire bull market cycle, uncover patterns through massive data mining, and learn from history.
By @LUCIDA
Since 2020, the entire cryptocurrency market has experienced a massive bull run, during which assets across many sectors and trends saw enormous gains—some even achieving thousand-fold or ten-thousand-fold returns.
LUCIDA is a crypto-focused quantitative hedge fund. As the market gradually turns bearish, we will conduct a comprehensive review of this entire bull cycle by mining vast amounts of data to uncover market patterns and learn from history. LUCIDA will release a series of research reports; this article is the first in the series: "Analyzing Three Years of Bull Market with 5 Million Rows of Data."
Data Collection and Preprocessing
The first step was data collection. We gathered historical data for the top 3,000 cryptocurrencies by market cap from CoinMarketCap, totaling over 5 million rows.
Data for the top 3,000 cryptocurrencies by market cap
Each cryptocurrency has seven columns: Date, Open (opening price), High (highest price), Low (lowest price), Close (closing price), Volume (trading volume), and MarketCap (market capitalization).
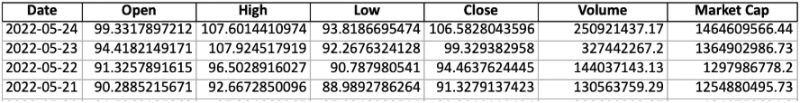
Columns for each cryptocurrency
For subsequent analysis, we performed the following data preprocessing steps:
● Correcting outliers and filling missing values
● Removing stablecoin assets
● Removing pegged assets such as wBTC and renBTC
● Removing assets that were heavily spiked due to poor order book depth
● Removing coins with very low market cap and poor liquidity (mostly those ranked beyond #1,000)
● NFT assets were not included in the statistics
Ultimately, 952 cryptocurrencies met our criteria for analysis.
Highest Gain: 960,000x!
We analyzed the period from January 1, 2020, to May 24, 2022, identifying the top 100 performing cryptocurrencies. The results are shown below:
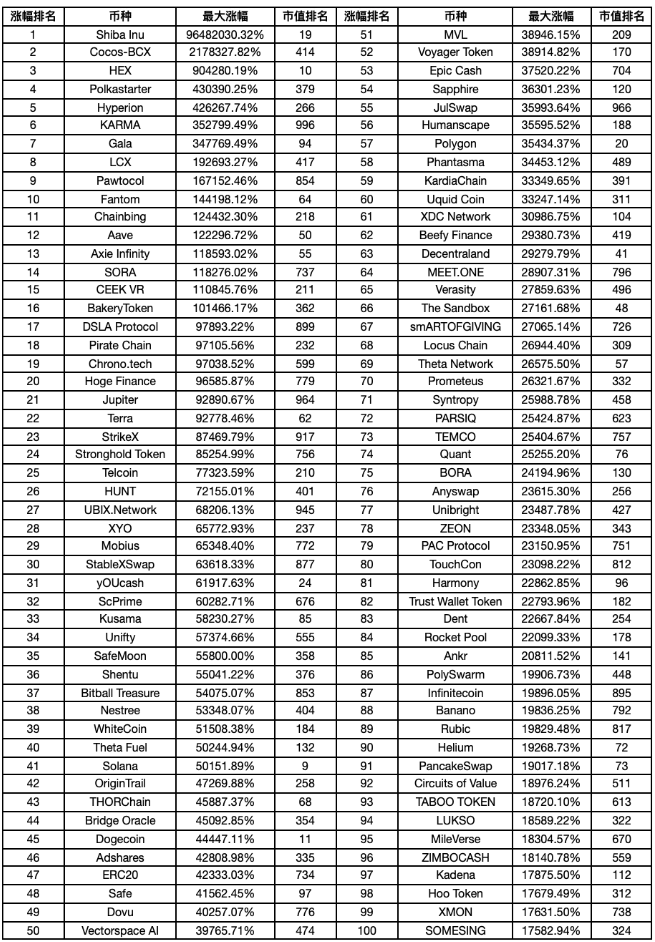
Top 100 cryptocurrencies with the highest gains in this bull market
Shiba Inu achieved the highest return at 96,482,030.32% (yes, 960,000x), currently ranked 19th by market cap.
Bull Market ≠ Easy Alpha: Picking Random Coins Won’t Beat the Market
We calculated the median maximum gain at 2002.23%.
Using BTC as a benchmark index, the β return was 1259.27%. Comparing this to the median α return of 2002.23%, the β return did not underperform significantly.
Therefore, the common belief—"In a bull market, any coin will outperform the market"—may be misleading. The data suggests that when investing in smaller-cap coins, careful selection and timing are essential. Poor coin selection or mistimed entries could result in lower returns than simply holding BTC.
Don’t Know How to Time Small-Cap Coins? Follow Bitcoin’s Lead
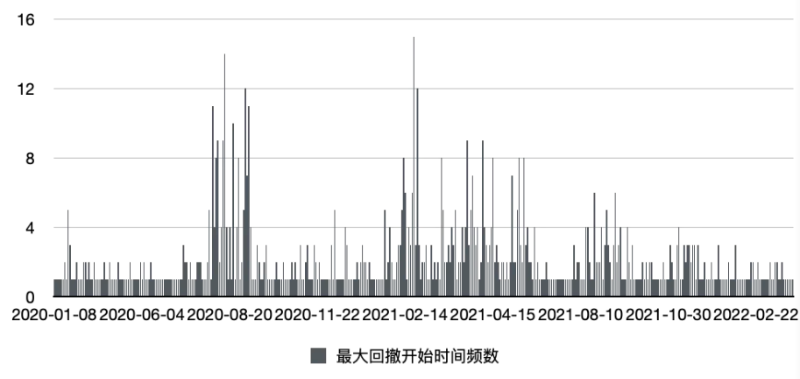
Next, we analyzed the “start time,” “end time,” and “duration” of maximum gains across all coins—essentially addressing the issue of timing small-cap investments: “When to buy the dip?” and “When to take profits?”
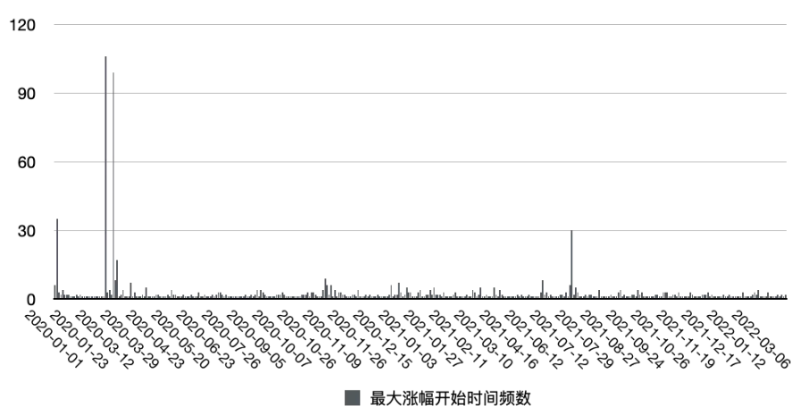
The above chart shows the frequency distribution of “start times” for maximum gains (x-axis: time, y-axis: frequency). The bars indicate when these coins hit their lows. Most bottomed out around March 2020 (“312 crash”) and July 2021 (“519 crash”).
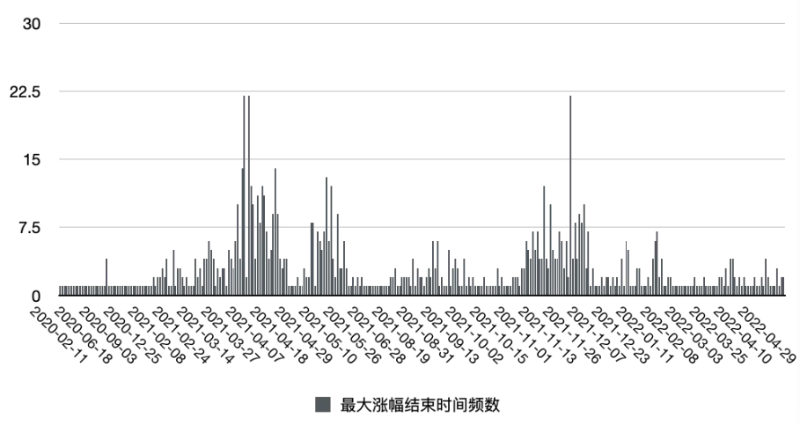
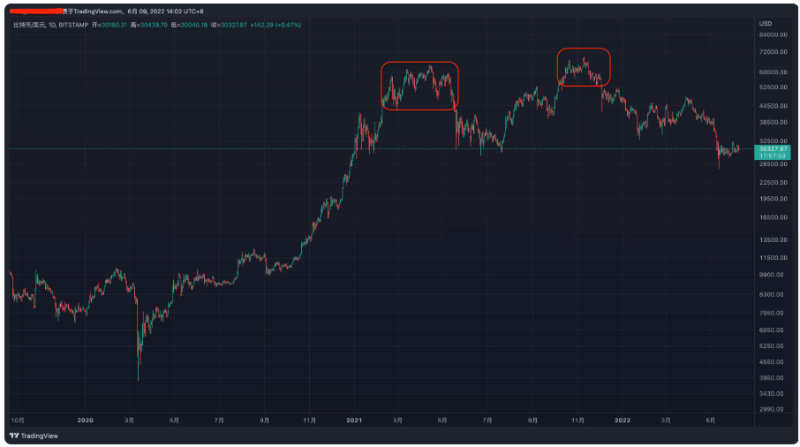
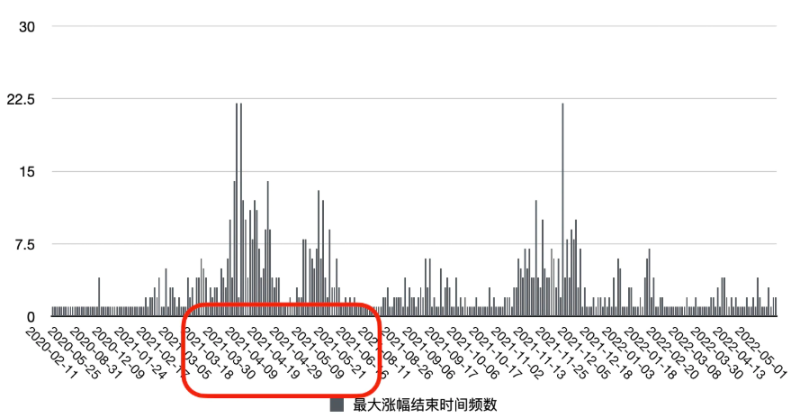
The second chart shows the frequency of “end times” for maximum gains. Most peaks occurred in April 2021 and November 2021—aligning closely with Bitcoin’s own price tops.
Statistically speaking, few small-cap coins move independently. Most follow Bitcoin’s lead. If you’re uncertain about timing small-cap coins, it's safer to align your trades with Bitcoin’s trend.
Time Is the True Friend of High Returns
We then analyzed the time interval between the lowest and highest prices during each coin’s maximum gain phase, plotting the frequency distribution.
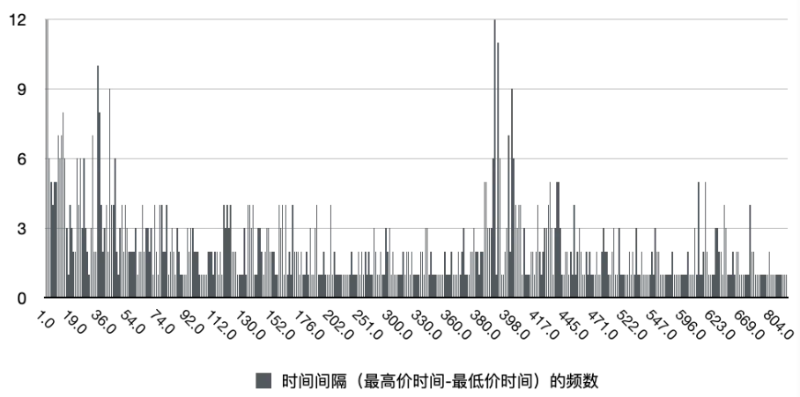
The histogram shows two clear peaks: within 20 days and around 400 days. This implies that price tops generally fall into two categories:
1. Peak at launch
2. Peak after about one year
If you aim to capture high returns in a bull market, holding long-term (over one year) may be the optimal strategy.
Even in a Bull Market, Prepare for 50% Drawdowns—or Being Stuck for a Year
After analyzing returns, let’s examine risk.
We calculated maximum drawdowns—specifically, the largest pullbacks occurring *during* the upward trend (not in bear markets).
The average and median maximum drawdowns were 50.63% and 57.02%, respectively. Even in a bull market, expect potential 50%+ losses and endure significant paper losses.
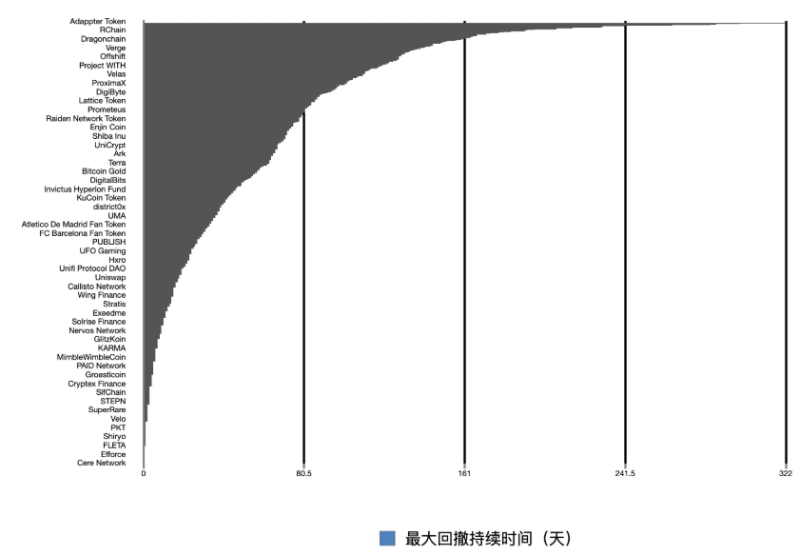
The median duration of maximum drawdowns was 31 days, averaging 43 days, with the longest lasting 322 days. On average, you might be stuck underwater for over a month—and possibly up to a year—even in a bull market.
When Bitcoin Consolidates at High Levels or Shows Weak Momentum, It’s Time to Buy Small Caps Low or Reduce Exposure
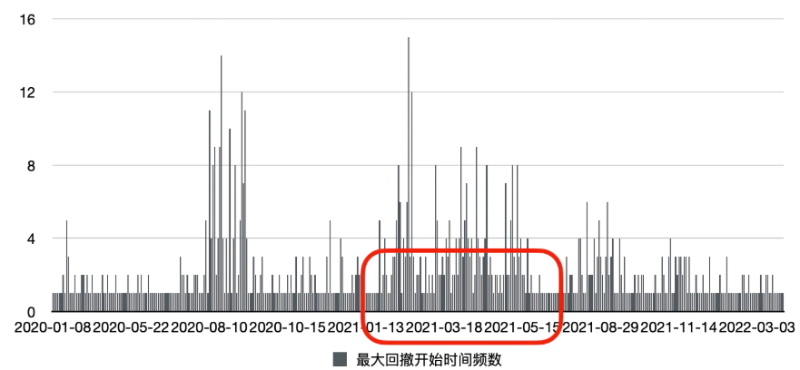
Next, we examined when maximum drawdowns typically occur.
The chart below shows the frequency of start times for maximum drawdowns, with two clear peaks in August 2020 and February–April 2021.
During these periods, Bitcoin (the index) showed sideways movement or high-level stagnation. When Bitcoin consolidates at elevated prices during a bull market, small-cap coins often experience significant corrections—due to their higher volatility.
New Highs After Sharp Volatility at Peaks May Be a Bear Market’s Last Gasp—Get Ready to Exit
A large drawdown doesn’t necessarily signal the end of a bull market. As previously noted, the first major peak ended in April 2021—about two months after the concentrated drawdowns in February 2021.
Therefore, sharp declines among small-cap coins at high levels are usually a warning sign of an impending top. Even if prices surge to new highs afterward, it’s more likely a trap than a genuine opportunity.
Conclusion
Through data analysis, we broadly examined this three-year bull market from both return and risk perspectives. Some findings confirmed existing beliefs, while others challenged assumptions or provided new insights. Data offers a more objective and higher-dimensional view of the market.
This article provides a high-level overview. Beyond this, TechFlow will publish deeper research reports on this bull market from the angles of “secondary market investment” and “data analytics,” including but not limited to:
● Sector analysis (infrastructure, NFTs, DeFi, SocialFi, GameFi, DAOs, and sector rotation patterns)
● Ecosystem analysis (Ethereum, Polkadot, Solana, etc.)
● Small-cap investment strategies (multi-factor coin selection, timing strategies, enhancement strategies, hedging strategies)
● Performance analysis of investment firms
Join TechFlow official community to stay tuned
Telegram:https://t.me/TechFlowDaily
X (Twitter):https://x.com/TechFlowPost
X (Twitter) EN:https://x.com/BlockFlow_News