Bitget Wallet Research Institute | A Comprehensive Overview of the Tokenized Stock Market Behind the $5.5 Billion Trading Volume
TechFlow Selected TechFlow Selected
Bitget Wallet Research Institute | A Comprehensive Overview of the Tokenized Stock Market Behind the $5.5 Billion Trading Volume
Tokenized stocks have passed the proof-of-concept stage, but remain far from forming an independent market.
Author: Bitget Wallet Research Institute
Full English PDF report: https://cdn.bitkeep.vip/operation/RWA_tokenized_stocks_report.pdf
Introduction
How far has tokenized stock progressed? Ultimately, the answer lies in data—not narratives.
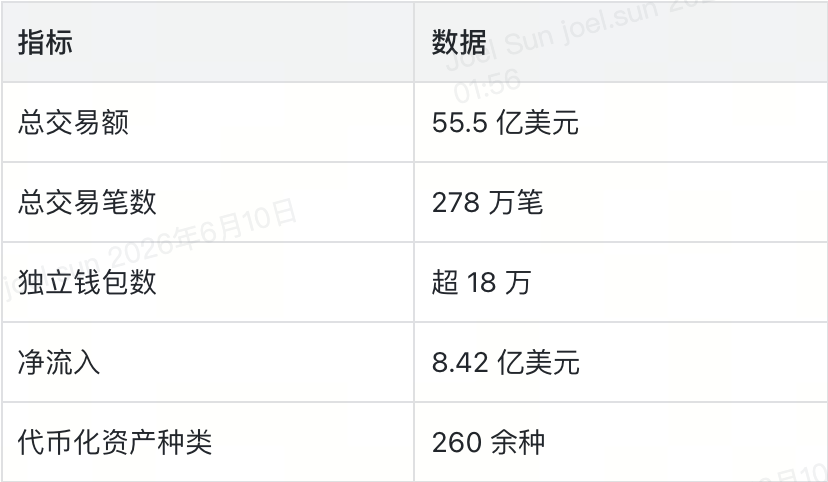
Ondo Global Markets is currently the world’s largest tokenized stock platform—and the first to surpass $1 billion in TVL. As of May 2026, it had processed $5.5 billion in trading volume across 2.8 million transactions and over 180,000 unique wallets. Based solely on these figures, one basic conclusion stands: tokenized stocks are no longer a “proof-of-concept”—they have become a live, functioning market.
But what does this market actually look like? Who uses it? How do they use it? And how does it relate to traditional equity markets? Leveraging on-chain data from Ondo Global Markets, Bitget Wallet attempts to paint a relatively comprehensive picture.
About the Data: This report draws on the Ondo Global Markets Trading Analytics dashboard on Dune, covering Ethereum and BNB Chain. The data cutoff date is May 12, 2026. Activity on Solana and HyperEVM was excluded due to lack of decoding tables on Dune at the time of analysis.
Key Observations
- Markets run 24/7 on-chain—but users still follow Wall Street’s clock. Approximately 99% of trading volume occurs Monday–Friday, with over half concentrated during U.S. trading hours. Weekend volume accounts for just 0.55%. Tokenized stocks today function more as an “asynchronous access layer” to U.S. equities—not as an independent 24/7 market.
- Retail investors are actively participating—but price-setting power remains with whales. Orders under $500 account for nearly 64% of transaction count but only 5% of total volume. Conversely, orders above $50,000 represent just 0.5% of transaction count yet capture 35.3% of volume. Retail drives market participation; large capital provides depth—a structure mirroring traditional finance.
- AI is the first thematic sector meaningfully priced on-chain. AI-related tokenized stocks account for ~35–40% of recent trading volume. NVDAon leads in liquidity—yet even more telling is the stronger net inflow into supply-chain and infrastructure names like Micron, Qualcomm, and Snowflake than into NVIDIA itself. Users aren’t betting on a single AI leader—they’re allocating across the full AI value chain.
- Beyond tech stocks, demand is emerging for ETFs and commodities. Common stocks dominate (72.5% of volume), but silver and gold ETFs achieve comparable user reach. SLVon—the most widely held asset on BNB Chain (nearly 20,000 wallets)—demonstrates strong demand for hard-asset exposure, often inaccessible or costly via local brokerages.
- Ethereum and BNB Chain host two fundamentally distinct markets. BNB Chain contributes 75.6% of volume and ~168,000 wallets—making it the hub of activity and volume. Ethereum’s average order size and per-wallet volume exceed BNB Chain’s by over 2.5x—suggesting it serves higher-net-worth users as a “holding layer.” Behavior for the same tokenized stock can diverge sharply across chains.
A $5.5 Billion On-Chain U.S. Equity Market
RWA’s earliest use cases targeted institutional infrastructure—tokenized Treasuries, money market funds, collateral management, and settlement optimization. Tokenized stocks differ: they serve retail users. Stocks and ETFs are among the world’s most familiar financial assets—deeply integrated with market data, news, and social discourse.
According to RWA.xyz, the on-chain distribution market cap of tokenized stocks exceeds $1.4 billion, monthly transfer volume approaches $3 billion, monthly active addresses near 100,000, and holders exceed 250,000. In traditional equity terms, this scale remains small—but on-chain, it supports granular behavioral analysis.
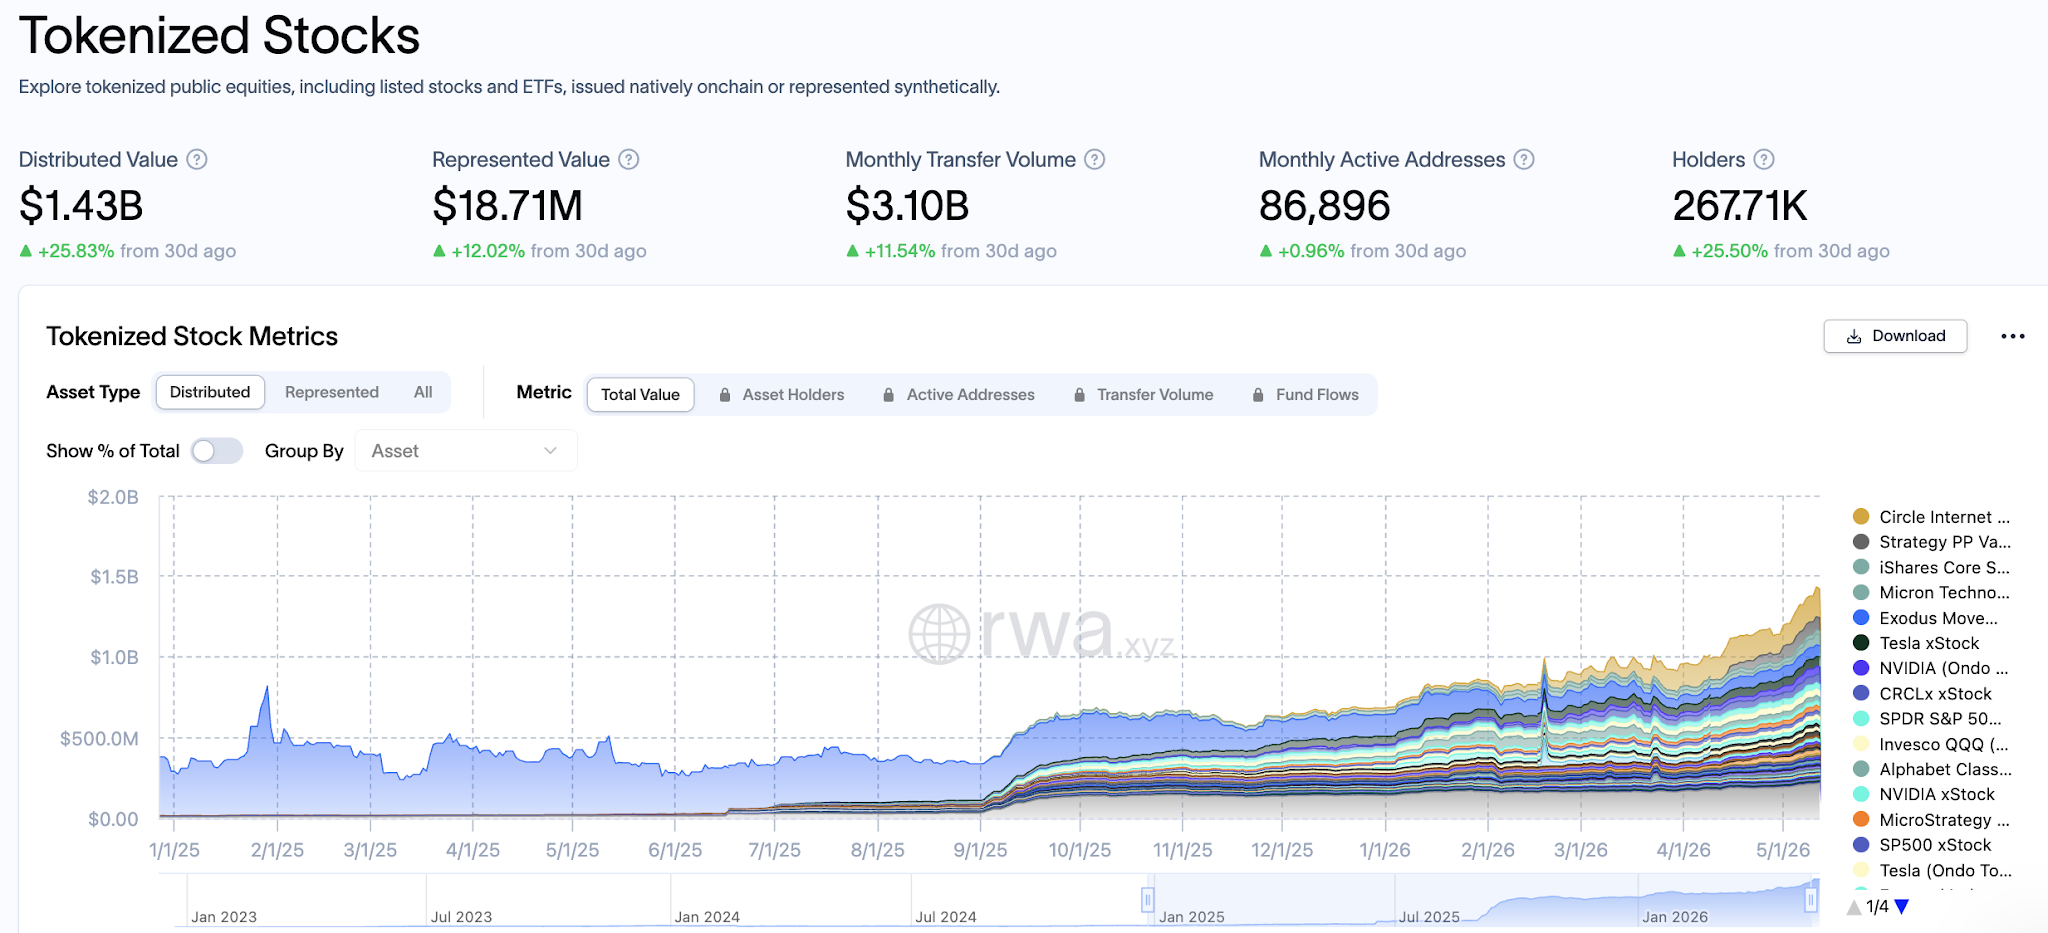
Source: https://app.rwa.xyz/stocks
Ondo Global Markets offers the ideal dataset to observe this trend. Launched on Ethereum in July 2025, it later expanded to BNB Chain, providing tokenized exposure backed by real U.S. equities and ETFs—custodied by SEC-registered brokers—with 24/7 permissionless trading and 24/5 instant minting/redeeming via smart contracts.
The following data covers all activity on Ethereum and BNB Chain through May 12, 2026:
Data Source:Ondo Global Markets — Trading Analytics, Dune
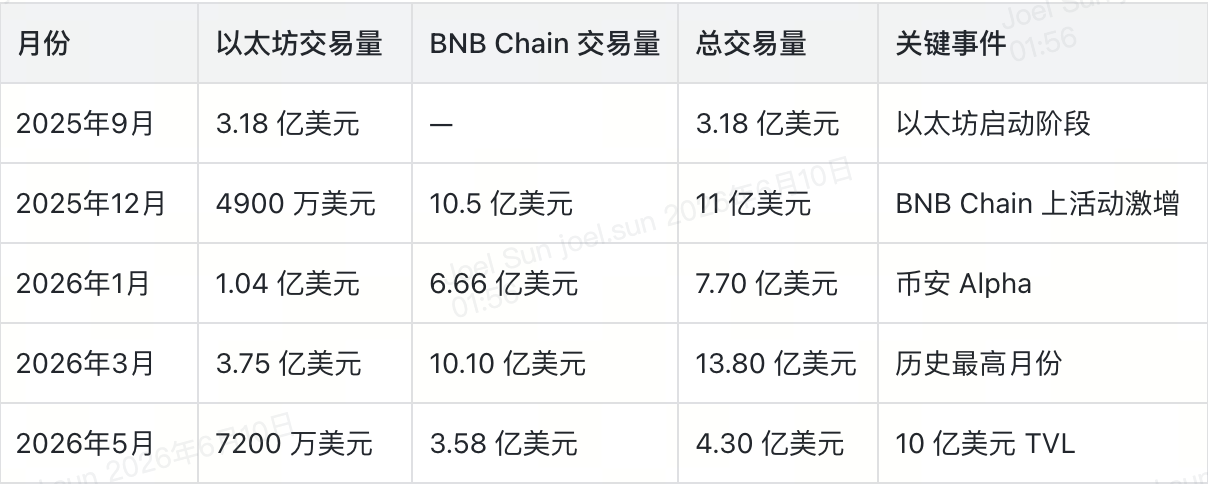
Overall activity shows clear volatility—but an upward trend. Monthly volume peaked at $1.38 billion in March 2026; the first 12 days of May alone generated $430 million. Concurrently, platform TVL surpassed $1 billion.
Data Source:Ondo Global Markets — Trading Analytics, Dune
24/7 On-Chain Operation, But Trading Still Follows Wall Street
One of the most compelling narratives around tokenized stocks is breaking time barriers: when traditional exchanges close, on-chain minting, redemption, and transfers continue.
Theoretically sound—but empirically untrue.
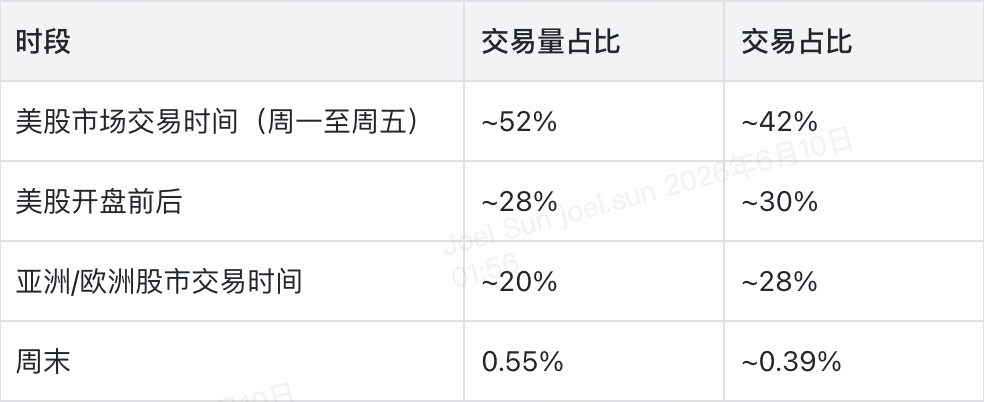
Trading time distribution is stark: ~52% of volume falls within U.S. market hours and extended-hours sessions; pre-market and after-hours combined account for ~28%; Asian and European dedicated sessions total ~20%. Weekends are negligible—just 0.55% of volume and 0.39% of transactions.
Data Source:Ondo Global Markets — Trading Analytics, Dune
More precisely, peak trading occurs between 10 a.m. and 12 p.m. ET Monday–Friday—a window where volume is 4–5x that of non-trading hours. Users *can* trade anytime—but they *choose not to*. Behavior remains anchored to U.S. equity liquidity, news flow, price discovery, and sentiment.
The current role of tokenized stocks is best described as a “time-delayed access layer to U.S. equities for global users.” For those outside traditional brokerage coverage, this access layer holds intrinsic value. Yet evolving from “delayed access” to an “independent market” requires three conditions: deeper liquidity during off-hours, more reliable price discovery outside U.S. hours, and genuinely active user participation during non-U.S. hours.
Retail Is Pouring In—But Pricing Power Remains With Whales
Is there genuine retail participation in tokenized stocks? Yes. Is retail driving volume? Absolutely not. This structure is unsurprising—most financial markets operate similarly. Yet dissecting the data reveals the market’s true stage of development.
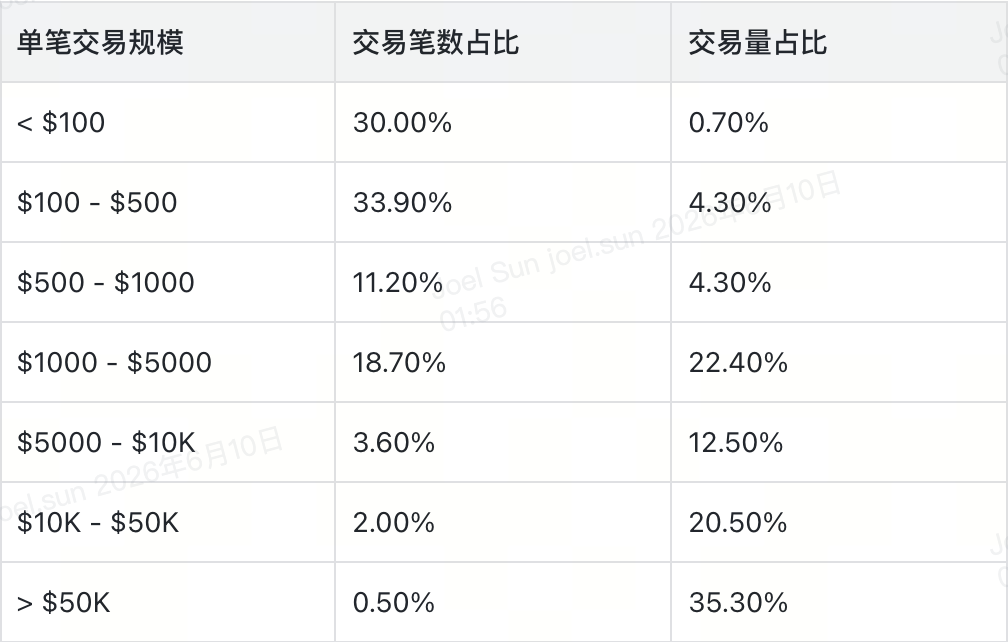
First, the small end: orders under $100 constitute 30% of transaction count; $100–$500 orders add another 33.9%. Together, sub-$500 orders account for nearly 64% of transactions—but only 5% of volume.
Now the large end: orders above $50,000 represent just 0.5% of transaction count but drive 35.3% of volume; $10,000–$50,000 orders contribute another 20.5%. In short, less than 1% of orders capture over one-third of total volume.
Data Source:Ondo Global Markets — Trading Analytics, Dune
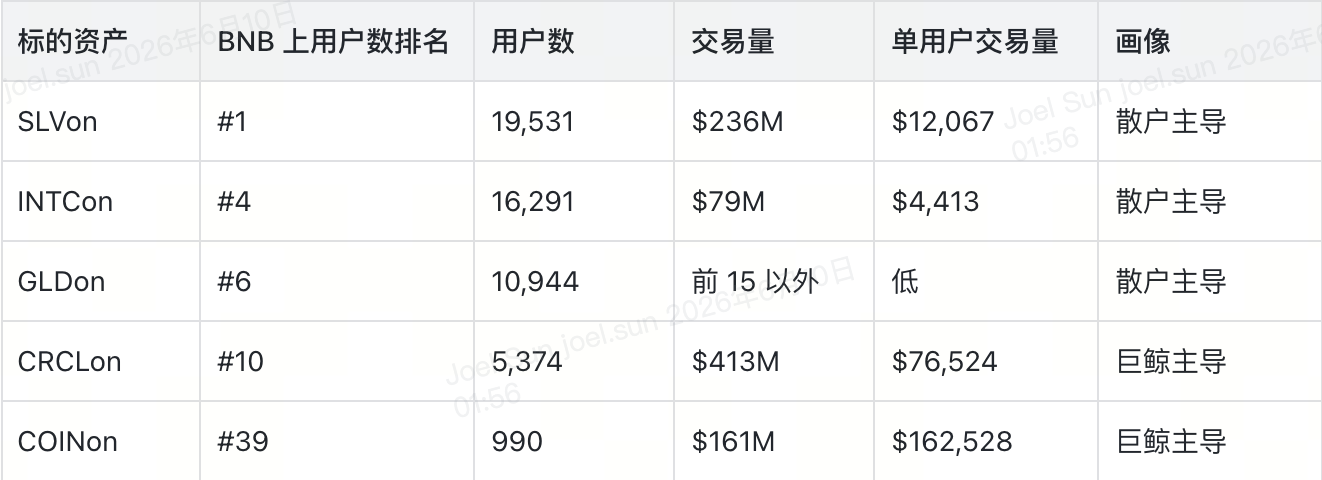
Asset-level breakdowns reveal sharper divergence. Tokenized silver ETF SLVon is the most widely held asset on BNB Chain—19,531 users, $236 million in volume. GLDon and INTCon show similar patterns: rapid user growth, low average transaction size. Conversely, CRCLon and COINon exhibit significantly higher per-user volume—fewer users, larger capital commitments—classic “whale-driven” assets.
These two asset types coexist, forming a dual-layer structure: tokenized stocks both enable access for users previously unable to buy U.S. equities—and accommodate users who already hold capital but seek alternative execution venues.
Data Source:Ondo Global Markets — Trading Analytics, Dune
Ondo Global Markets directly taps Nasdaq and NYSE liquidity during their 24/5 operational windows, maintaining depth and minimal slippage across trade sizes—a feat traditional DEXs cannot replicate. Yet further market quality improvements depend on deepening liquidity. “Retail distribution” and “institutional-grade liquidity” are two legs—lose one, and the market falters.
AI Stocks Lead—Gold & Silver Quietly Rise
AI Sector: Accounts for Nearly 40% of Volume
What’s been the dominant theme in U.S. equities from 2025 to 2026? AI—and this is now directly mirrored on-chain.
On Ondo Global Markets, AI-related tokenized stocks recently accounted for ~35–40% of trading volume—the only clearly defined, quantifiable, and sustainable thematic segment in the entire tokenized stock market.
NVDAon reigns as the AI sector’s liquidity king: $592 million in volume, +6.7% net inflow. Yet more directional accumulation signals appear beyond NVIDIA—in memory, chip infrastructure, and enterprise software segments, where net inflows are notably stronger:
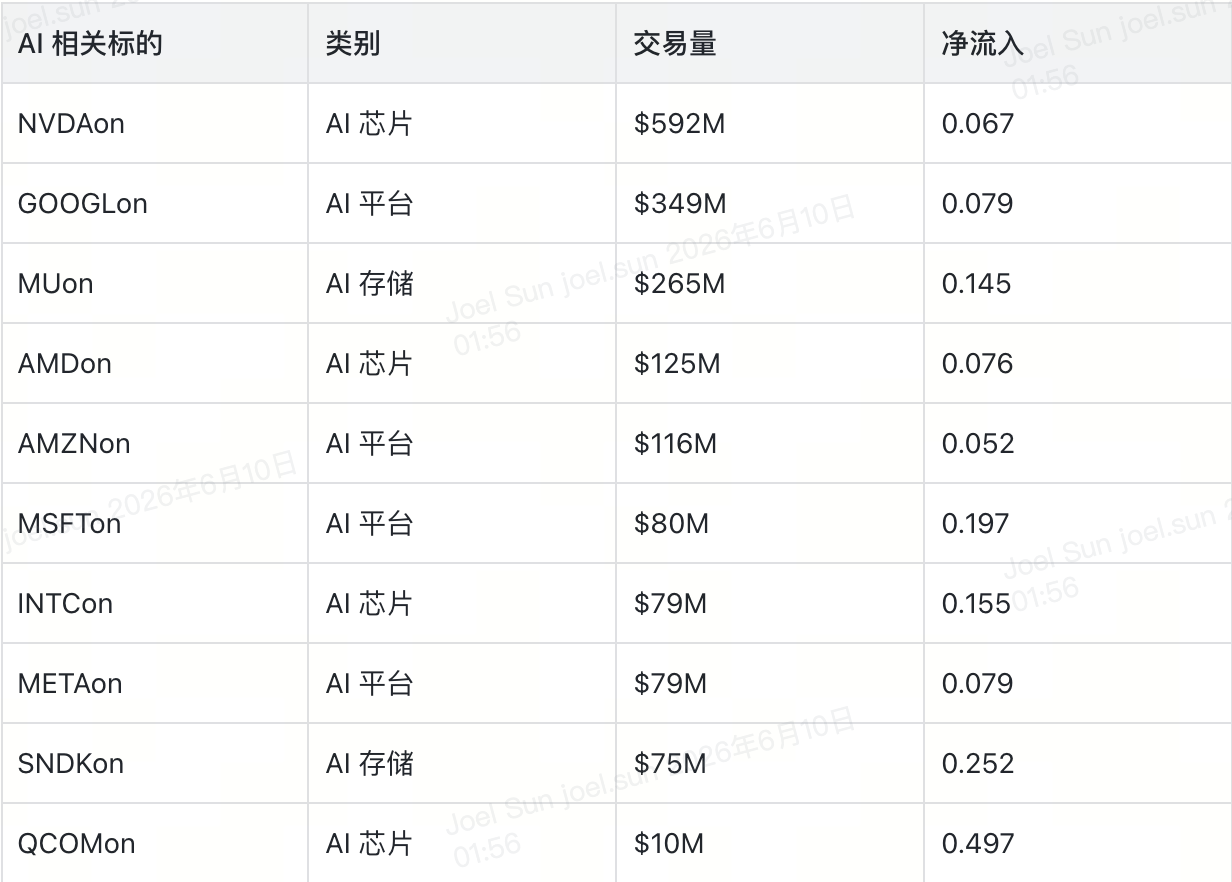
Data Source:Ondo Global Markets — Trading Analytics, Dune
This pattern sends a clear message: users aren’t just buying the largest AI leader—they’re positioning across the entire AI supply chain—from chips to memory, cloud infrastructure to enterprise software. This is the fundamental distinction between tokenized stocks and “crypto-native AI tokens”: users express views on public-market themes by anchoring directly to listed equities—not by speculating on new on-chain narratives.
Of course, this also means tokenized stock activity remains tightly coupled to Wall Street catalysts—earnings, guidance, interest rates, supply-chain developments, and sector rotation. AI may be the sexiest entry point—but it firmly anchors this market to traditional equity cycles.
Beyond Tech: Demand Emerging for Commodity ETFs
Blue-chip tech stocks top the volume rankings—unsurprising. But focusing solely on volume rankings misses critical signals.
By asset type, common stocks account for 72.5% of volume, followed by equity ETFs (11.8%), commodity ETFs (6.9%), bond ETFs (4.7%), ADRs (3.4%), and crypto ETFs (0.7%).
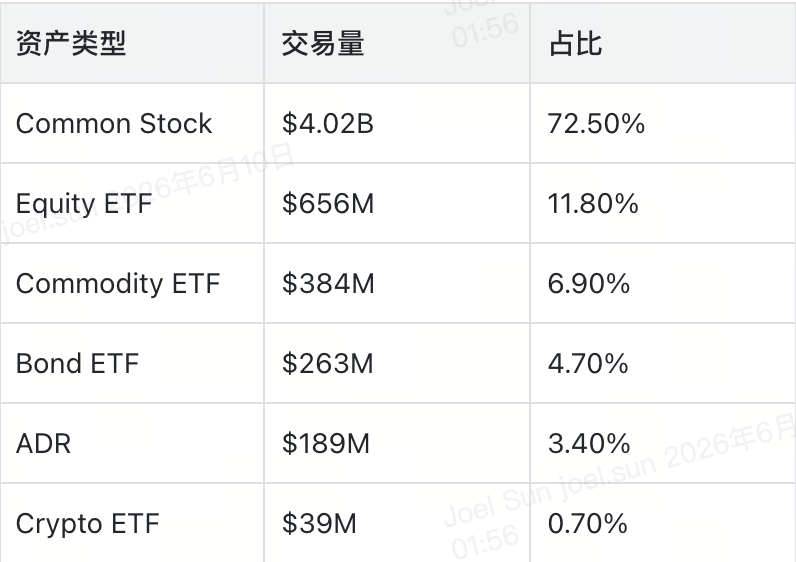
Data Source:Ondo Global Markets — Trading Analytics, Dune
The numbers themselves aren’t surprising—the surprise lies in user metrics. SLVon (tokenized silver ETF) is the most widely held asset on BNB Chain, reaching 19,531 users; GLDon (gold ETF) shows similarly broad participation. Though their volumes trail mainstream tech stocks, they outperform most assets on “user reach.”
The logic is straightforward: for many global users, commodity exposure is either unavailable—or prohibitively expensive—through local brokerages. Tokenized silver and gold thus become the lowest-barrier tools for gaining hard-asset exposure, portfolio diversification, and hedging against crypto price and inflation uncertainty.
This doesn’t mean commodity ETFs will overtake tech stocks in volume. But it signals that demand for “access” extends far beyond what volume rankings suggest. Long-term, the most viable RWA use cases will likely combine “familiar underlying assets” with “genuine access gaps”: ETFs, commodities, indices, bonds, and foreign equities—assets requiring no user education on “what they are,” only solutions to “how to buy them.”
Same Asset, Two Chains, Two Radically Different Markets
Tokenized stocks are often discussed as a monolithic category—but at least across BNB Chain and Ethereum, they’ve evolved into distinctly different market profiles.
Volume-wise: BNB Chain contributes 75.6% of total volume and ~168,000 unique wallets; Ethereum accounts for 24.4% and ~21,000 wallets. BNB Chain’s user base is roughly 8x larger than Ethereum’s; its volume, ~3x greater.
Quality-wise: Ethereum’s average order size is $3,092 vs. $1,791 on BNB Chain; per-wallet volume averages ~$64,286 on Ethereum—over 2.5x BNB Chain’s ~$25,000.
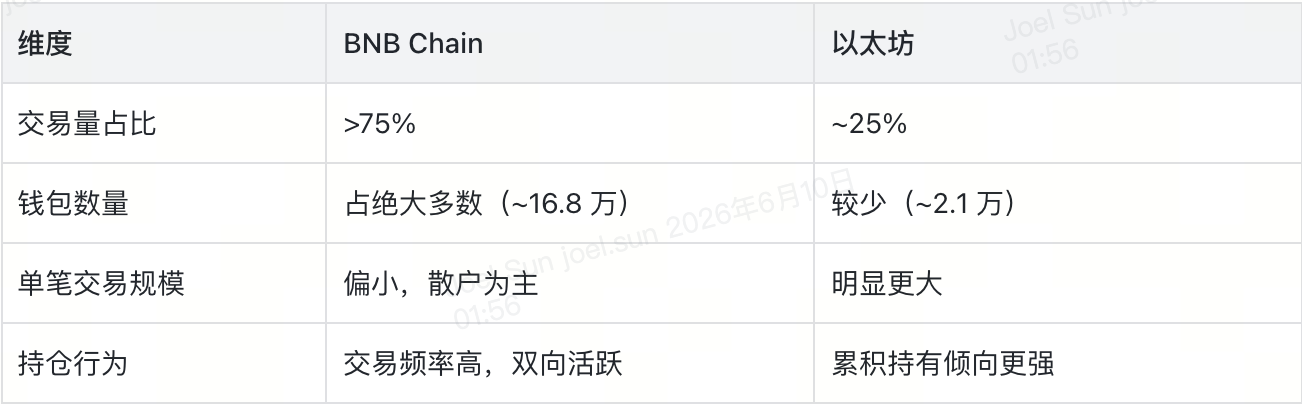
Data Source:Ondo Global Markets — Trading Analytics, Dune
The clearest illustration is cross-chain fund flows for identical assets. CRCLon shows slight net selling on Ethereum (-1.4%) but strong buying on BNB Chain (+32.6%); QQQon flips the script—Ethereum users accumulate heavily (+37.6%), while BNB Chain users remain tepid (+3.4%). Similar cross-chain behavioral divergence appears in MUon, TSLAon, and COINon.
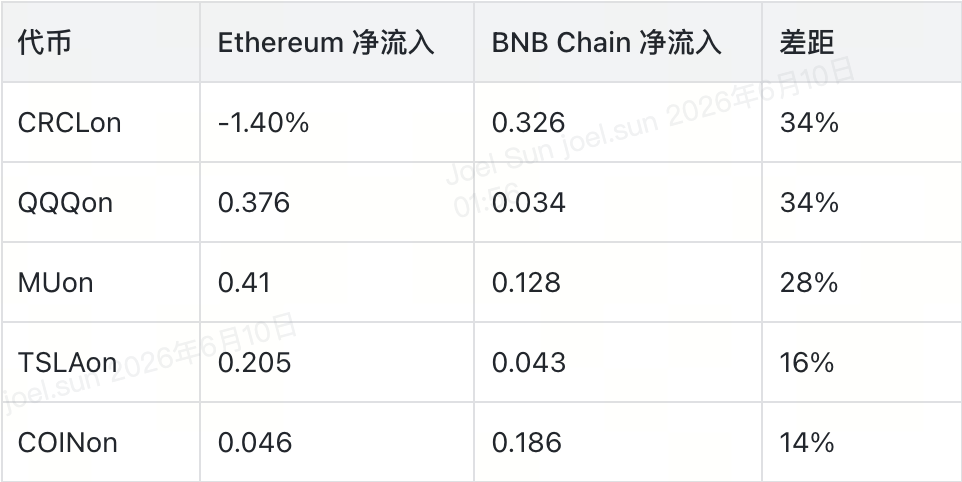
Data Source:Ondo Global Markets — Trading Analytics, Dune
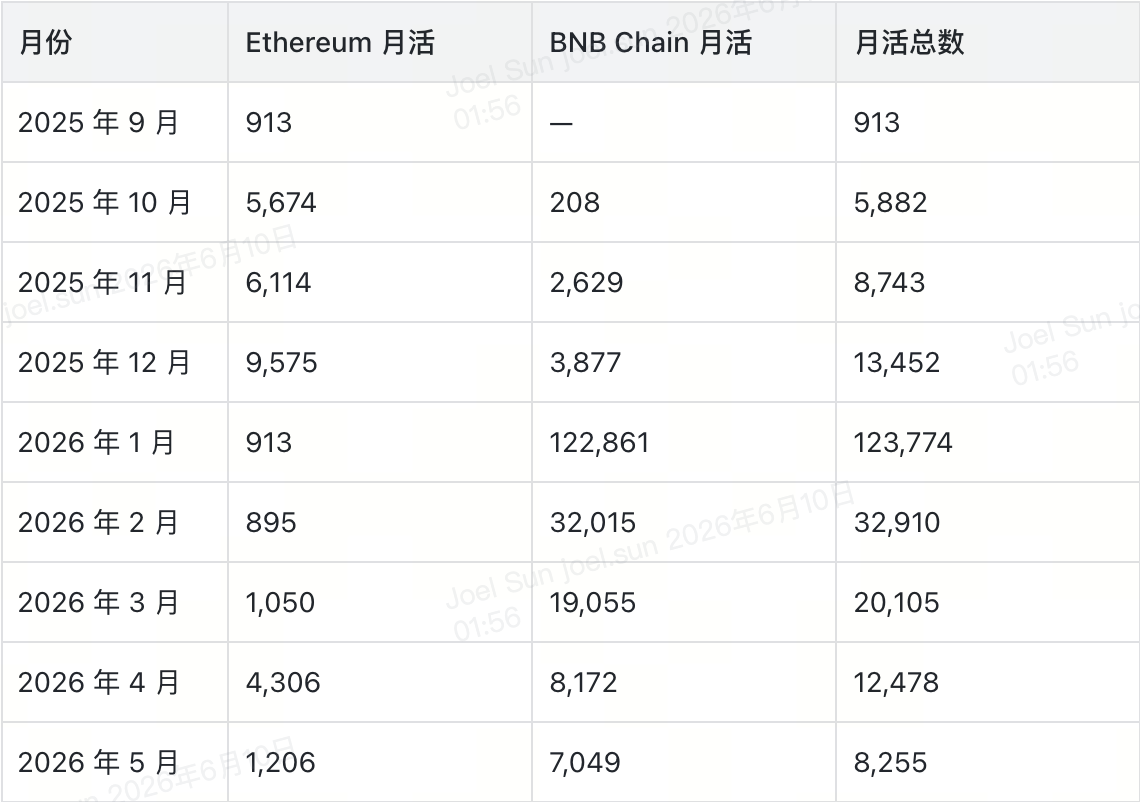
User growth data further amplifies this divergence. BNB Chain’s monthly active users surged from 3,877 in December 2025 to 122,861 in January 2026—then declined monthly: 32,015 (Feb), 19,055 (Mar), 8,172 (Apr), 7,049 (May). This curve traces a classic “activity-driven acquisition → churn → stabilization” cycle. Ethereum’s MAU is far smaller—but far less volatile.
Data Source:Ondo Global Markets — Trading Analytics, Dune
Combined across both chains, the true stable MAU sits closer to 8,000–12,000 users—not the cumulative wallet count suggests. That gap itself is noteworthy: cumulative wallets suit “reach” narratives; MAU and repeat behavior are hard indicators of “product-market fit.”
This carries direct strategic implications for RWA issuers and wallet platforms. “Moving assets onto-chain” is step one. What truly determines distribution efficiency is: Which chain hosts your users? How do they transact? Which chain do they trust? What product experience do they expect? The same tokenized stock may be a “hold-and-forget asset” on one chain—and a “high-frequency trading tool” on another. Channel strategy cannot be one-size-fits-all.
Next Phase: From “Asset Onboarding” to “Market Access”
RWA’s first phase solved a foundational question: Can traditional assets be moved onto-chain? That question has been answered.
The next questions are harder: How do we distribute them? How do we get users to adopt them? How do we build trust? How do we retain them?
Tokenized stocks serve as a living case study for this transition. Data already tells us several things: users deploy on-chain trading to express views on public-market themes like AI; they use ETFs and commodities to access instruments previously out of reach; behavior differs markedly across chains. Yet boundaries remain clear—trading still follows the U.S. clock, volume remains concentrated among large players, and user retention remains early-stage.
The value of tokenized stocks today isn’t in “replacing Wall Street”—a narrative too grand and inaccurate. Their real value lies in enabling users outside traditional brokerage coverage—or served poorly by standard market access channels—to gain simpler, more direct exposure to Wall Street assets.
For wallet products, the role is clear: lower asset discovery friction, simplify onboarding and execution, help users understand risk, and make portfolio management more intuitive. Whoever delivers this experience best will capture the upside as tokenized stocks evolve from “novelty” to “routine allocation.”
Tokenized stocks have crossed a critical threshold: they are no longer theoretical. The next question is whether they can embed themselves into global users’ daily investment routines—built on clear product architecture, reliable liquidity, and a product experience people choose to return to, again and again.
Join TechFlow official community to stay tuned
Telegram:https://t.me/TechFlowDaily
X (Twitter):https://x.com/TechFlowPost
X (Twitter) EN:https://x.com/BlockFlow_News