Bank of America Issues “Sell” Warning: Everyone Is Fully Invested and Optimistic
TechFlow Selected TechFlow Selected
Bank of America Issues “Sell” Warning: Everyone Is Fully Invested and Optimistic
Today’s market concentration has returned to the level seen at the peak of the dot-com bubble.
By: Tide Research

BofA’s latest Flow Show features a title with sharp edges—Post-bubble.
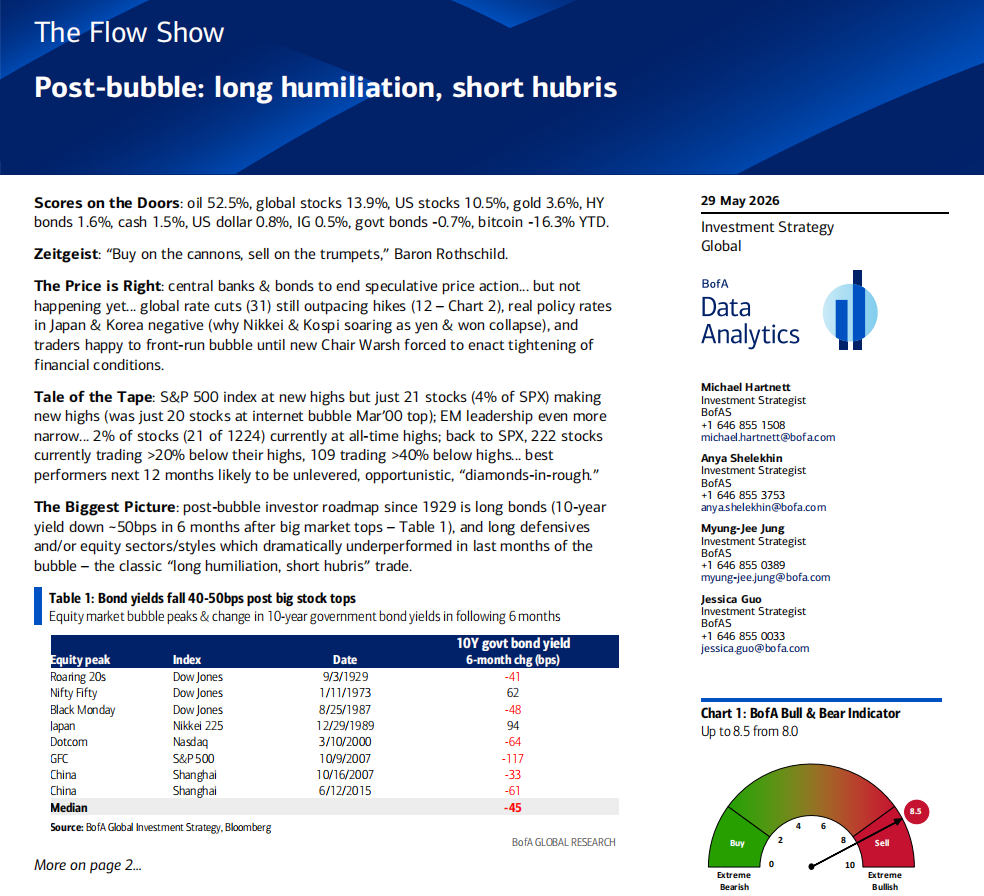
Analyst Michael Hartnett didn’t pose questions or soften his language with qualifiers like “possibly” or “perhaps.” In his view, today’s U.S. equity market is not merely “suspected of being in a bubble”—it has already entered the historical script that follows a bubble’s burst. He traced asset performance patterns after every major bubble peak from 1929 to 2015—and then mapped those patterns onto today’s market.
The core trading strategy distilled from this map? Go long “the humiliated,” go short “the hubristic” (long humiliation, short hubris).
A Set of Disturbing Data Points
First, consider today’s “anomaly.”
The S&P 500 index sits at an all-time high. That fact alone isn’t alarming—what is concerning is how few stocks are participating in this rally: Among all 500 S&P constituents, only 21 (just 4%) have simultaneously hit new highs. Meanwhile, 222 stocks are down more than 20% from their individual peaks, and 109 are down over 40%.
Hartnett highlights this 4% figure with a stark historical parallel: In March 2000—the peak of the dot-com bubble—only 20 stocks in the S&P 500 were hitting new highs. In other words, market concentration today has returned to levels last seen at the apex of the internet bubble.
Emerging markets are even more extreme. Of 1,224 EM stocks, only 21 (under 2%) are trading at all-time highs.
The index celebrates; most individual stocks remain silent.
The Historical Script After a Bubble
Hartnett systematically reviewed market behavior following every major equity bubble peak since 1929. His findings center on two clear themes.
Theme One: Bonds almost invariably rally after a bubble bursts. Analyzing 10-year Treasury yield changes over the six months following eight major equity peaks, he found the median decline was 45 basis points. The logic is straightforward: A bursting bubble triggers a sharp drop in risk appetite, driving capital into safe-haven assets—pushing up Treasury prices and pulling yields down. Six of the eight episodes saw yields fall; only 1973 (stagflation) and 1989 (Japan-specific conditions) bucked the trend.
Theme Two: The sectors hardest-hit during the bubble tend to outperform afterward. Every bubble elevates certain “darlings” while marginalizing others. Post-bubble, roles reverse.
Examples: During the Roaring Twenties leading up to 1929, utilities, telecoms, industrials, and banks led the bubble—and underperformed sharply afterward. Energy, previously overlooked, emerged as the winner. During the 2000 dot-com bubble, the Nasdaq doubled in the six months before its peak, while the equal-weighted S&P 500 actually declined over the final 12 months. After the burst, the Nasdaq fell 60% in one year, while previously “humiliated” defensive sectors rebounded strongly (utilities +25%, consumer staples +24%), and the equal-weighted S&P 500 rose in 2000. During China’s 2006–2007 bull run, materials and industrials tripled in 12 months—then plunged 65–85% in the year after the bubble burst, while previously lagging sectors—consumer staples, utilities, and technology—outperformed.
Who are today’s “humiliated”? Hartnett names them explicitly: Since the Nasdaq surged 80% from its April 2026 low, the worst-performing sectors have been consumer staples, financials, and healthcare—making them, per historical precedent, the most likely winners post-bubble.
The Next Phase of AI Investment: From “Builders” to “Users”
This section offers the most actionable insight for crypto and tech investors.
Hartnett notes tech firms’ extraordinary penetration of credit markets: Tech accounts for 10% of the U.S. investment-grade bond market and 8% of the high-yield bond market. This means tech companies aren’t just dominating equities—they’re also aggressively levering up in debt markets.
His conclusion: AI investment leadership is shifting—from “spenders” (large tech capex) and “builders” (semiconductors) toward “users” (application layer). The optimal way to participate is via small-cap growth stocks—not continued bets on mega-cap tech.
The historical anchor for this shift is the “Nifty Fifty” bubble of the 1970s: From December 1974 to May 1981, small-cap growth stocks delivered over 1,000% excess return versus the S&P 500. Hartnett hints a similar structural rotation may now be brewing.
Fund Flows: Smart Money Quietly Turning
This week’s fund flow data reveals several telling signals.
Global equities saw $7 billion in net outflows—the first such outflow in nine weeks. Japanese equities bled $8.2 billion, the largest weekly outflow since May 2025. China-focused funds withdrew $14 billion—bringing cumulative outflows since January 2026 to $218 billion. Europe has recorded net outflows for seven consecutive weeks.
Meanwhile, bonds posted net inflows for the 57th straight week ($23.6 billion this week). Investment-grade bonds have seen inflows for eight consecutive weeks; emerging-market bonds, for seven. Notably, BofA private clients pulled record amounts from cash while simultaneously buying record volumes of long-duration Treasury ETFs (TLT, JAAA, VGIT).
Translation: Institutional money is rotating from equities into bonds—especially longer-duration ones. Private client cash allocations have fallen to a historic low (9.6%), while equity allocations have surged to a record high (66%). Everyone is fully invested—and everyone is optimistic.
That, precisely, is why Hartnett sounds the alarm.
Bull & Bear Indicator Triggers “Sell” Signal
BofA’s Bull & Bear indicator rose from 8.0 to 8.5—moving deeper into the contrarian “sell” zone. Any reading above 8.0 triggers a sell signal.
Of the six components comprising the indicator, fund manager positioning stands at the 98th percentile (extreme bullishness), bond flows at the 85th percentile (extreme bullishness), hedge fund positioning at the 72nd percentile (bullish), and credit market technicals at the 77th percentile (bullish). Not a single component shows bearish sentiment.
Since 2002, this indicator has triggered 17 sell signals. Within the next two to three months, global equities averaged a 2–3% decline, with a ~60% hit rate and maximum drawdowns of 15–20%.
June: A Chockablock Month for Event Risk
Hartnett uses one word: chockablock (packed full).
Key June events include: U.S. CPI release (June 10, expected ~4%), ECB rate hike (June 11), G7 Summit (June 15), Bank of Japan rate hike (June 16), Warsh’s first FOMC press conference (June 17), UK by-election (June 18), plus a broad window for large-scale equity issuance.
In a context where everyone is fully invested and all indicators scream optimism, any unexpected outcome could spark widespread profit-taking. Hartnett’s advice is direct: Take profits—and trade contrarily when yields fall and equities rise.
He also cites noteworthy political context: Trump’s economic approval rating has slumped to 35%, and his inflation approval rating to 28%—both record lows. The political cost of the Iran conflict is now reverberating in the White House.
2026’s Winners and Losers
Year-to-date performance as of May 27:
Top performers: Oil (+54.4%) and South Korean equities (+111.6%). Worst performers: Bitcoin (-16.3%) and Indian equities (-10.4%). Chinese equities fell 7.9%; China-focused funds have seen $218 billion in cumulative outflows. Gold rose just 2.5%, remaining muted after war-risk premium faded.
A counterintuitive fact: Among all major asset classes, Bitcoin is 2026’s worst-performing asset—and by a wide margin. India’s equity index—the second-worst performer—fell only two-thirds as much as Bitcoin.
For crypto investors, the report delivers an uncomfortable implication: Bitcoin ranks dead last across all assets YTD, continues to see weekly net outflows ($1.2 billion this week), and—within BofA’s framework—maintains high correlation with broader risk assets. If the “post-bubble” script plays out, Bitcoin may not escape unscathed.
Disclaimer: This article is a summary and interpretation by Tide Research of a third-party brokerage research report. All referenced ratings, price targets, earnings forecasts, and related judgments reflect the views of that brokerage’s analysts alone, represent only their institution’s stance, and do not reflect Tide Research’s views nor constitute any investment recommendation.
Markets carry risks; decisions must be made independently. This article should not serve as the basis for buying or selling any security.
Join TechFlow official community to stay tuned
Telegram:https://t.me/TechFlowDaily
X (Twitter):https://x.com/TechFlowPost
X (Twitter) EN:https://x.com/BlockFlow_News