Is the U.S. stock market in the “largest bubble in history”? Four valuation indicators simultaneously flash red.
TechFlow Selected TechFlow Selected
Is the U.S. stock market in the “largest bubble in history”? Four valuation indicators simultaneously flash red.
The market has reached a crossroads where “valuation says no” and “earnings say yes.”
Author: Claude, TechFlow
TechFlow Intro: The S&P 500’s CAPE ratio has reached 39—the highest level since the 2000 dot-com bubble; the “Buffett Indicator” (market cap-to-GDP ratio) has breached 230%, a new all-time high; and the top ten index constituents account for over 35% of the index’s weight—representing the highest concentration in modern market history. Multiple valuation metrics are simultaneously flashing overheating signals, yet Wall Street is deeply divided: one camp argues AI-driven earnings growth justifies the premium, while the other contends this is precisely the classic hallmark of a bubble peak.
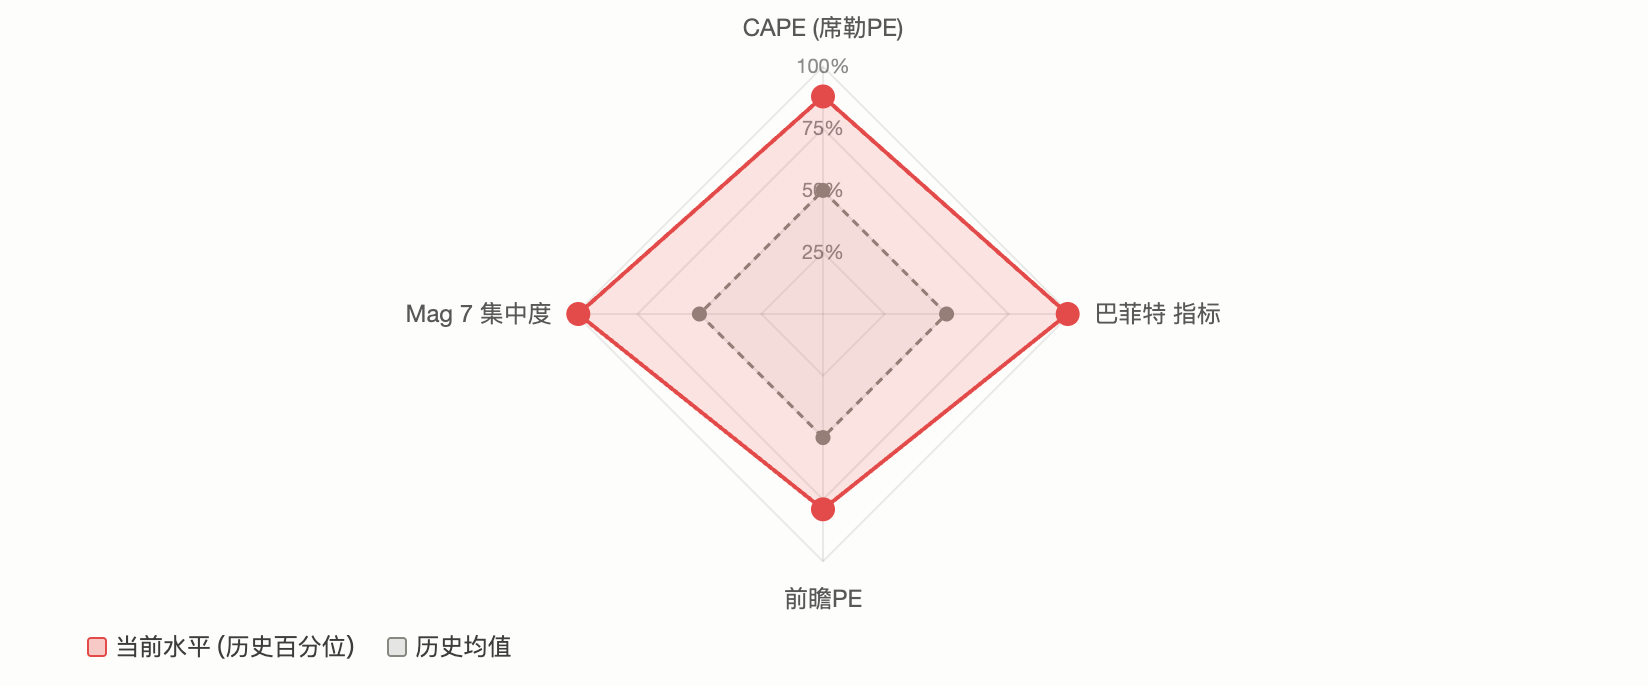
The S&P 500 is currently in a rare state: nearly all mainstream valuation metrics are simultaneously turning red.
The CAPE (Shiller P/E) ratio is approaching 40—the highest since the dot-com bubble; the “Buffett Indicator” (market cap/GDP ratio) has surged past 230%, setting a record for the past half-century; and the top ten constituents now represent over 35% of the index’s weight—a level of market concentration unprecedented in modern financial history. A post on Reddit’s r/stocks community labeled the current market the “most overextended state ever,” garnering over 2,100 upvotes and 640 comments, with discussion centering on one core question:
Is this a signal of a bull market top—or the dawn of an AI-driven “new paradigm”?
CAPE Ratio Hits 39—Second Only to the 2000 Dot-Com Peak
The CAPE (Cyclically Adjusted Price-to-Earnings) ratio, developed by Nobel laureate Robert Shiller, calculates the P/E ratio using the inflation-adjusted average earnings over the prior 10 years—designed to filter out short-term cyclical noise.
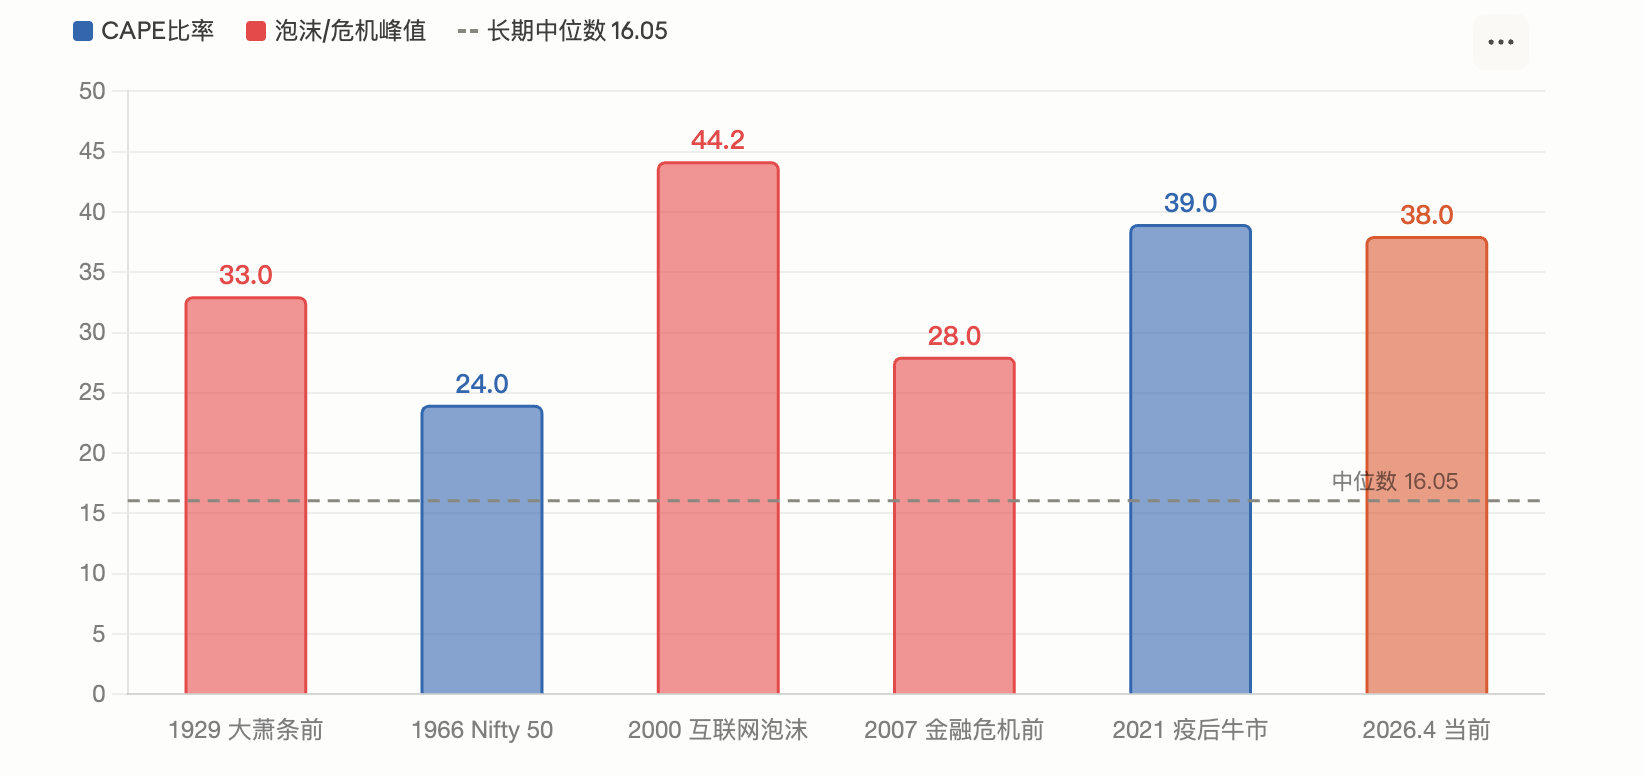
According to a March report by Motley Fool, the S&P 500’s CAPE ratio hit 39.2 in February. As of April 1, GuruFocus reported it at 38.66. Both readings rank second-highest historically—just below the 44.2 peak during the 2000 dot-com bubble—and far above the long-term median of 16.05.
Historically, CAPE has reached similar extremes only twice before: at the end of the 1920s (followed by the Great Depression) and in 2000 (after which the S&P 500 plunged 49% over 2.5 years following the dot-com bust). Based on Shiller’s modeling, today’s CAPE level implies an estimated annualized forward return of only ~2%.
Motley Fool notes that Shiller himself has expressed concern whenever CAPE exceeds 25, pointing out that since 1881, only three periods have surpassed that threshold: 1929, 1999, and around 2007.
That said, IndexBox acknowledges that a high CAPE does not automatically presage an imminent crash—indeed, after breaking above 30 at the end of 2023, the market rose over 40% further.
“Buffett Indicator” Breaches 230%—Highest Level in Half a Century
In a 2001 Fortune magazine interview, Warren Buffett called the market-cap-to-GDP ratio “probably the best single measure of where valuations stand at any given moment.” He advised that 75%–90% represents a reasonable range, and levels above 120% signal market overvaluation.
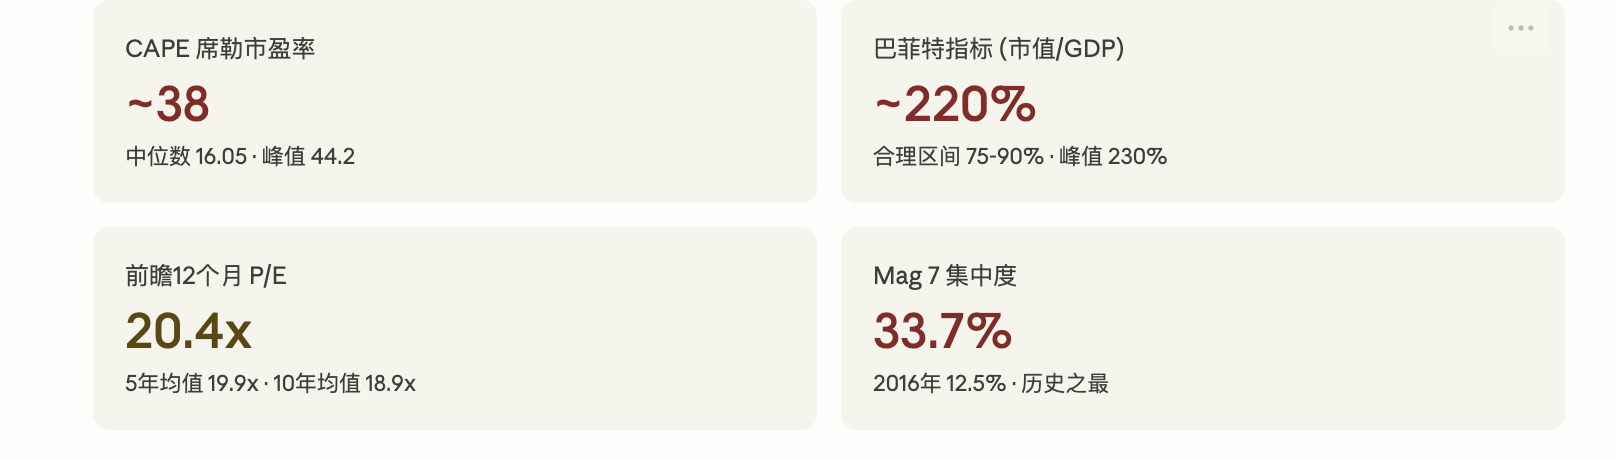
Per Advisor Perspectives, as of early 2026, the indicator briefly spiked to 230.3%—the highest level ever recorded—approximately 2.09 standard deviations above its trend line and classified as “severely overvalued.” Its latest March reading fell to 227.5%, still the second-highest on record. GuruFocus estimates the S&P 500’s annualized return over the next eight years at approximately –0.3% based on this metric.
As of April 14, GuruFocus reported the ratio at 219.5%. Critics argue the indicator fails to fully account for two structural shifts: first, U.S. corporate profit margins have risen significantly above their historical mean; second, an increasing share of large U.S. firms’ revenues comes from overseas—boosting market capitalization without corresponding GDP impact domestically. Supporters counter that even after detrending, today’s reading remains in an extreme historical percentile.
Market Concentration at Modern-High Record—Mag 7 Accounts for Over 30%
Valuation is only one dimension of the issue. Structural risk in the market is equally troubling.
Per AhaSignals’ April 13 data, the S&P 500’s top ten constituents account for 35.59% of the index’s weight; the top five, 25.97%; and the “Magnificent Seven” (Mag 7), 30.44%. Its Aggregate Concentration Risk Index (ACRI) stands at 81/100—classified as “critical.” Motley Fool’s April data shows Mag 7’s weight in the S&P 500 has climbed from 12.5% in 2016 to 33.7% today.
A December 2025 CNBC report cited Kathmere Capital CIO Nick Ryder warning that investors remain excessively concentrated in the Mag 7 and recommending broad diversification beyond U.S. large-cap growth stocks. Yardeni Research President Ed Yardeni concurrently advised underweighting the Mag 7 and overweighting the “Impressive 493”—the rest of the index.
The practical risk of such concentration is clear: when a handful of stocks dominate index performance, their declines exert a disproportionately large drag on the broader market. This was already partially confirmed in Q1 2026. Per 24/7 Wall St, Microsoft, Amazon, and NVIDIA fell roughly 20%, 9%, and 6% year-to-date, dragging the market-cap-weighted S&P 500 down nearly 4%, while the equal-weighted S&P 500 (RSP) edged slightly higher over the same period.
Two Camps Clash: “History Repeating” or “This Time Is Different”
Faced with these figures, Wall Street is sharply divided.
Bearish camp: Their central thesis is mean reversion in valuations. GMO co-founder Jeremy Grantham explicitly labeled the current market an AI-driven mega-bubble in his latest research. He noted that actual AI-related revenue remains far below capital expenditure levels, citing OpenAI’s forecast of $17 billion in operating losses in 2026—widening to $35 billion in 2027. GMO argues that classic bubble-top signals (a collapse in speculative stocks, a sharp outperformance of quality names) have yet to fully emerge—but this merely suggests the bubble hasn’t peaked yet, not that it doesn’t exist.
IO Fund’s cyclical analysis also leans cautious. Its report highlights that 2026 coincides with the convergence of both the Gann 60-year major cycle and the 4-year presidential cycle—and each Mag 7 stock formed its peak between July 2025 and February 2026. When the index made its final new high, its core components were already quietly rolling over—a “classic late-bull-market warning signal.”
Bullish camp: They emphasize fundamentals. Per FactSet’s April data, the S&P 500’s forward 12-month P/E stands at 20.4x—above its 10-year average of 18.9x but down from 22x at end-2025. Analysts project full-year 2026 S&P 500 earnings growth of 17.6%; if realized, this growth would meaningfully absorb today’s elevated valuations.
Fidelity Global Macro Research Director Jurrien Timmer takes a more moderate view: since the outbreak of the Iran conflict, the S&P 500’s maximum drawdown has been under 10%—a decline that historically occurs, on average, once per year. Earnings expectations continue growing at a 17% annualized pace and have yet to be materially dented by geopolitical headlines.
Morgan Stanley Investment Management, in its 2026 outlook, notes most bull markets last 5–7 years—and historically, bull markets entering their fourth year have always posted positive returns. The firm has raised its non-U.S. equity allocation to a record high.
BlackRock adds that 2025’s tech-stock gains were driven primarily by earnings growth—not valuation expansion—and that current valuations are reasonable relative to growth expectations.
Compounding Geopolitical Shocks: Iran War and Stagflation Risks
Beyond valuation debates, macro conditions add further uncertainty.
The Iran conflict pushed oil prices above $100/barrel, and the S&P 500 briefly dipped below its 200-day moving average in March. Per FinancialContent, the Fed held rates steady at its March meeting with a “hawkish pause,” and its updated dot plot forecasts only one additional cut for the remainder of 2026. UBS, in its March 17 report, characterized recent volatility as a “necessary reset for high valuations”—not the start of a bear market—and maintained its year-end target of 7,700.
Goldman Sachs has raised its 12-month recession probability to ~30%. This dovetails with valuation warnings: historically, when recessions coincide with high valuations, the S&P 500’s average peak-to-trough decline is 32%. But if earnings growth persists (per FactSet’s consensus forecast of 17%), sharp corrections have historically been shallow and swift to recover.
For investors, the conflicting signals are unmistakable. Long-term valuation metrics are almost universally flashing red—yet short- to medium-term earnings data remain robust. The market stands at a crossroads where “valuations say no” clashes with “earnings say yes.” The outcome hinges on whether AI capital expenditures translate into sustained profitability—and whether geopolitical shocks ultimately trigger a recession.
Join TechFlow official community to stay tuned
Telegram:https://t.me/TechFlowDaily
X (Twitter):https://x.com/TechFlowPost
X (Twitter) EN:https://x.com/BlockFlow_News