How to Accurately Value Cryptocurrencies?
TechFlow Selected TechFlow Selected
How to Accurately Value Cryptocurrencies?
This article aims to construct a valuation framework tailored to the characteristics of tokens.
By: Four Pillars
Translated by: AididaoJP, Foresight News
Key Takeaways
- Tokens ≠ equity. Valuation should use Enterprise Value / Holder Income—not Enterprise Value / Protocol Revenue.
- The accrual ratio—the share of protocol revenue that ultimately flows to token holders—is a critical diagnostic metric. Across the projects we compare, this ratio ranges from 25% to 100%.
- “Dilution” is not monolithic. Team incentives represent real operating costs (and must be included in valuation multiples), whereas investor token unlocks are market events (and should not be included in multiples).
- Treasury value must be assessed for “extractability.” The question isn’t “How much is in the treasury?” but rather “Can holders actually extract it?”
I frequently encounter a common mistake in crypto valuations: someone pulls up a protocol generating $500 million in annualized fee revenue, divides its market cap by that number to get a single-digit multiple, and declares it “cheap.” This calculation uses the wrong denominator—and the wrong numerator. Investors think they’re paying a 5x multiple, but once you factor in how much income they’ll actually receive, the true multiple may be 20x.
The P/E ratio is a reasonable starting point—but it ignores the balance sheet and capital structure, which is precisely why traditional finance uses Enterprise Value multiples (e.g., EV/EBITDA). However, applying the EV/EBITDA concept directly to tokens runs into three fundamental problems:
- Treasury assets: Token holders have no legal claim on them.
- Protocol revenue: Most of it may never reach token holders.
- The largest cost: It doesn’t appear on the income statement—it manifests as new token issuance.
This article aims to build a valuation framework tailored to tokens. Its core metric is Enterprise Value / Holder Income—the price you pay for each dollar of revenue that ultimately lands in your pocket as a token holder—while also accounting for balance sheet effects and real business costs. I illustrate the framework using five protocols (HYPE, PUMP, MAPLE, JUP, SKY). This is not investment advice—only a methodological demonstration.
1. How to Calculate a Token’s “Enterprise Value”
The first mistake in many token valuations lies at the very beginning: using market cap outright. But market cap ≠ enterprise value.
In traditional finance, the logic is clear:
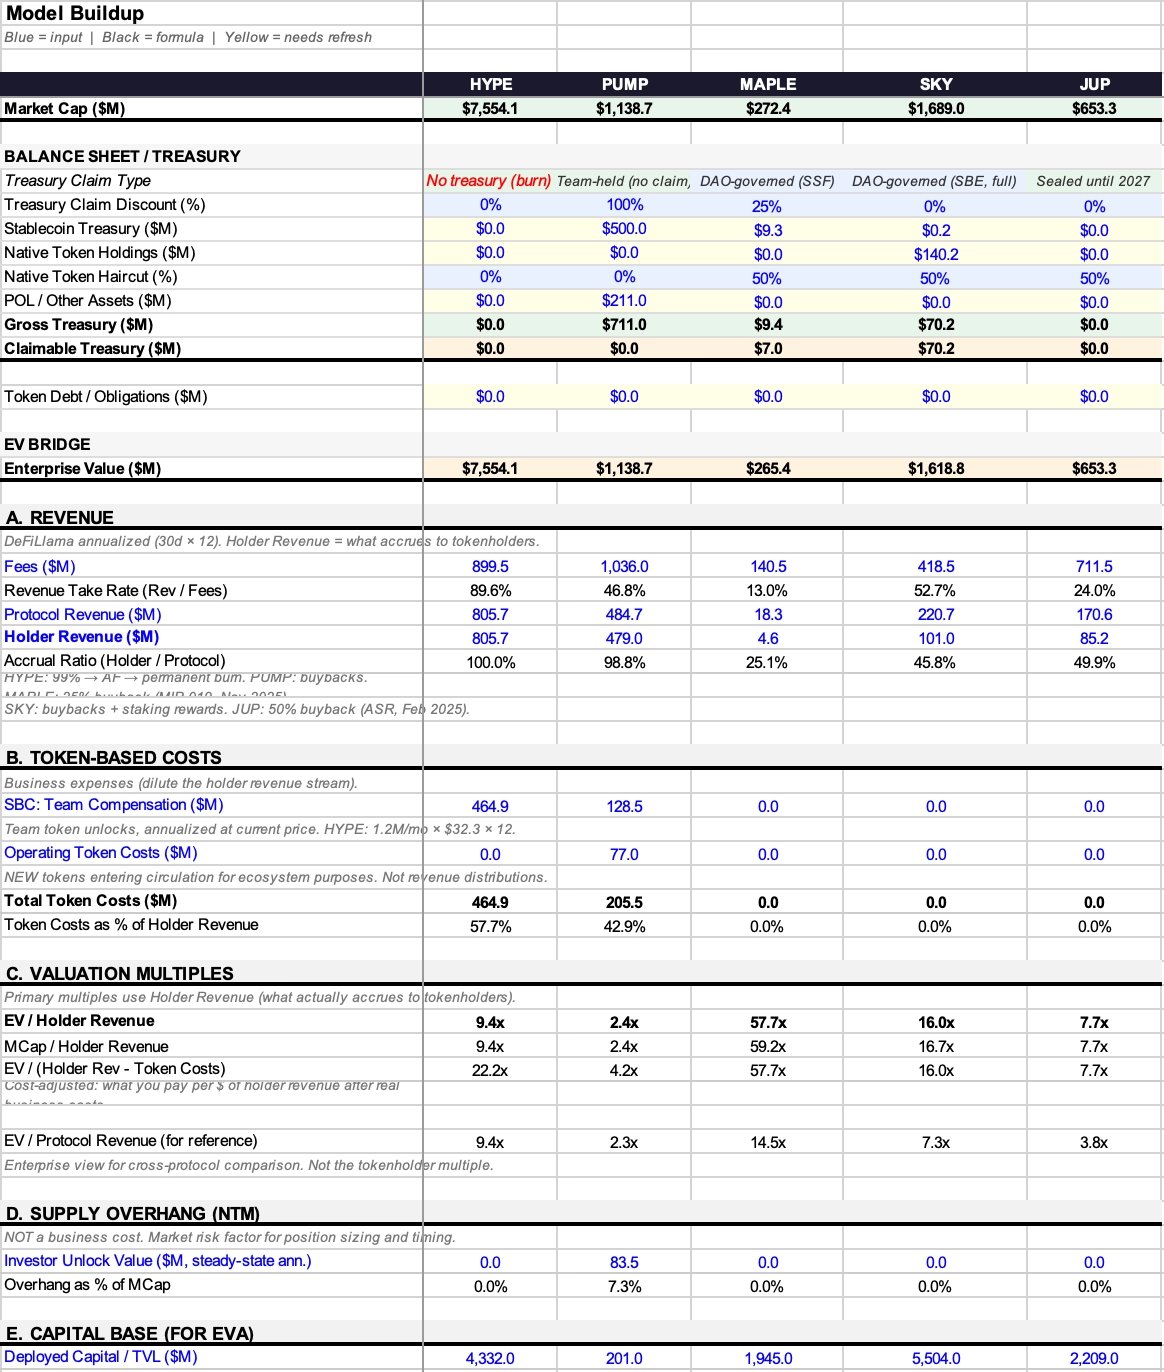
Enterprise Value = Market Cap + Debt − Cash
Because if you acquire the entire company, you assume its debt—and you also get to keep its cash. Subtracting cash is justified because that money is legally yours.
In crypto, things are more complex. From automatic burns (USDC inflows used to buy back and permanently destroy tokens—no one receives that USDC) to foundation wallets (holding hundreds of millions with neither governance rights nor distribution mechanisms), cases vary widely. The key question isn’t “What’s in the treasury?” but “Can holders extract it?” (Of course, if someone acquires the entire protocol, the discount vanishes—just like in traditional finance. Here, the “claim discount” refers specifically to minority holders like us.)
I retain the term “enterprise value” because the underlying logic aligns: you’re calculating what it costs to acquire the core business, while netting out balance-sheet items that don’t belong to you. The formula is:
Token Enterprise Value = Market Cap + Token Debt − Extractable Treasury Assets
Most protocols currently have no “token debt,” so the focus usually falls on treasury assets.
First, break down what’s in the treasury. A protocol’s treasury typically holds three types of assets:
- Stablecoins: Real money—fully extractable in principle.
- Native tokens: Its own tokens. Deducting these is effectively “subtracting oneself from oneself,” and usually warrants at least a 50% discount.
- Protocol-owned liquidity (POL) and other assets.
Total Treasury Assets = Stablecoins + Native Tokens × (1 − Your Chosen Discount Rate) + POL
But total assets ≠ extractable assets—that’s the central problem this framework seeks to solve.
Some protocols don’t even hold a treasury worth discounting—for example, pure burn mechanisms (USDC inflows used for buybacks and burns) generate no balance-sheet asset anyone can claim. In such cases, extractable treasury assets = 0, and enterprise value = market cap. That’s the cleanest case—requiring no subjective judgment.
For treasuries holding actual assets, I introduce a “claim discount” framework, assigning a value between 0% and 100% based on how much control holders truly exert over those funds:
- 0% discount: Automatic buyback-and-burn, requiring no governance vote; or fund usage fully at the discretion of token holders.
- 25% discount: An active DAO with a proven track record of distributions.
- 50% discount: Governance rights exist on paper only—never meaningfully exercised.
- 75% discount: Treasury controlled by the team; weak governance.
- 100% discount: Funds controlled by a foundation; holders have zero claim rights.
These percentages are the most subjective—and most vulnerable—part of the entire framework, I admit. But two analysts debating whether it’s 25% or 50% is far more meaningful than both ignoring the treasury entirely and just quoting P/E ratios.
Real-world examples:
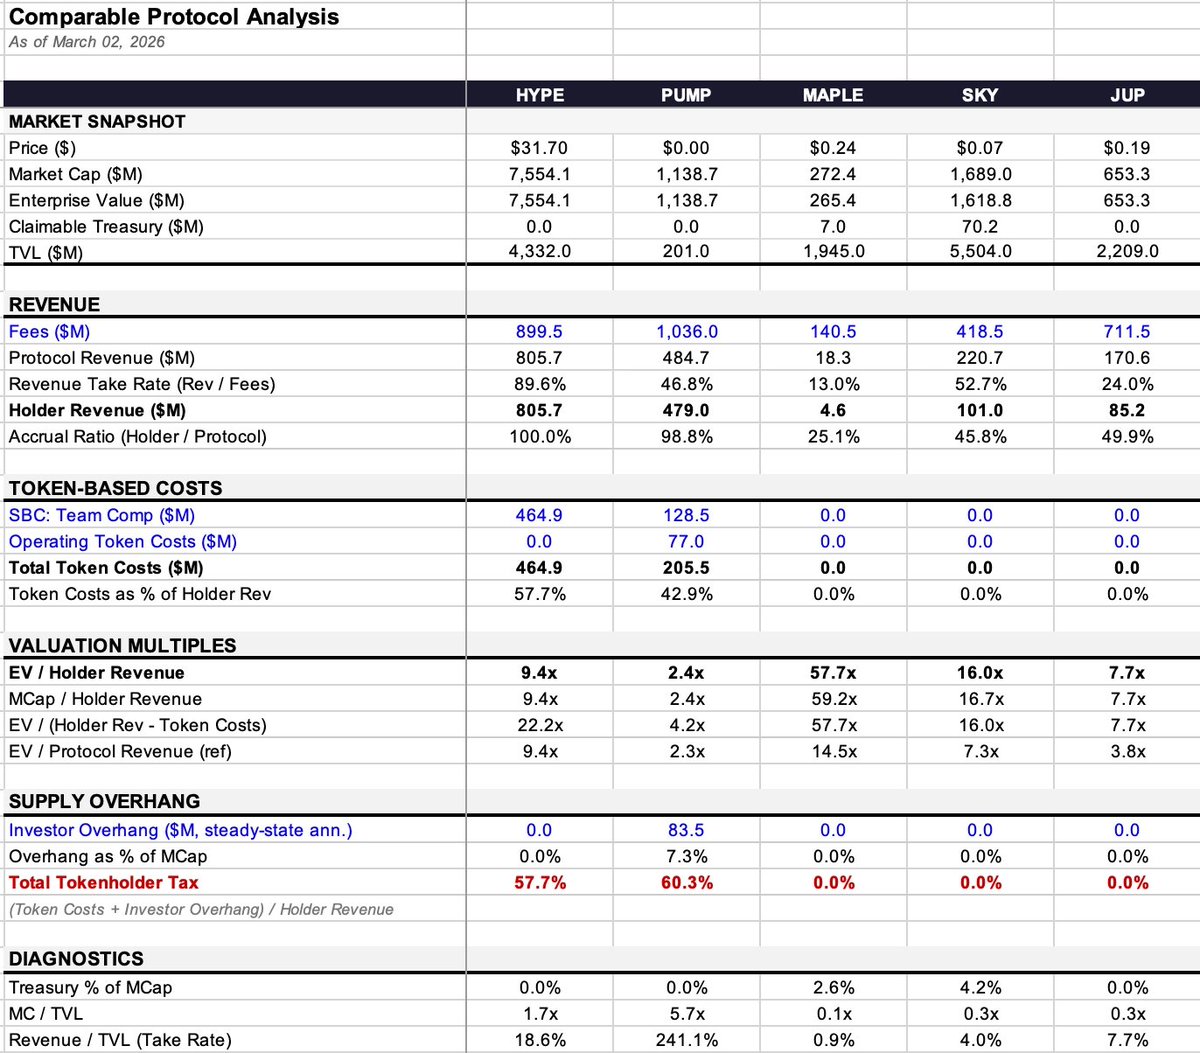
- Maple: Treasury holds $9.36M (99.7% stablecoins)—a relatively small amount. Enterprise value adjusts only slightly, from $272M to $265M.
- SKY: Treasury holds $140.3M—but 99.9% is its own tokens. Applying a 50% discount yields an estimated extractable value of $70.2M, lowering enterprise value from $1.69B to $1.62B.
- PUMP: Reportedly holds ~$700M in stablecoins—but has no governance mechanism or distribution channel. Holders cannot access any of it. So extractable assets = $0, and enterprise value = market cap.
- HYPE and JUP: Both operate pure burn or closed treasuries—no judgment needed. Enterprise value = market cap.
2. Revenue and Token Costs: How Much Actually Lands in My Pocket?
The gap between what a protocol earns and what token holders actually receive is where most valuation frameworks fail—and it’s the single biggest driver of valuation multiples.
Think of revenue as a three-tier waterfall:
- Fees: Total amount paid by users.
- Protocol Revenue: What the protocol retains after paying LPs, validators, and other “supply-side” participants.
- Holder Income: What ultimately reaches token holders via buybacks, burns, or direct distributions.
Two critical conversion rates sit between these tiers:
- Retention Rate = Protocol Revenue ÷ Fees (what share of total fees the protocol keeps)
- Accrual Ratio = Holder Income ÷ Protocol Revenue (what share of retained revenue flows to holders)
Combined, these ratios produce dramatically different outcomes:
- HYPE: Retention rate 89.6%, accrual ratio 100%. Of $900M in fees, $805.7M ultimately flows to holders.
- Maple: Retention rate 13% ($140.5M in fees → $18.3M protocol revenue), accrual ratio 25.1% ($18.3M → $4.6M holder income). Cumulative flow-through is just 3%, versus HYPE’s 90%.
Within the same framework, one delivers 3%, the other 90%. If you compare these two protocols using “EV/Fees” or even “EV/Protocol Revenue,” you’ll get wildly divergent conclusions.
Why use “Holder Income” as the denominator—not “Protocol Revenue”?
In traditional finance, EV/Revenue works because equity holders have residual claim rights—legally, everything belongs to them. Token holders have no such right. They receive only what the tokenomics design allocates to them. If revenue sits idle in a team-controlled treasury with no distribution mechanism, then simply holding governance tokens does not make that revenue “yours.”
Using “Protocol Revenue” as the denominator flatters protocols with low accrual ratios—making them look artificially “cheap.” I call this gap the “accrual discount.”
Take Maple as an example:
- EV/Protocol Revenue = 14.5x
- EV/Holder Income = 57.7x
A full 4x difference! Same data, different denominator—your assessment of “what the market is charging” changes completely.
3. Costs: Not All Dilution Is Created Equal
The word “dilution” is used too loosely in crypto. Misclassifying it leads directly to misvaluation.
Category 1: Team Incentives (Equity-Like Compensation)—This Is an Operating Cost
Warren Buffett said decades ago: If compensation isn’t a cost, what is it—a gift? In traditional finance, it hits the income statement, reducing profits. In crypto, it appears as newly minted tokens entering circulation—but the economic reality is identical: it’s a real cost of running the business.
- HYPE: Annualized team incentives = $464.9M, consuming 57.7% of holder income.
- PUMP: Annualized team incentives = $128.5M.
Both must be included in valuation multiples.
Category 2: Operational Token Costs (Ecosystem Incentives, User Acquisition, etc.)—Also an Operating Cost
These function like customer acquisition costs—real expenses that should likewise be included in multiples. Beyond team incentives, PUMP incurs $77M in operational token costs, bringing total token costs to $205.5M.
The test is simple: Does it create new token supply?
If the protocol merely distributes existing revenue to stakers—with no new token issuance—the cost is already reflected in the earlier cash flow (i.e., the gap between protocol revenue and holder income).
If the protocol mints or unlocks tokens previously outside circulation, that’s real dilution—and a genuine business cost.
Category 3: Investor Lockup Expirations—This Is a Market Event, Not an Operating Cost
You wouldn’t subtract VC sales from Apple’s earnings to derive an “adjusted profit.” Likewise, this shouldn’t enter operating multiples.
PUMP’s annualized investor sell pressure is $83.5M—7.3% of its market cap. This profoundly affects price action and market dynamics—but it’s not an operating cost. I isolate it in a separate diagnostic metric called the “Total Token Holder Tax” (i.e., token costs + investor sell pressure, expressed as a % of holder income), but exclude it from core valuation multiples.
4. Four Core Multiples and One Diagnostic Metric
Based on the above logic, we arrive at the following metrics (defined here once, referenced later):
- EV / Holder Income (core metric): How much you pay for each dollar of revenue that ultimately lands in your pocket.
- Market Cap / Holder Income: Same as above—but unadjusted for treasury. The difference reflects balance-sheet impact.
- EV / (Holder Income − Token Costs) (cost-adjusted multiple): Deducts real business costs (team incentives, operational costs), but excludes investor sell pressure.
- EV / Protocol Revenue (for reference only): The gap vs. EV/Holder Income quantifies the magnitude of the “accrual discount.”
- Total Token Holder Tax (diagnostic metric): = (Token Costs + Investor Sell Pressure) ÷ Holder Income. This single number captures the combined effect of business costs and supply pressure. For example, PUMP’s 60.3% means that for every $1 of income received by holders, an additional $0.603 hits the market as new supply. This figure doesn’t directly indicate valuation level—but signals the dynamic relationship between cash flow and supply.
5. Data Snapshot & Key Case Points
- HYPE: Accrual ratio 100%, 9.4x holder income. But high team incentive costs lift the cost-adjusted multiple to 22.2x. Revenue structure is transparent—complexity lies elsewhere.
- PUMP: Appears cheapest (2.4x), accrual ratio 98.8%. But treasury is non-extractable, and a major unlock looms in August 2026. Cost-adjusted multiple rises to 4.2x; Total Token Holder Tax hits 60.3% (highest in sample).
- MAPLE: Largest accrual discount (4x). Protocol revenue multiple = 14.5x vs. holder income multiple = 57.7x—a massive gap. Zero token costs, so cost-adjusted multiple remains unchanged.
- JUP: Cleanest balance sheet. Through its “net-zero emissions” governance, it has zero token costs, zero investor sell pressure, and zero extractable treasury. All multiples converge near 7.7x.
- SKY: Accrual ratio 45.8%—the clearest illustration of how denominator choice shapes valuation. Protocol revenue multiple = 7.3x (appears cheap), but holder income multiple = 16.0x (less attractive). Treasury is 99.9% its own tokens—value requires discounting.
6. Conclusion
This framework certainly has flaws:
- Treasury claim discounts are subjective: I assign 25%, you might assign 50%—neither can convince the other.
- Judging “issuance” can be ambiguous: Some protocols keep minting functions active, but distribution channels are dead—tokens pile up in undistributed pools, blurring the line.
- Data sources are noisy: DeFiLlama’s 30-day annualized figures may double a protocol’s apparent cheapness or expensiveness depending on which month’s snapshot is used.
Yet it’s at least an actionable starting point. EV/Holder Income—adjusted for balance-sheet effects and real business costs—helps clarify exactly how much income landing in your pocket you’re paying for with every dollar spent.
The gap between what protocols earn and what holders receive is the market’s largest fundamental mismatch today. Many protocols generate hundreds of millions in fees, yet holders capture only pennies—while most valuation frameworks don’t even distinguish the two.
The good news? The industry is increasingly prioritizing value capture: fee switches are turning on, buybacks are replacing inflationary staking, and governance bodies are voting to pause incentives. We’re building tools to measure what’s actually happening—more accurately than ever before.
7. Data Sources & Methodology Notes
Revenue Data: DeFiLlama annualized figures (last 30 days × 12). Advantage: More responsive than six-month data. Disadvantage: Monthly volatility may introduce noise.
Holder Income: Taken directly from DeFiLlama’s “Holder Income” field—includes only buybacks, burns, and direct distributions.
Treasury Data:
MAPLE: $9.36M (DeFiLlama, 99.7% stablecoins)
SKY: $140.3M (DeFiLlama, 99.9% native tokens)
JUP: $0 (closed)
PUMP: Stablecoin estimate median = $500M (actual range: $286M–$800M)
Token Costs:
MAPLE: $0. MIP-019 proposal (October 2025) ended staking rewards. Though a 5% inflation smart contract may still be minting, no distribution channel exists. (Source: docs.maple.finance, The Defiant, Oct 31, 2025)
SKY: $0. Savings module (STR) now distributes SPK and Chronicle Points—not SKY tokens. (Verified March 2026 at app.sky.money/rewards). Rune’s August 2024 mention of “$600M SKY annually” is outdated—but governance could restart it anytime. (Source: sky.money FAQ, vote.sky.money)
JUP: $0. “Net-zero emissions” proposal passed February 22, 2026 (75% approval). DAO treasury locked until 2027.
Investor Sell Pressure:
PUMP: Steady-state annualized sell pressure = $83.5M. Actual cliff begins August 2026; projected sell pressure over next 12 months ≈ $48.7M (prorated at 7/12 months).
Lending Protocol Metrics:
MAPLE: Uses actual Assets Under Management (AUM) ($3.79B, Q1 2026 report), not DeFiLlama TVL ($1.945B). Net Interest Margin (NIM) = Protocol Revenue / AUM. Full metrics in Excel appendix.
Cash Operating Expenses: Not estimated. Protocols don’t disclose them—and estimating would imply false precision.
Equity-Incentive Valuation: Calculated at current token price. Highly sensitive to price changes.
Join TechFlow official community to stay tuned
Telegram:https://t.me/TechFlowDaily
X (Twitter):https://x.com/TechFlowPost
X (Twitter) EN:https://x.com/BlockFlow_News