

Silver Frenzy: 10-Day Surge of 25%—Should You Chase or Run?
TechFlow Selected TechFlow Selected
Silver Frenzy: 10-Day Surge of 25%—Should You Chase or Run?
Volatility has been repriced, and the market is now pricing in tail risks for significant price increases.
Author: Campbell
Translation: TechFlow
It has been 10 days since our last analysis on silver was published.
The market dynamics from 10 days ago now seem like a distant quarter. In this short period, the silver market has experienced a series of significant events:
-
China announced it will implement a licensing system for silver exports starting January 1 next year.
-
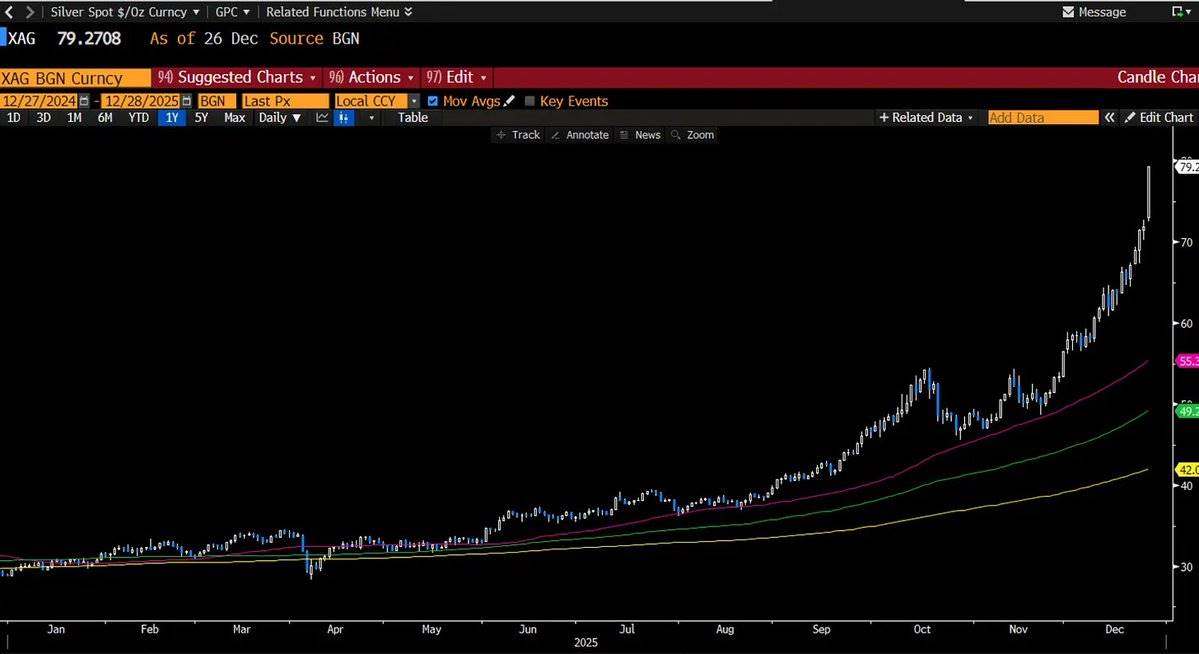
Physical silver prices in Shanghai surged to $91, while COMEX (New York Mercantile Exchange) settled at $77.
-
The London forward curve remains deeply in backwardation, not as extreme as in October but still inverted.
-
CME (Chicago Mercantile Exchange) increased margin requirements for silver.
-
After a much-deserved digital detox, I spent the entire afternoon staring at Bloomberg and Rose, trying to figure out whether these changes affect our market view.
Short-term conclusion: This is not a good time to initiate new long positions.
I will wait for the upcoming pullback to reposition, remaining flexible when using options.
This is precisely the part trading books won’t tell you—when your investment thesis works, even too well, what you need isn’t just capital management, but emotional resilience. At this stage, theoretical mathematical models are no longer just probability distributions—they become realized gains through long call options.
This phase is unsettling because you need to do more work: recheck your calculations, assess bearish counter-narratives that could go against you.
This is exactly the current situation.
Bearish warnings (or: potentially "fatal" risk factors)
In the next two weeks, silver bulls will have to contend with narratives and pressures that may trigger short-term bearish sentiment.
Don't be surprised by an upcoming "red candle"—it's very likely to happen. The key question is whether you’ll choose to buy the dip. We’ve already shifted some of our “Delta” (price exposure) into gold, rebalancing our portfolio to hold approximately 15% in gold and 30%-40% in silver, compared to a previous ratio closer to 10:1.
In addition, we've purchased upside butterflies and significantly increased our long dollar call options. The logic behind these moves will become clearer over time.
In any case, here are the main potential bearish factors currently:
-
Tax-loss harvesting pressure
Your current position has likely generated substantial profits—possibly enough to make your accountant nervous. Investors who entered via long-dated call options may resist selling their holdings before December 31.
Especially if these positions have been held for less than a year, as this involves not only capital gains tax but also differences between short-term and long-term tax treatment.
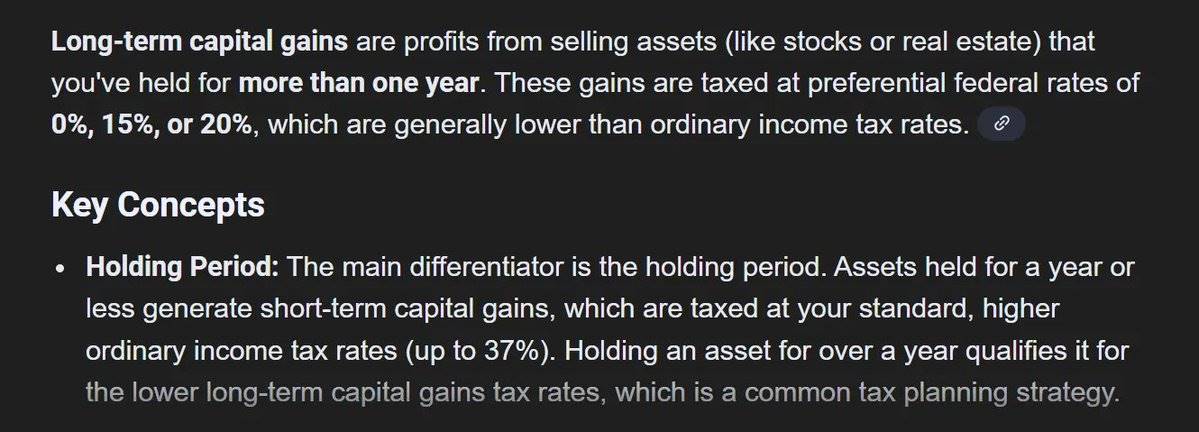
This means there is bullish pressure now, but after January 2, it will turn bearish.
-
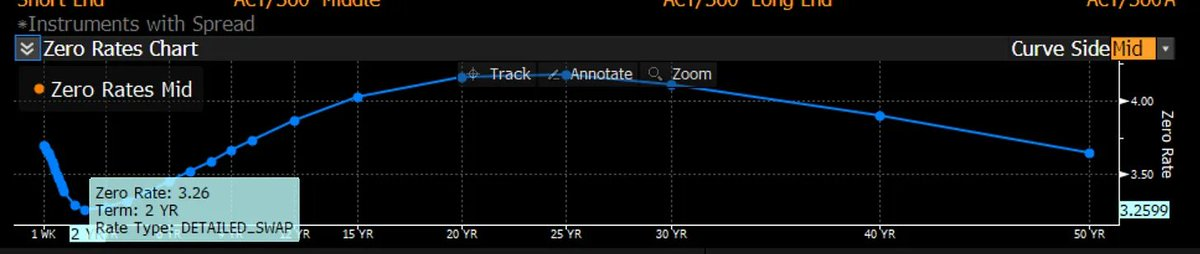
Dollar and interest rate concerns
Recent strong GDP data may weaken expectations of easing on the 2-year Treasury yield curve, forcing policymakers to choose between a stronger dollar and higher short-term rates. Either way, it’s bad news in the short term for dollar-denominated precious metals like silver and gold.
-
Margin hikes
CME (Chicago Mercantile Exchange) announced increased margin requirements for precious metals effective December 29.
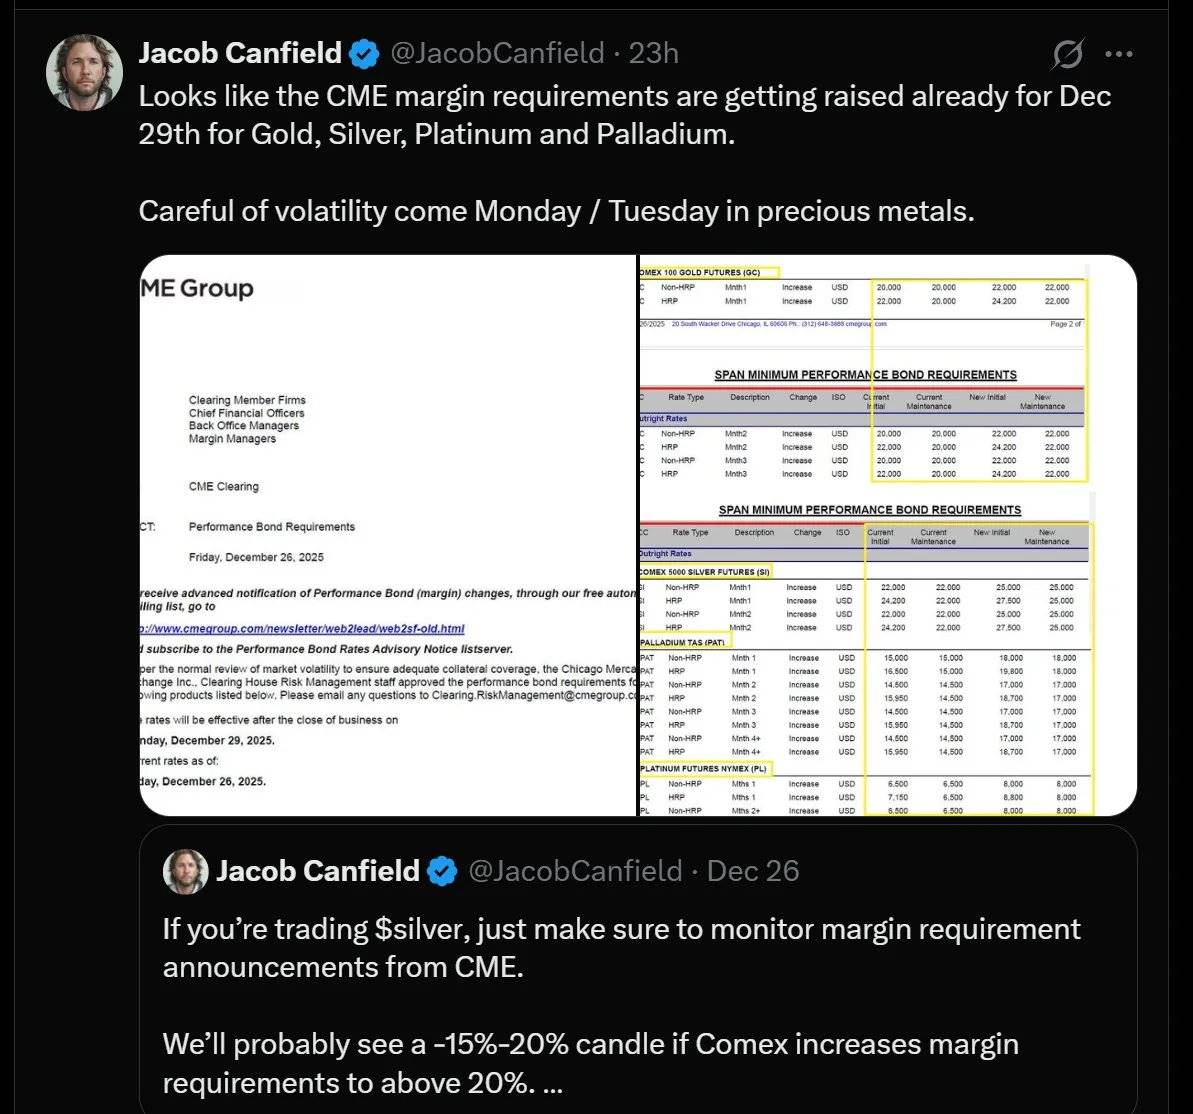
If you're using leverage in the futures market, this change could significantly impact you. Higher margin = higher capital requirement = forced liquidations for undercapitalized investors. This resembles the 2011 silver market crash, when CME raised margins five times within eight days, causing leverage to collapse and abruptly ending silver’s rally.
So, should we worry this time? Actually, it’s not that bad. Silver margin requirements today are already far above 2011 levels, so the recent hike, while impactful, is relatively mild. Moreover, today’s silver demand is primarily driven by physical demand, unlike in 2011.
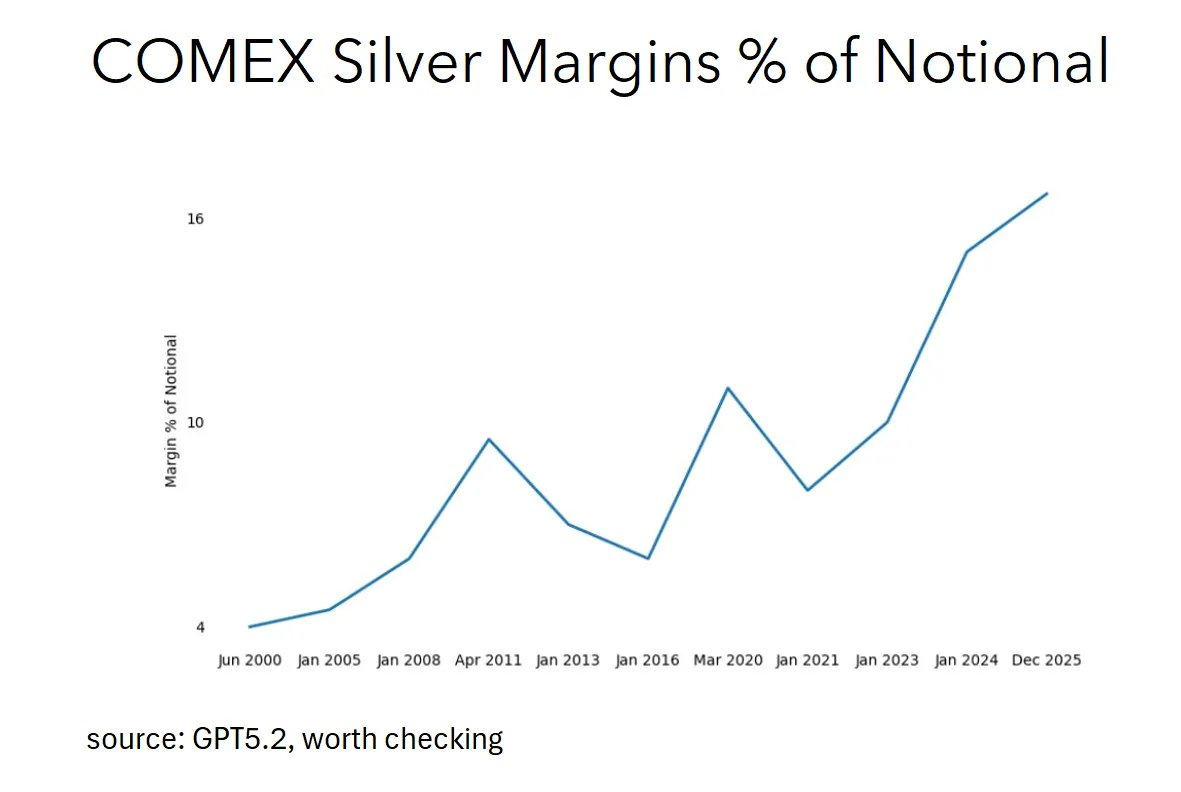
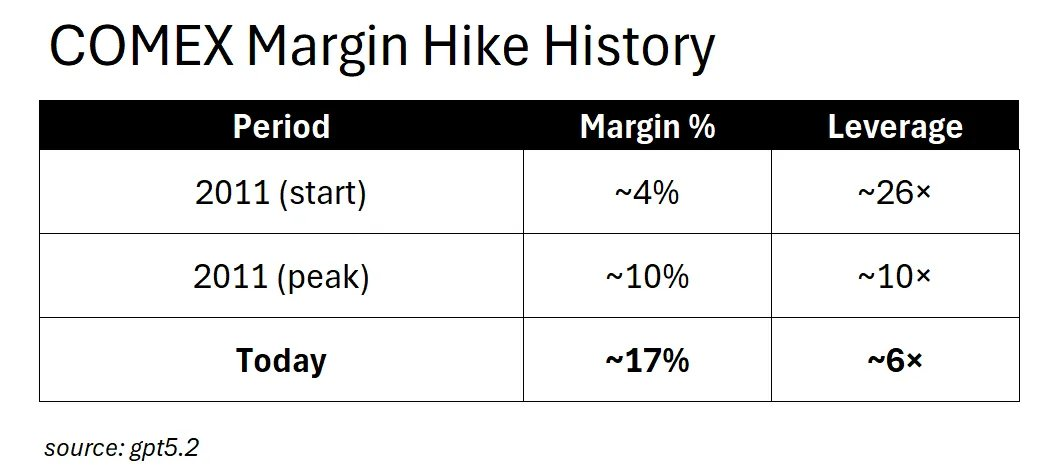
In 2011, initial silver margins were only about 4% of nominal value—meaning $4 of capital controlled $100 worth of silver, equivalent to 25x leverage, extremely risky. Then, CME raised margins to ~10% within weeks, dropping leverage from 25x to 10x, triggering a cascade of forced liquidations that killed the rally.
Today? Current silver margins are already around 17%, equivalent to 6x leverage—stricter than even the harshest period in 2011.
The market is already in a post-"squeeze" margin environment. So what happens if margins rise further? Answer: It won’t trigger panic selling among speculators, because there’s little speculative leverage left to clear. Instead, it impacts hedgers more—producers locking in prices, refiners managing inventory risk, and commercial players relying on futures markets.
Raising margins to 20% won’t cause a 2011-style chain reaction of forced liquidations. The real outcome is: reduced liquidity, wider bid-ask spreads, and commercial players shifting to over-the-counter (OTC) markets. The market mechanism has fundamentally changed.
Therefore, those warning about margin hikes are fighting a "last war" (if the above analysis holds). While such talk may help build a "contrarian narrative" in the short term, its practical significance is limited.
-
Rise of "overbought" rhetoric
As the above factors emerge, you’ll hear the "chart astrology" crowd on FinTwit chanting "overbought." Technical selling often triggers more technical selling, creating a negative feedback loop.
But overbought relative to what?

The investment case for silver has nothing to do with chart lines or tea-leaf reading. Silver’s core driver lies in supply-demand fundamentals: the collision between solar panel economics (inelastic demand, with silver costing only ~10% of panel price) and rigid supply (75% of silver is a byproduct of other metals). These are the true forces behind short-term price movements.
Besides, silver has just hit an all-time high. Do you know what else hits all-time highs? Assets that keep rising.
-
Copper substitution argument
This is one of the bears’ favorite arguments: "They’ll substitute copper for silver."
Alright, there’s some merit here—but let’s run the numbers.
The reality of copper substitution (or: four years is a long time)
Bearish views on copper substitution exist, but the problem is: it’s slow.
Here’s actual math, not speculation:
Time is the key constraint
Even with unlimited funds, conversion is physically constrained:
-
There are ~300 solar cell manufacturing plants globally;
-
Converting each plant to copper plating takes 1.5 years;
-
Maximum parallel conversion capacity: 60 plants per year;
-
It would take at least 4 years to achieve 50% copper substitution.
Given these payback periods, a 1.5-year conversion time is clearly attractive for capital allocation. In other words, CFOs should be rushing to approve these upgrades.
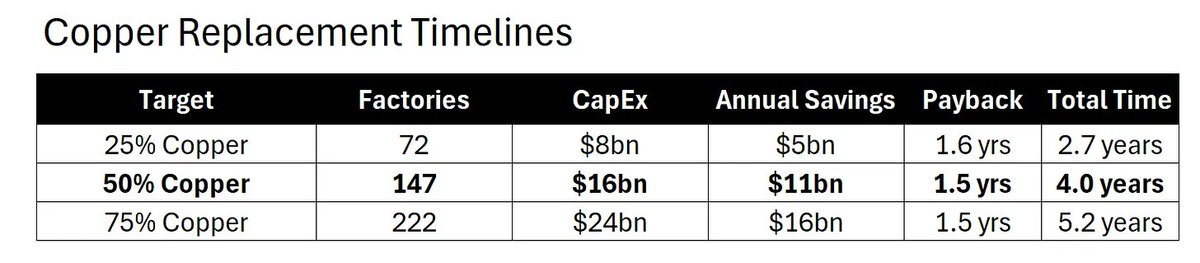
But even then, it would still take at least 4 years to convert half the industry.
Each factory must be retrofitted individually, engineers retrained, copper plating formulas revalidated, and supply chains reconfigured. All this takes time.
Demand elasticity calculation
Solar manufacturers have already absorbed a 3x increase in silver prices. Let’s see how this affects their profits:
-
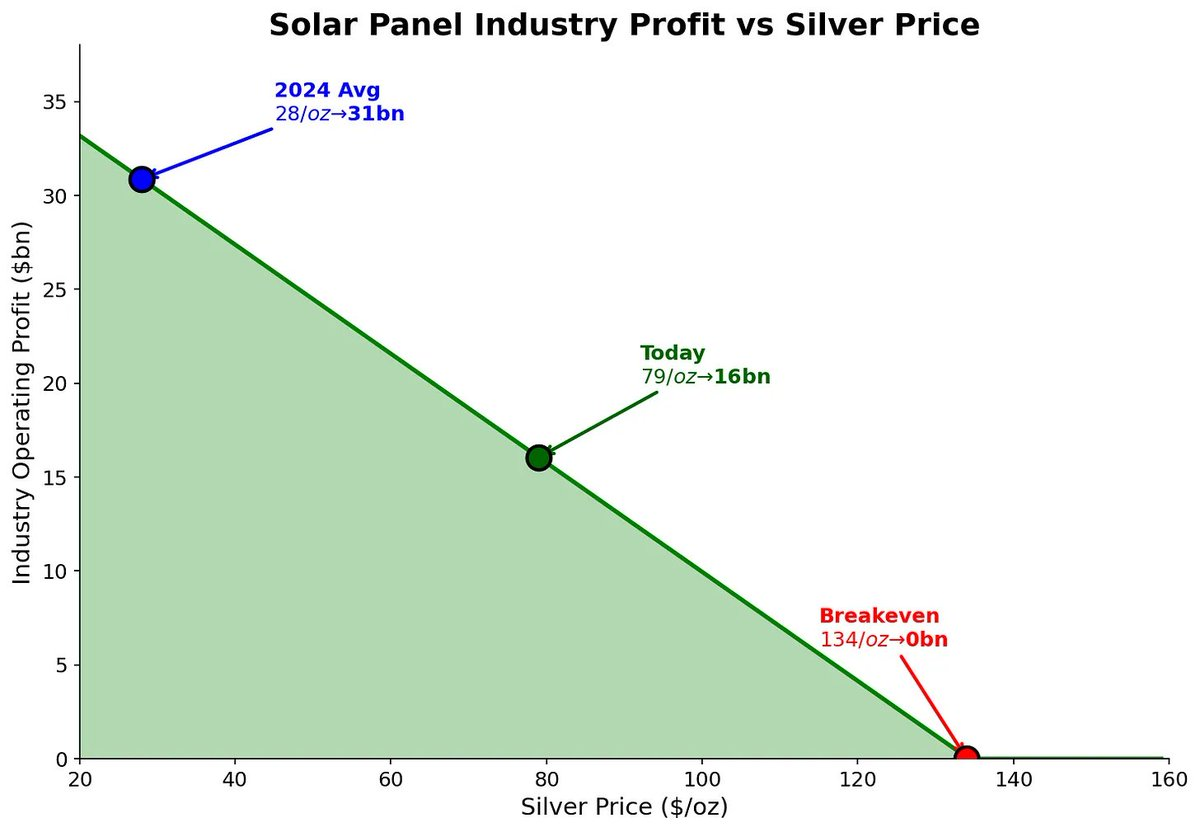
At silver prices of $28/oz (2024 average), industry-wide profit was $31 billion;
-
When silver rose to $79/oz (current price), profits dropped to $16 billion. Despite halved profits, they continue buying.
Where is the breaking point?
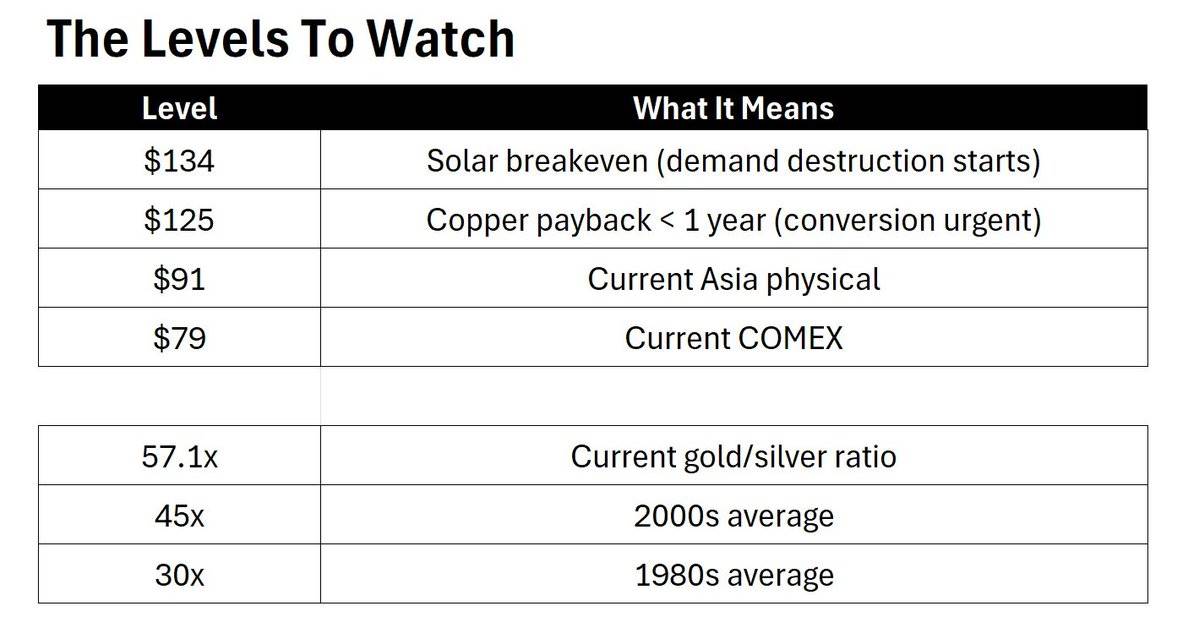
Demand destruction begins only when silver reaches $134/oz—a 70% premium over current spot prices.
Note: $134/oz is not a price target, but the threshold for demand destruction.
Urgency threshold
As silver prices rise further, copper substitution becomes increasingly economical:
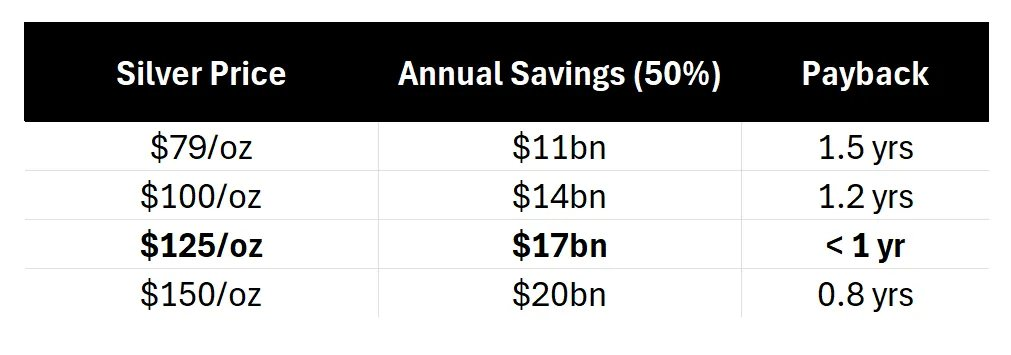
When silver hits $125/oz, copper substitution payback drops to under one year. At that point, every board meeting might center on substitution. Yet even if all firms decide tomorrow, achieving 50% substitution still takes 4 years. And $125/oz is still 50% above current spot prices.
Capital is screaming "act now," while physical reality says "wait."
Intensity paradox
Ironically, while everyone talks about "copper substitution," the solar industry is actually adopting panel technologies that use more silver:
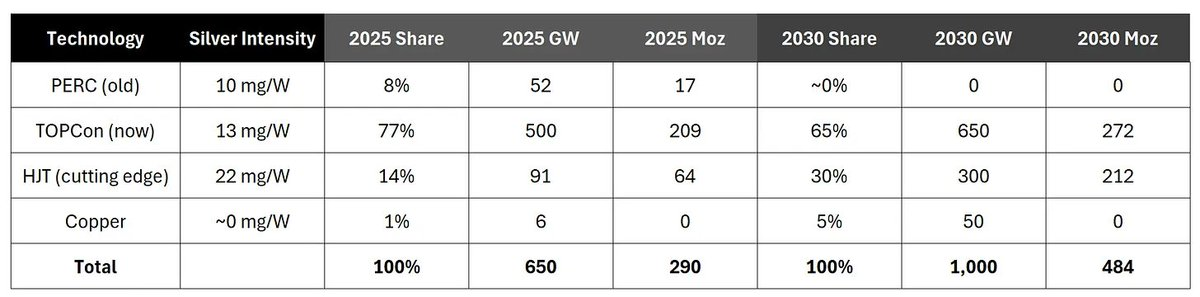
Weighted average silver usage:
-
2025: ~13.5 mg/W
-
2030: ~15.2 mg/W
The shift from PERC to TOPCon to HJT (heterojunction) technology actually increases silver use per watt, even as copper gradually replaces silver in certain areas. However, despite improving silver efficiency over time, without large-scale copper investment plans, the industry as a whole is moving toward higher silver use per watt, not lower.
Bears talk about copper substitution while the industry adopts HJT.
Conclusion on copper substitution
Time is passing—but slowly.
Silver prices are rising faster than factory conversion speeds. A 4-year window protects the bull thesis: silver has 70% room to rise before triggering demand destruction, and even if substitution starts today, it can’t catch up with silver’s rally in the short term.
Silver bull thesis (or: why this move might "rip you apart, but feel good")
Alright. We’ve covered the downside. Now let’s discuss why I remain bullish.
-
China is "weaponizing" silver
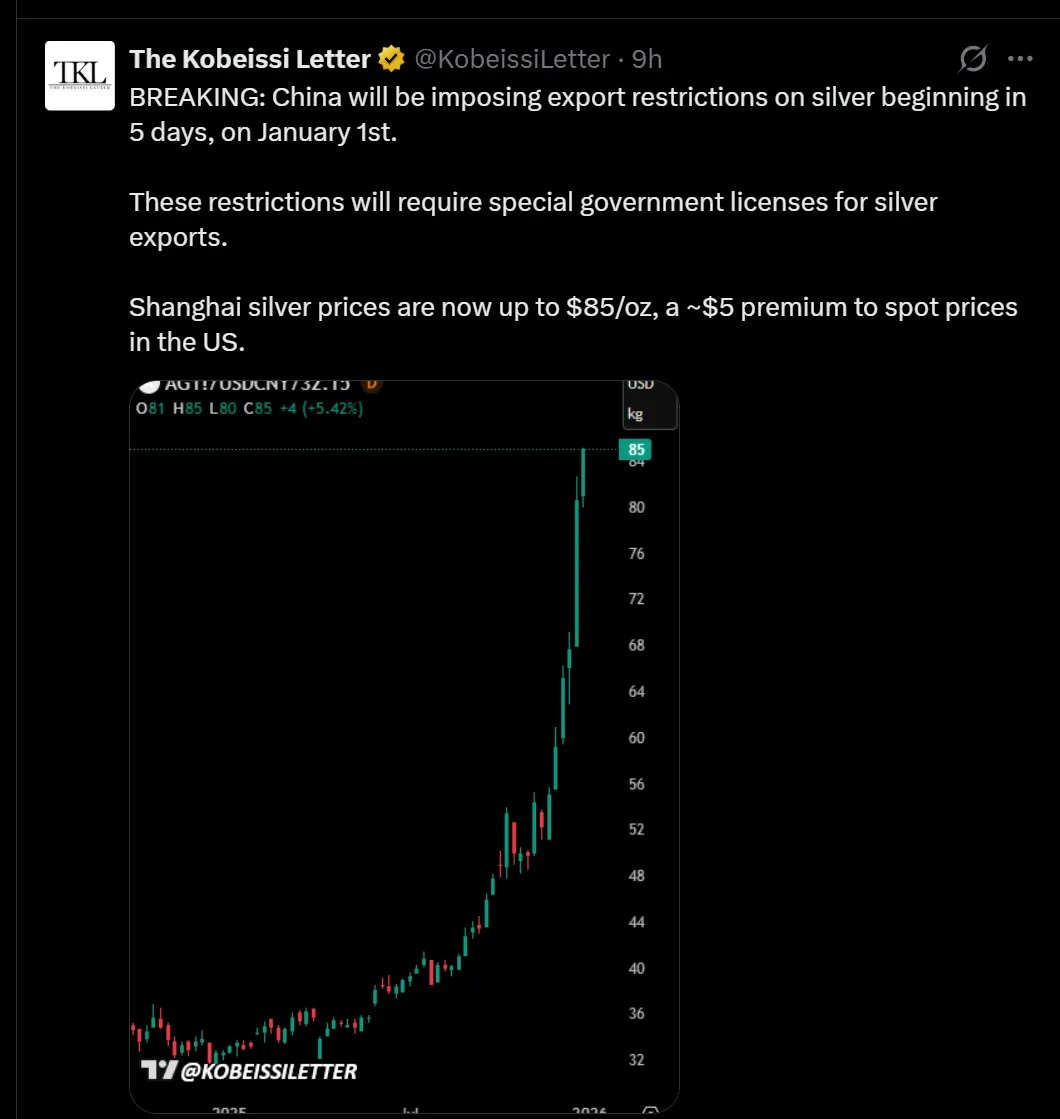
Starting January 1, China will impose a licensing system on silver exports. This is critical because China is the world’s primary net exporter of refined silver, shipping about 121 million ounces annually, almost entirely via Hong Kong to global markets.
Now, this export flow will require government approval.
A strategic resource game is unfolding.
-
Physical silver premiums are shockingly high
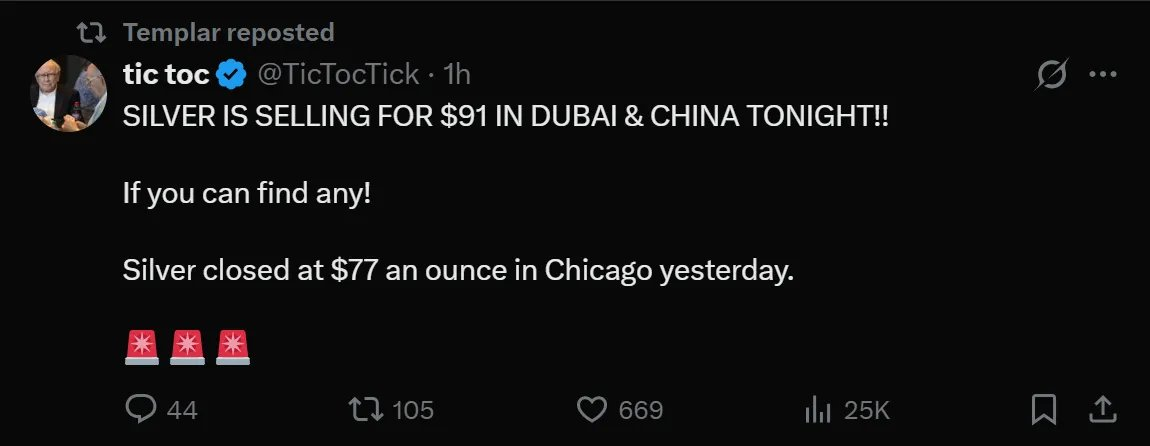
Shanghai: $85/oz; Dubai: $91/oz; COMEX: $77/oz
You live in a dollar-priced world, but marginal buyers don’t. They pay a $10–14 premium and don’t care.
When physical and paper prices diverge so drastically, one side must be wrong. Historically, it’s rarely the physical market that’s wrong.
-
"Screaming" in the London market
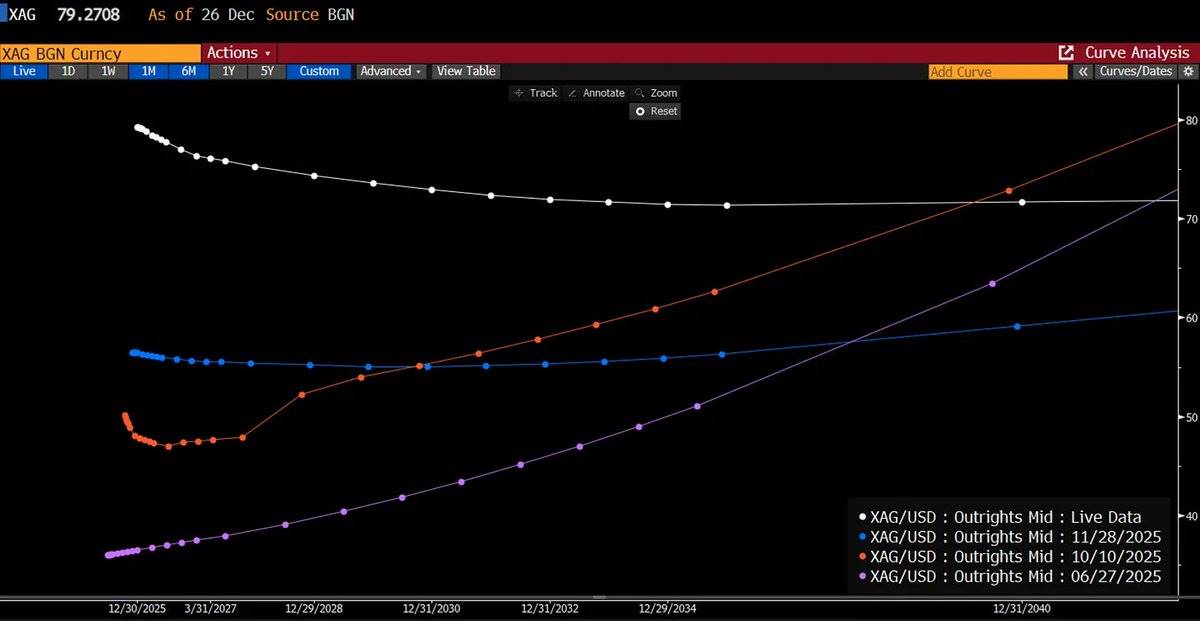
The London OTC market is the core hub where physical silver trades among bullion banks, refiners, and industrial users. Currently, it’s in the deepest backwardation state in decades.
What is backwardation?
Simply put, the market pays more for immediate delivery than for future promises. That is, spot price > forward price. This is abnormal and usually signals severe market stress.
-
One year ago: Spot at $29, curve rising to $42—a normal contango.
-
Now: Spot at $80, curve falling to $73—an inversion.
Meanwhile, COMEX’s paper market remains lazily in contango, pretending everything is fine.
Three markets, three narratives:
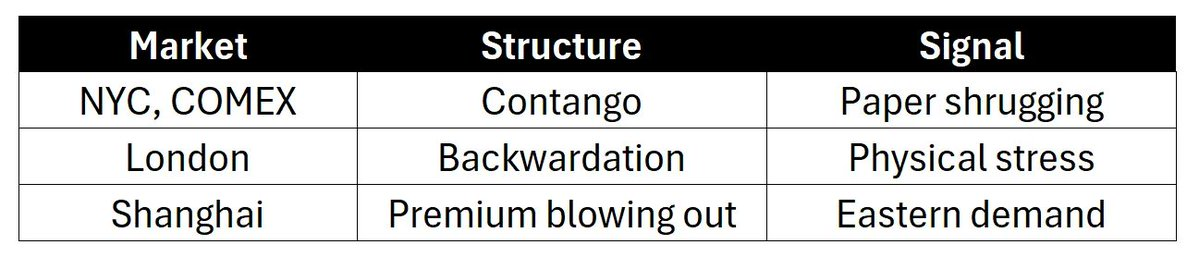
-
Volatility has been repriced
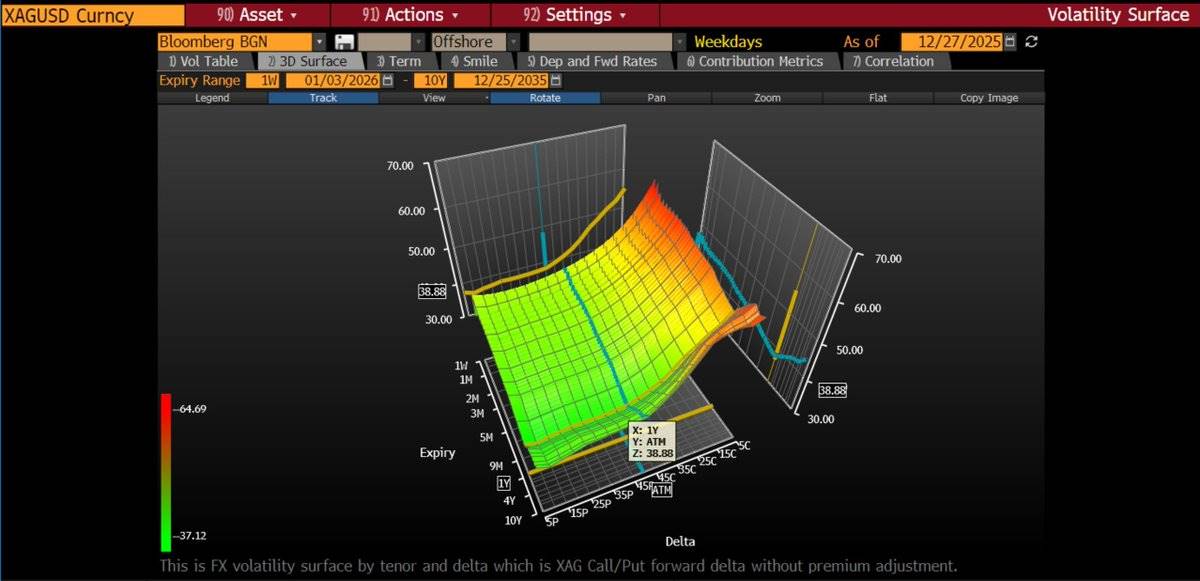
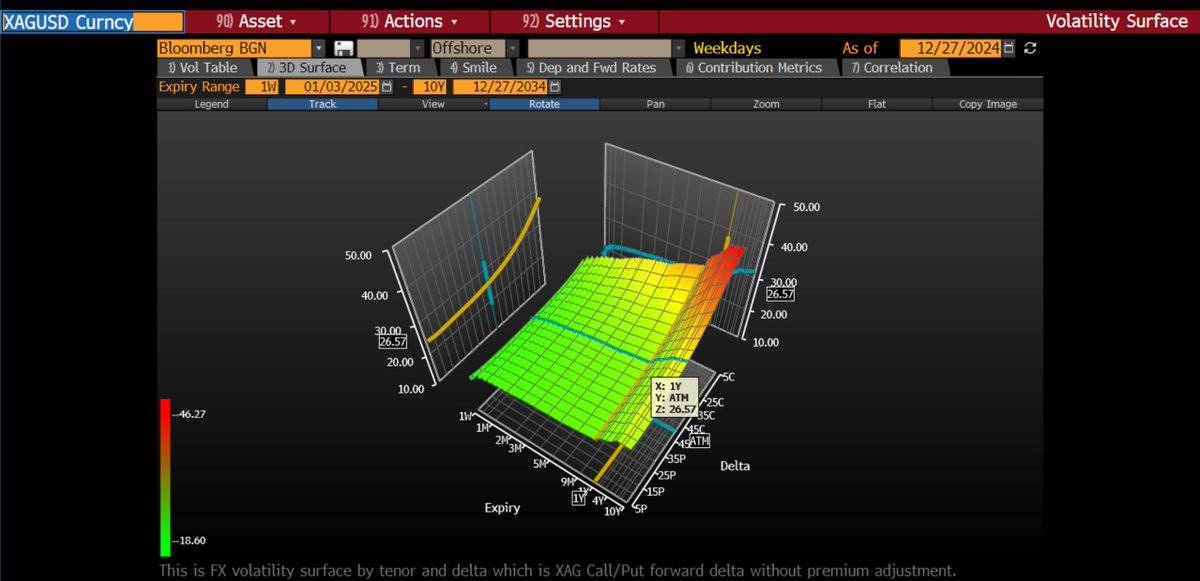
At-the-money (ATM) implied volatility has risen from 27% to 43% year-on-year. Call option volatility is steeper—out-of-the-money (OTM) strikes show implied volatilities of 50–70%. This shows the options market is pricing in tail risk for sharp upside moves.
We’ve been systematically positioning along the volatility curve by buying call spreads: buying ATM volatility while selling higher-strike calls to hedge cost. Recently, we’ve even adopted a strategy of buying 6-month butterfly spreads:
-
Buy 1 SLV (iShares Silver Trust ETF) call at $70 strike;
-
Sell 2 calls at $90 strike;
-
Buy back 1 call at $110 strike.
This reflects our short-term view: reducing Delta exposure (price sensitivity) if prices rise sharply.
-
Speculators aren’t crowded yet
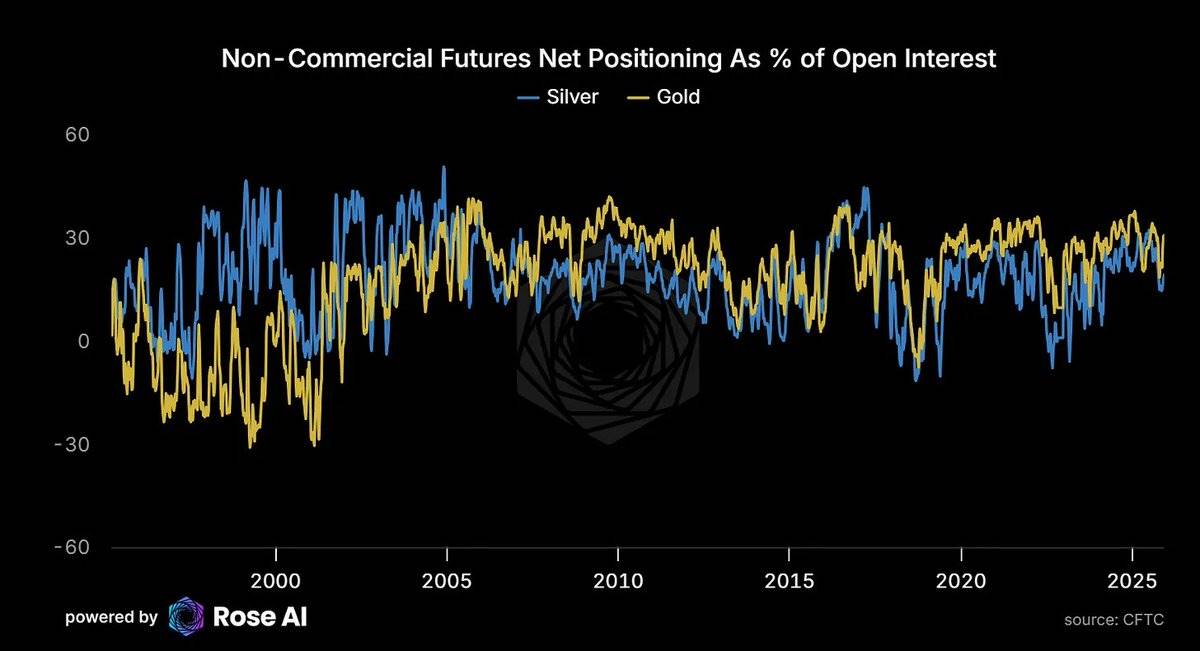
Currently, speculative net longs in gold account for 31% of total open interest, while in silver it’s only 19%. Despite price gains, speculative positioning hasn’t reached extremes, leaving room for further upside.
-
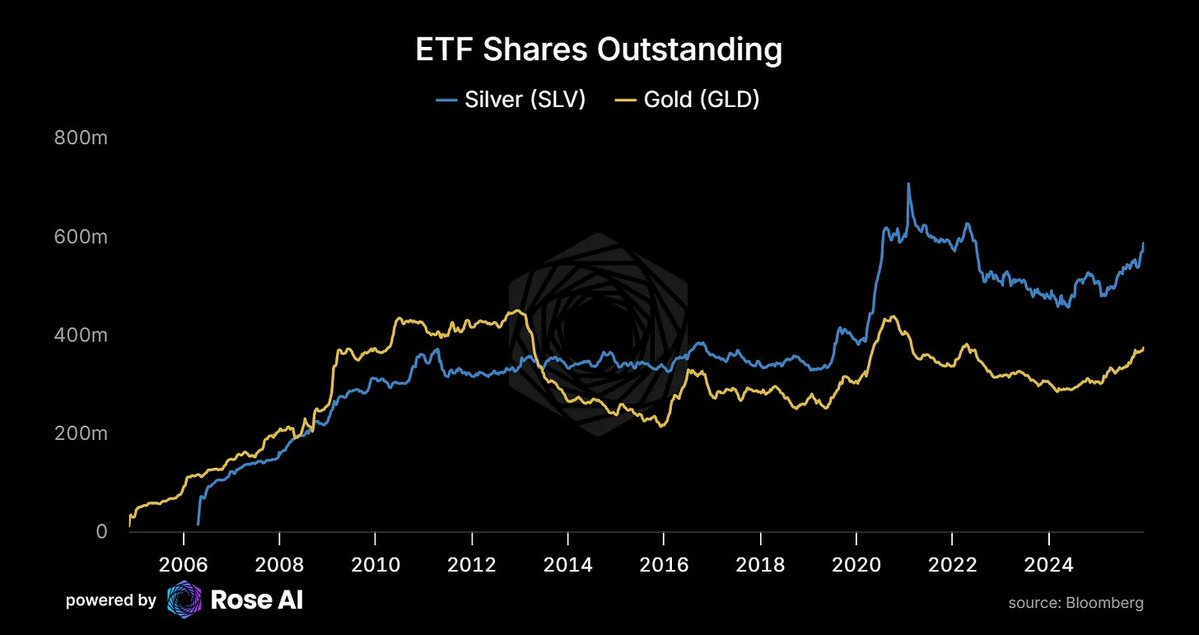
ETF demand is catching up
Investment demand rises with price, confirming our earlier prediction: silver is behaving like a Veblen good—higher prices drive greater demand.
-
SLV ETF shares outstanding, after years of outflows, are now rising again. Demand grows alongside price.
-
This isn’t typical commodity behavior—it reflects growing demand for silver as a monetary asset.
Meanwhile, Chinese market premiums persist:
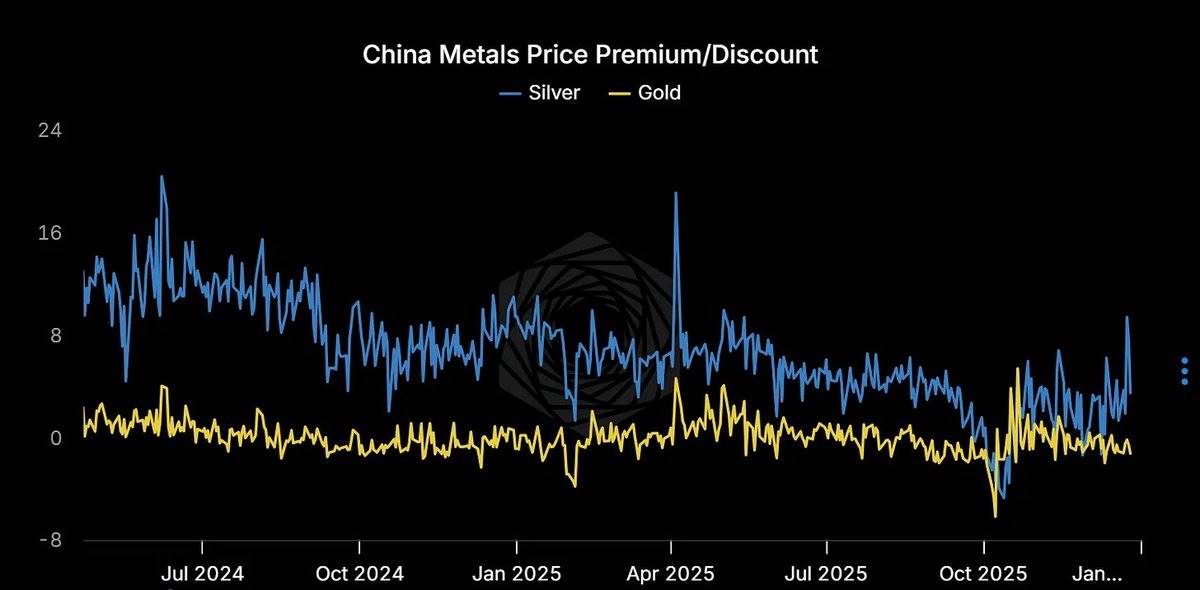
-
Western ETFs are restarting silver purchases;
-
Eastern markets never stopped demanding physical silver.
-
Solar industry "devouring" silver
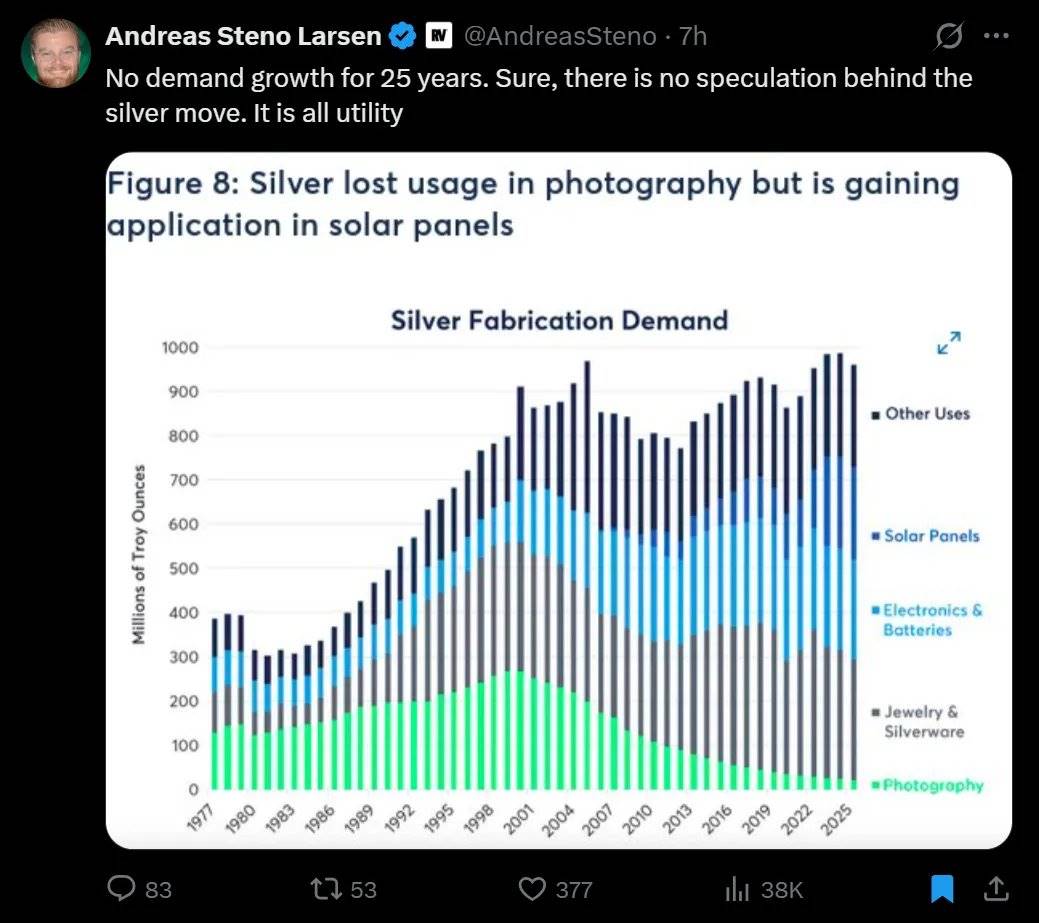
25 years of stagnant demand and supply—then solar arrived
For 25 years, silver demand barely grew, nor did supply. Then solar changed everything. As photographic demand faded, solar not only filled the gap but triggered explosive growth in silver demand.
-
Current solar demand: 290 million ounces;
-
By 2030, expected to exceed 450 million ounces.
-
Artificial Intelligence → Energy → Solar → Silver
The chain from AI to silver demand is complete:
-
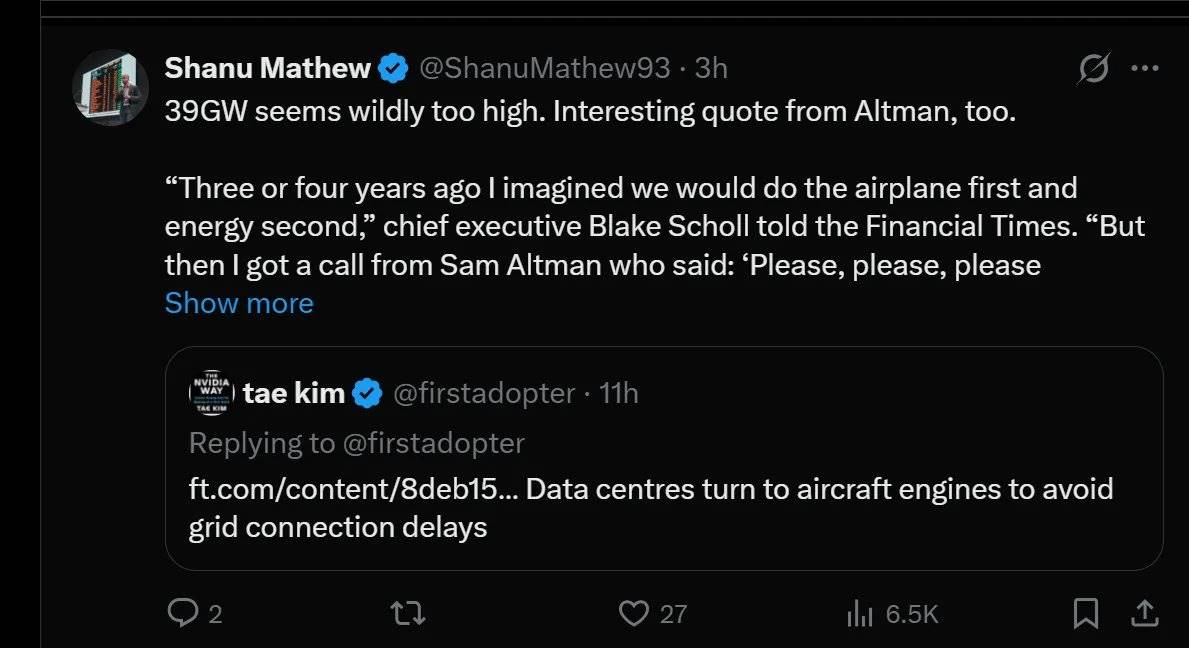
Sam Altman (OpenAI CEO) is urgently contacting companies seeking power supplies;
-
Data centers, avoiding grid connection delays, are installing jet engines as backup power;
-
Every AI query consumes electricity, and marginal new power comes from solar;
-
And solar development depends on silver.
The loop is closed.
Key prices and signals to watch
Risks to monitor
-
January tax-related selling: Investors may sell for tax reasons, causing short-term volatility;
-
Stronger dollar: A stronger dollar may pressure dollar-denominated silver prices;
-
Margin hikes: Though the "kill switch" is exhausted, further margin increases still warrant caution.
Signals to watch
-
Deepening backwardation with sideways price action: Indicates accumulation;
-
Easing backwardation with price decline: Suggests squeeze unwinding;
-
Persistent premium in Shanghai: Signals structural imbalance, not noise.
Observation framework:
Watch the curve, not the price.
If physical market stress in London persists while COMEX paper markets remain complacent, arbitrage gaps will widen until a "break" occurs:
-
Either supply surges suddenly (prices spike to release hoarded silver);
-
Or paper prices are forced to adjust to reflect physical reality.
Final summary
In the short term, bearish logic exists, and the following factors may pressure the market:
-
Tax-related selling: Year-end tax-motivated sales may cause short-term volatility;
-
Margin hikes: Potential margin adjustments may affect market sentiment;
-
Stronger dollar: Dollar strength may pressure dollar-priced silver.
However, long-term structural support for silver remains strong:
-
London market backwardation at multi-decade extremes;
-
Asian market premiums at $10–14;
-
China implements silver export restrictions in 5 days;
-
Solar demand is highly inelastic—demand destruction begins only at $134/oz, 70% above current spot;
-
Copper substitution requires at least 4 years for 50% conversion;
-
72% of silver supply is byproduct of other metals, cannot scale quickly;
-
Speculative positioning not overcrowded, ETFs steadily absorbing physical silver;
-
Volatility repriced, market pricing in tail risk for sharp upside moves.
This is precisely where markets become most interesting—and most frightening.
Advice: Adjust positions based on the above, invest rationally. See you next time!
Join TechFlow official community to stay tuned
Telegram:https://t.me/TechFlowDaily
X (Twitter):https://x.com/TechFlowPost
X (Twitter) EN:https://x.com/BlockFlow_News


