Crypto Industry Salary Report: Salaries Generally Decline, Remote Work Remains Mainstream
TechFlow Selected TechFlow Selected
Crypto Industry Salary Report: Salaries Generally Decline, Remote Work Remains Mainstream
U.S. roles still lead in cash compensation, but international positions close the gap with higher equity and token rewards.
Author: Dragonfly
Translation: Felix, PANews
Reliable compensation data in the crypto space is extremely scarce. Dragonfly previously released its first dataset and analysis report on compensation (for 2023). Now, Dragonfly has released another compensation report, covering 85 cryptocurrency companies, with data collected at the end of 2024 and the first quarter of 2025. This report also expands its scope, including data from approximately 3,400 unique employees and candidates, and compares findings with the 2023 report where applicable. Below are selected highlights from the report as curated by PANews:
Highlights
-
Most crypto companies are in growth mode, but not hypergrowth.
-
Hiring in the crypto industry has always been global; U.S.-only hiring is nearly non-existent.
-
Europe is a major international hub.
-
Base salaries and token compensation have declined across almost all levels and regions.
-
Remote work remains dominant, and most companies do not intend to change this.
-
The crypto industry is difficult to enter, with fewer than 10% of roles being entry-level.
-
Engineering dominates the workforce.
-
U.S. salaries set the benchmark for engineering leadership globally.
Compensation Overview
Overall, the crypto industry’s compensation landscape in late 2024 and early 2025 reflects a downward market, and compared to traditional industries, its pay structures remain relatively immature.
Cash compensation and token awards have declined across nearly all levels. U.S. roles still lead in cash pay, while international teams close the gap by offering larger equity and token grants. Equity distribution is uneven, especially for non-technical and non-executive roles. The U.S. pay range has narrowed, while some international roles can reach 2x to 10x U.S. levels.
By stage, the expected pattern holds: early-stage companies offer lower salaries but more equity (often double), while later-stage teams do the opposite. Tokens have become less common overall but remain significant in GTM, product, and senior international roles.
Entry-level roles have been hit hardest, with sharp salary declines and reduced bonuses, though equity grants have increased. New U.S. hires still earn higher cash compensation, but their international counterparts typically receive 2x to 3x more equity and larger token awards.
Mid-level employees face pressure, with limited growth, while senior staff fare better—experiencing smaller pay cuts, more stable equity, and increasing concentration of tokens at the top.
Senior ICs (individual contributors) and executives saw the largest compensation increases, especially in product and engineering.
Compensation Benchmarks
Below are compensation data points for roles in software engineering, crypto engineering, developer relations, product management, design, marketing, and go-to-market (GTM).
International engineering executives now earn more total compensation than their U.S. counterparts (ranging from $530K to $780K), driven by token grants approaching a 3% increase.
For crypto engineers, the trade-off between "certainty and upside" is clearer than ever. U.S. engineers lead in cash and total compensation at nearly every level, while international peers lead in equity and token grants at junior and mid levels.
Product management executives command the highest salaries across all functions ($390K–$484K), with total compensation on par with or exceeding that of engineering roles; international product managers typically receive 2x to 10x the equity of their U.S. counterparts.
Developer relations is the most “borderless” function, with nearly identical global pay ranges and minimal differences at manager and executive levels (U.S. leads in equity and total compensation; international leads in tokens).
Design leadership is less valued than senior designers. In the U.S., IC designers (lead/senior) surpass managers—and even some executives—in total compensation.
Marketing shows geographic disparities in pay and ownership. The U.S. leads in salary and total compensation, while international firms offer equity around 3x to 10x U.S. levels.
GTM total compensation gaps narrow at entry and manager levels. Senior ICs out-earn managers in total compensation, while international business leaders win in equity.
Founder Compensation
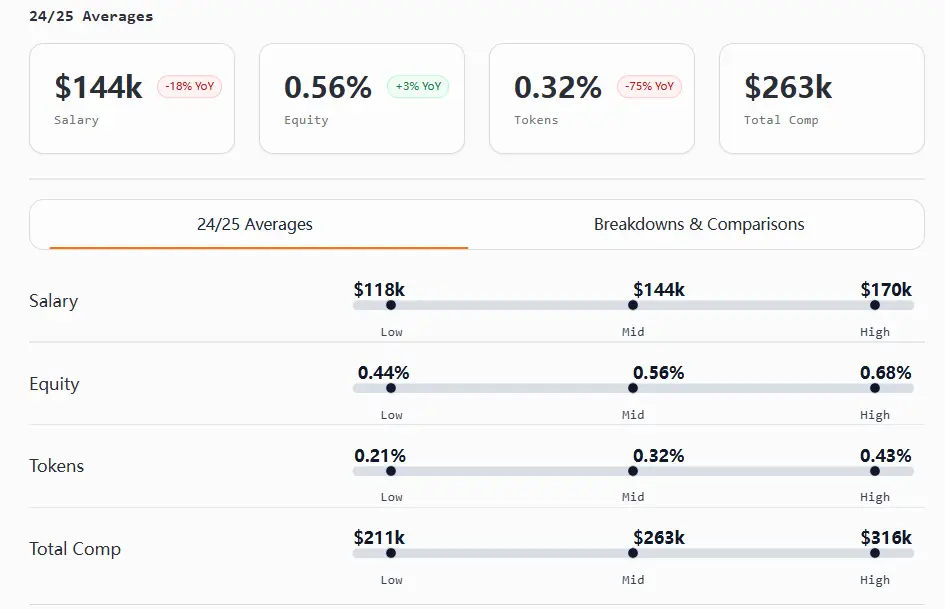
In this report, company ownership is split into equity and tokens (unlike the previous report, which combined them). Thus, salary analysis is reported year-over-year, while equity and token data reflect 2024/2025 figures.
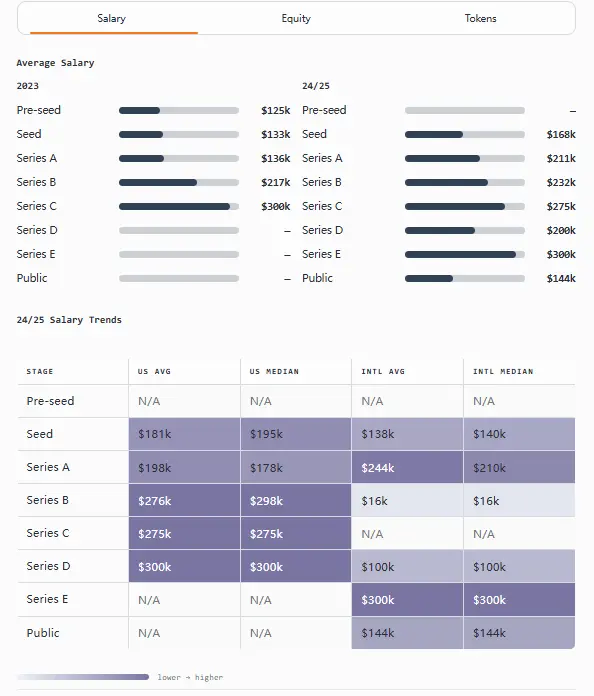
Compared to last year, founder compensation has increased. Overall, the higher the funding raised, the higher the salary and the lower the equity share (as expected).
U.S. founders generally earn more in salary, equity, and tokens than their international counterparts.
Key Takeaways:
-
Founder average salary increased ~37% YoY, rising from $144K in 2023 to $197K in 2024/2025.
-
Seed-stage U.S. founders hold the highest equity share (32%).
-
Token ownership is relatively stable across regions at the seed stage (9%), but diverges significantly in later stages.
-
Rare exception: At Series A, international founders report higher salaries than U.S. founders ($244K vs. $198K), while U.S. founders hold more tokens (13% vs. 9%) and slightly more equity (20% vs. 19%).
-
Rare exception: At Series B, international founders report the highest equity share (30%), but this is based on limited data and should be interpreted cautiously.
Bonuses and Variable Pay
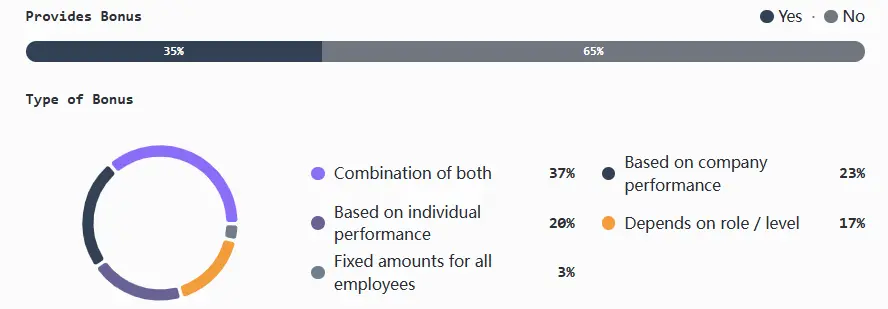
Bonus usage decreases as companies scale: smallest and earliest-stage teams are most likely to experiment, mid-sized firms adopt selectively, while later-stage and infrastructure-focused companies phase them out in favor of long-term incentives.
Where bonuses exist, they are typically tied to a mix of company and individual performance. Pure company-linked, pure individual-linked, or role/level-based models are less common, and fixed bonuses are rare.
Key Takeaways:
-
Bonuses peak in the smallest companies (1–5 employees) and early stages (seed/Series A), especially among firms raising $5M–$19.9M.
-
CeFi adoption is highest at 71%; DeFi at 50%, primarily U.S.-driven and more focused on individual performance; infrastructure/L1/L2 adoption is much lower (15–30%), usually hybrid models.
-
U.S. bonus practices are more favorable, especially for mid-sized teams.
-
Exception: Some well-funded post-Series C teams report “overwhelming application volume” due to surging hiring needs and brand recognition.
-
Exception: Infrastructure companies face the broadest challenges: 63% cite talent shortages, 27% mention compensation issues, 5% competition, and 5% remote/global hiring (the only sector to mention this).
Token Compensation Analysis
Many teams increasingly separate token grants from equity when calculating compensation. In later stages, it's common to tie grants to fair market value, often using time-weighted average price (TWAP).
For vesting, most teams follow a four-year schedule with a one-year cliff, though some experiment with hybrid models combining time-based and milestone-driven unlocks.
Most companies issue tokens from a dedicated employee pool; only a few very large organizations still allocate grants from the total supply, and this is becoming rarer.
Compensation Mix (Cash, Tokens, Equity)
Early teams heavily rely on equity to maintain token flexibility. Mid-sized organizations often shift to hybrid models (equity + tokens), offering risk-adjusted structures and additional liquidity. Most late-stage companies revert to equity after corporate valuation and token liquidity stabilize.
Key Takeaways:
-
Nearly half of international teams (44%) offer tokens only. U.S. teams are the opposite: only 39% offer equity only.
-
Early companies rely heavily on equity (~71% when headcount is 1–5); hybrid compensation peaks at Series A, then gradually shifts back toward equity (45% at Series B, 71% at Series C).
-
Protocol-intensive areas like L1, L2, and DeFi naturally favor token-centric compensation, while infrastructure, consumer, and CeFi companies default to equity.
-
Prior to TGE, nearly one-third offer only equity and token compensation, with hybrid at 32%; once live, teams heavily rely on tokens (47% token-only, 47% hybrid), with pure equity nearly extinct.
-
Rare exception: A small minority (5%) offer cash-only compensation.
Equity/Token Relationship (Ratio)
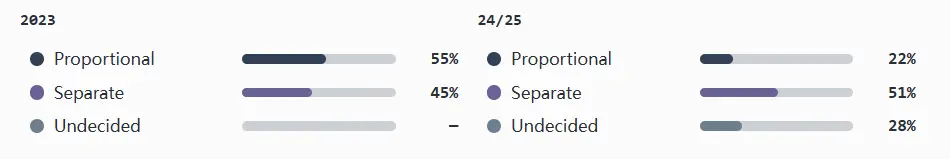
Only a few teams establish a ratio between equity and tokens—i.e., determining future token grants based on an individual’s equity stake.
This is common pre-TGE, but as companies mature, nearly all sever this link. In later stages, equity and tokens are seen as entirely separate.
Key Takeaways:
-
51% of companies treat tokens and equity as independent compensation components (no ratio); this becomes universal by Series D and beyond.
-
Ratio models remain most common at seed/pre-TGE (33%), but decline overall as companies scale.
-
Case: 90% of L2 companies have no ratio relationship, and none are undecided.
-
Geography does not influence ratio relationships.
Vesting Schedules and Start Date Conventions
Pre-TGE companies (especially in DeFi and L1) typically begin vesting at TGE to manage retention and circulating supply. Teams with liquid tokens usually start vesting on the employee’s start date (most common approach). These practices are largely consistent between U.S. and international teams, with key differences mainly among pre-TGE firms.
Most companies use standard time-based vesting, typically over four years with a one-year cliff.
A few teams explore performance-linked vesting or a combination of performance and time. There are reports that teams are cautious about tying vesting to network-level KPIs (which individuals can't control), instead focusing on auditable product, team, and personal milestones.
Key Takeaways:
-
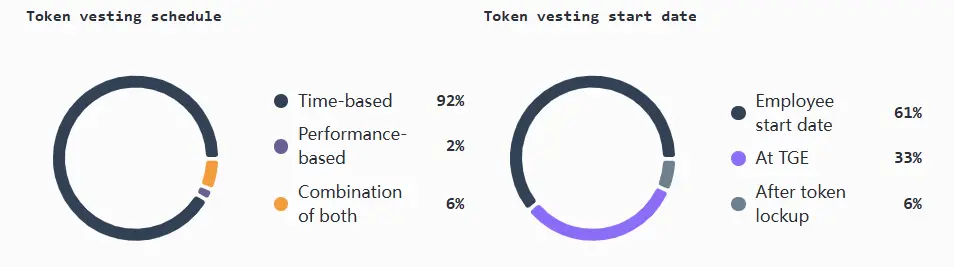
61% of companies begin vesting on the employee’s start date.
-
59% of pre-TGE teams begin vesting at TGE.
-
Vesting arrangements are highly standardized: 92% use time-based vesting, typically over 4 years with a 1-year cliff.
-
Exception: Only a few deviate from standard time-based vesting: 6% use hybrid time/milestone models, 2% rely entirely on performance-based terms.
Geography and Remote Work
Hiring Footprint
Global-first is the default: most teams hire across borders from day one. Talent access and flexibility are generally prioritized over geography.
U.S.-only hiring is rare, mostly seen at seed and Series A, and fades as companies grow. International-only hiring remains steady across stages and sizes, often reflecting cost-sensitive hiring strategies.
Key takeaways:
-
Globalization is the default from day one: 81% of companies hire in both the U.S. and globally.
-
Smaller teams tend to go global earlier. Companies with 21–100 employees and $20M–$40M in funding are the most consistent, even more so than larger firms.
-
Infrastructure teams are most likely to hire globally, at 80%.
-
Rare exception: U.S.-only hiring is nearly non-existent (6%), primarily used by early-stage consumer and DeFi teams, but even they abandon it as they scale.
International Employee Locations
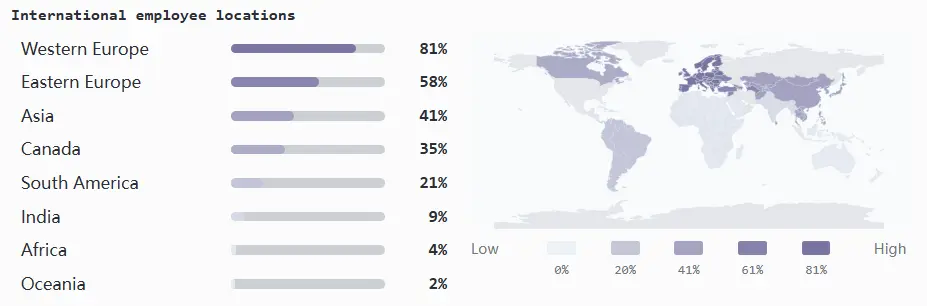
Western Europe is the primary international hiring hub.
As companies mature and require stronger local operations, regional hiring often shifts during late Series B, expanding into Asia, Canada, and Eastern Europe.
Key Takeaways:
-
Western Europe: 84% of companies at Series B–E (and similar proportion with >$40M raised) employ staff locally.
-
Eastern Europe: 63% of late-stage companies hire here, attracted by strong engineering talent and cost efficiency.
-
Asia: Hiring nearly doubled YoY (from 20% to 41%) to meet stronger market demand.
-
Canada: 38% of Series B–E companies expand into Canada, leveraging proximity to the U.S., favorable regulation, and developer base as a hedge.
-
South America: Only 13% of Series B–D companies expand here.
-
Rare exception: India (9%), Africa (4%), and Oceania (2%) remain underpenetrated.
Regulation-Driven Hiring Shifts
From 2023 to 2024, regulation emerged as one of the top external factors affecting crypto talent strategy. In the U.S., heightened scrutiny around trading, custody, and protocol activity made compliance a key factor in hiring decisions.
However, looking back at 2024 and early 2025, regulation had minimal impact on driving companies to hire outside the U.S. Adjustments were mainly seen among larger, better-funded teams in infrastructure and DeFi (most likely to hold or issue tokens) and in CeFi (subject to stricter oversight).
Companies with both U.S. and international teams were most likely to cite regulation-driven actions, while U.S.-only firms mostly did not react, with only a few considering changes.
Key Takeaways:
-
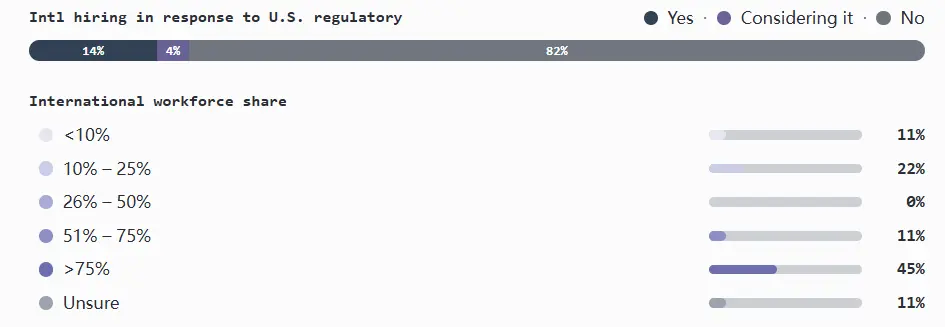
Only 14% of companies adjusted hiring strategies due to regulatory pressure.
-
Nearly a quarter of companies with both U.S. and international staff said regulation directly prompted expansion of international hiring.
-
Among companies with only international employees, most were already global for other reasons, but 21% acknowledged regulation played a role.
Remote and Hybrid Work Policies
The crypto industry remains predominantly remote, with most companies operating fully distributed. Hybrid models—combining remote work with mandatory office days—are second. Remote-first (optional office attendance) occupies a smaller middle ground, and fully office-based companies are rare.
Both models are strongly entrenched, and policies are hard to change: nearly all teams plan to maintain their current setup.
Key takeaways:
-
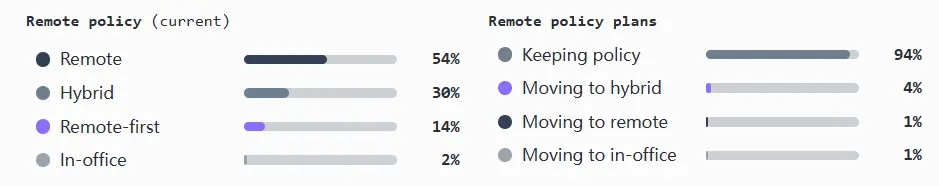
Over half of companies are fully remote, over a quarter use hybrid models, and remote-first accounts for a small 14%.
-
94% of companies have no plans to change their policy.
-
U.S. teams lean more toward remote (55%), while international peers prefer hybrid (35%).
-
Series A teams show mixed work styles, but by Series B, remote work reaches 73%.
-
Rare exception: Only 2% of companies are fully office-based.
Organizational Structure and Hiring Trends
Team and Level Composition
The crypto industry has long been engineer-dominated, a trend evident across all sizes, stages, and funding rounds from pre-seed to post-Series B. International teams skew even more toward engineers, while product and marketing leadership roles are concentrated in the U.S.
In terms of team evolution: seed-stage teams are mostly engineers; Series A to B adds senior PMs, designers, and GTM teams (with few managers); post-Series B adds structure in GTM and engineering.
Notably, entry-level hiring is scarce, limiting talent pipelines and diversity and making it harder for newcomers to break in (especially in product and marketing). Executive hiring outside engineering is also limited.
Key Takeaways:
-
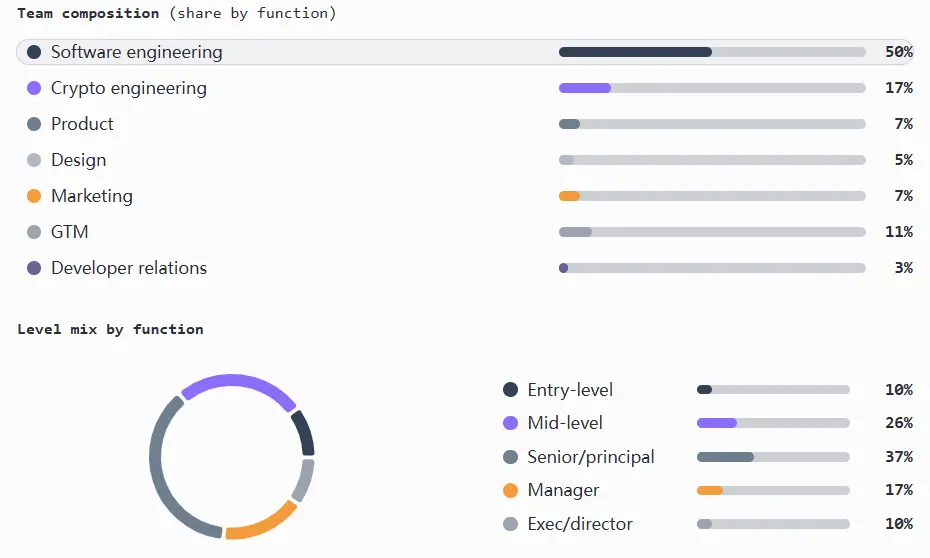
Engineering (software and crypto) roles make up ~67% of total headcount across all sizes, stages, and funding rounds.
-
Entry-level roles account for only 10% of all positions.
-
Product teams are understaffed, with over half of PMs at senior or executive levels.
-
Marketing teams are small, representing only 7% of total staff, slightly higher internationally.
-
GTM roles make up 11% of staff, mostly mid-senior level.
-
Developer relations accounts for 3% of staff, mostly mid-level, with compensation comparable to other functions.
-
Design teams are senior-heavy, lacking leadership: ~44% at senior level, with fewer than 10% in manager or executive roles.
-
Outside engineering, teams are lean: marketing/engineering ratio is 1:14, product/engineering is 1:13.
-
Rare exception: In some international teams, the product manager to engineer ratio reaches 1:20.
Hiring Momentum by Function
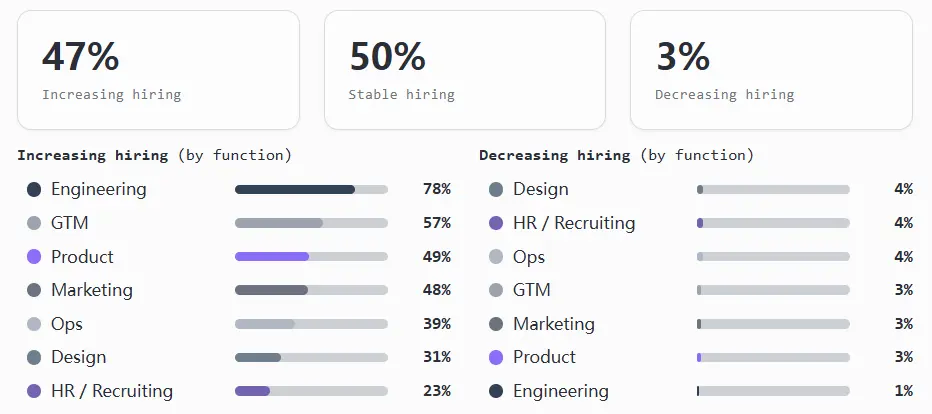
Most teams are in targeted growth mode, not hypergrowth. Overall, companies are streamlining support teams while selectively expanding core functions, many intentionally keeping headcount flat, with few planning overall reductions.
Hiring momentum aligns with the above composition. Engineering is clearly the priority, while product and marketing grow steadily but cautiously. GTM (sales, marketing, operations) hiring accelerates during expansion phases and in infrastructure and finance sectors, but slows in consumer, gaming, and NFT firms. Design remains underbuilt, and operations and HR/recruiting are flat, potentially creating bottlenecks as technical teams grow faster than internal support.
Key Takeaways:
-
Engineering leads in growth: ~78% of teams are expanding, only 1% are cutting. It’s also the only function with a real entry-level hiring pipeline.
-
GTM hiring increases with stage: 57% of teams are expanding, 40% are flat.
-
Product and marketing remain stable: about half of teams are growing, half are flat.
-
Few teams expand broadly; most grow in 2–4 functions while holding others steady, possibly to simplify hiring.
-
GTM only expands once senior and executive talent is in place, and companies rarely hire junior roles.
-
Slower growth often follows teams with high shares of senior talent; once senior/executive roles in product, design, or engineering are filled, these functions tend to stabilize and slow hiring.
-
Overall headcount reductions are rare (3%), slightly higher in design, operations, and HR/recruiting.
Join TechFlow official community to stay tuned
Telegram:https://t.me/TechFlowDaily
X (Twitter):https://x.com/TechFlowPost
X (Twitter) EN:https://x.com/BlockFlow_News