

ArkStream Capital: The Guide to Rebirth for Crypto VCs - Why Outperforming BTC Is So Difficult
TechFlow Selected TechFlow Selected
ArkStream Capital: The Guide to Rebirth for Crypto VCs - Why Outperforming BTC Is So Difficult
For VCs, the role hasn't disappeared but has shifted toward more practical value creation.
How long has it been since you last heard the term Web3? As the crypto market shifts from "Web3" back to "cryptocurrency" narratives, investment firms are undergoing a dramatic reshuffling—and we’re witnessing it all unfold.
The result of this “narrative regression” is clear: Bitcoin and Ethereum continue hitting new highs, while the altcoin season remains elusive. Holding tokens in anticipation of price surges may be wishful thinking; a harsher reality is that since 2022, declining returns from early-stage investments have consistently hit venture capitalists (VCs) who follow the "Vintage investment theory." This article systematically reviews financing data and market structure changes from Q1 2022 to Q2 2025, uncovering the deeper reasons behind the crypto primary market’s sharp transition—from peak prosperity to shrinking returns.
We aim to answer two core questions:
1. What challenges do crypto VCs face today?
2. Under the new cycle logic, how should investment firms engage with this market?
As long-term participants in the primary market, ArkStream Capital has observed that since its 2022 peak, the market has experienced severe capital contraction and cooling fundraising activity, reaching a low point in 2023. While overall fundraising volume rebounded somewhat in Q1 2025, growth was concentrated in a few massive funding rounds. After excluding these outliers, market activity remains weak.
Parallel to this trend is a shift in VC strategies and preferences:
-
Investment stages are shifting from early to later rounds, reflecting significantly reduced risk appetite: Data shows that early-stage funding (Seed and Pre-Seed) maintained a share above 60% from Q1 2022 to Q3 2023 (peaking at 72.78%), but then began fluctuating downward. By Q1 2025, early-stage deals dropped below 50% for the first time since 2022, falling to 47.96%.
-
Narratives have shifted from application-driven sectors like Social, NFT, and GameFi toward DeFi, infrastructure, and RWA—areas emphasizing utility and long-term value. Comparing Q2 2022 and Q2 2025, NFT/Games/Social funding plummeted from 129 deals to just 15. Meanwhile, Infrastructure/DeFi/CeFi accounted for 85.8% (97 out of 113) of total deals in Q2 2025, becoming the absolute core of the market.
-
The market is debunking the myth of "paper wealth" under high FDV models: Analysis of 75 investments reveals that the number of deals generating over 10x returns dropped sharply—from 46 at the peak to only 6. Meanwhile, 24 investments (32%) and 18 projects (42.85%) now trade below their private round valuations.
-
Even Binance's "listing effect" is failing, with "pump-and-dump" becoming the new normal: Data shows that while 25 projects still saw over 10x gains on their first day in 2024, by 2025, 42 projects had fallen below their issue price within seven days of launch—indicating that relying solely on top-tier exchange listings to drive valuations no longer works.
-
Although the timeline from fundraising to TGE is lengthening, this hasn't led to higher success rates: Among over 17,000 assets tracked by Coingecko, trading volumes for those ranked beyond #1500 are nearly zero. Even projects backed by elite VCs like Polychain Capital face a failure rate as high as 26.72%.
-
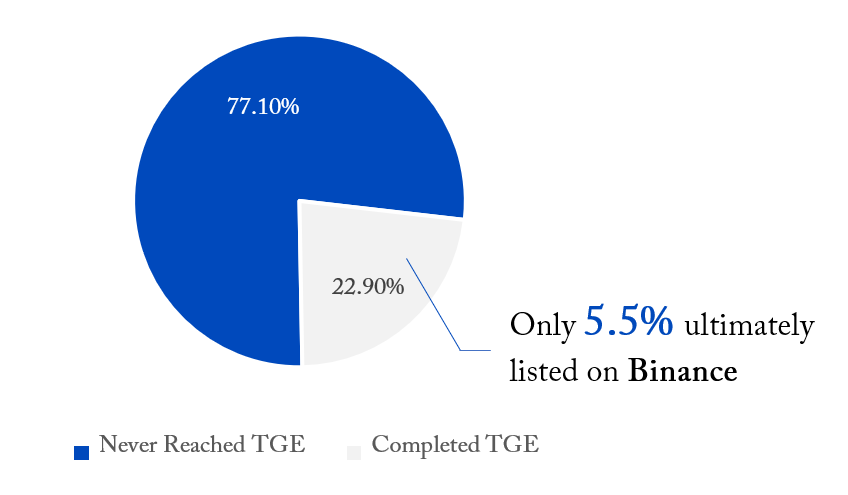
The traditional VC investment logic in the crypto primary market has failed: With 77% of projects unable to launch tokens, only 5.5% eventually make it onto Binance. Yet even these top-tier projects deliver average returns of just 2–5x—far too low to offset losses from the remaining 94.5%, and insufficient to meet even a simplified breakeven model requiring 4.3x returns. Mathematically, portfolios can no longer generate profits.
Note: Analytical results are based on top-tier crypto VC investment cases from Western markets and major exchanges. The sample is representative but does not cover the entire industry—see detailed analysis later.
We believe this downturn in returns isn’t merely due to tightening liquidity from rate hikes, but reflects a fundamental paradigm shift in the crypto primary market: from valuation-driven to value-driven investing, from broad-spectrum bets to high-certainty plays, and from chasing narratives to betting on execution. Understanding and adapting to this shift may become essential for achieving outsized returns in the next cycle.
Primary Market Data Overview: Heat and Cycle Evolution
Global Crypto Primary Market Funding Overview
Primary market investment data measures whether the market is willing to fund innovative ideas. Higher investment levels indicate greater willingness by risk capital to bet on the sector’s future. Whether it’s composability in DeFi, the Web3 vision of “readable, writable, ownable” data, or continuous improvements in privacy, decentralized storage, and scalability—all depend on sustained venture capital backing. Alongside capital inflows come talent surges; primary market vitality often manifests through a steady stream of entrepreneurs innovating in the space.
This metric peaked in Q1 2022, with $12.4 billion raised across 588 deals. Since then, the market sharply declined into a prolonged downturn, with both total funding and deal count dropping steadily. By Q4 2023, quarterly funding fell to $1.9 billion and deal count to 255—reaching a cyclical bottom. Though there was slight recovery in 2024, the overall market remained subdued.
Q1 2025 showed signs of surface-level recovery: total funding rose to $5.2 billion across 271 deals. However, this “rebound” doesn’t hold up under scrutiny. Over 40% of that quarter’s total came from Abu Dhabi’s sovereign fund MGX investing ~$2 billion in Binance—an outlier event. Additionally, World Liberty Financial’s $550 million ICO significantly inflated the numbers. Excluding these mega-deals, actual funding for native crypto projects was around $2.65 billion. In Q2 2025, the decline continued. Deals like SharpLink, BitMine, Digital Asset, and World Liberty Financial require separate treatment and shouldn’t be seen as normal VC activity. From Q1 2025 onward, a clear divergence emerged: native crypto VC funding kept contracting, while traditional finance capital surged in, making bold moves in equity markets. Behind the apparent growth lies accelerating concentration into low-risk projects—true venture activity hasn’t genuinely recovered.
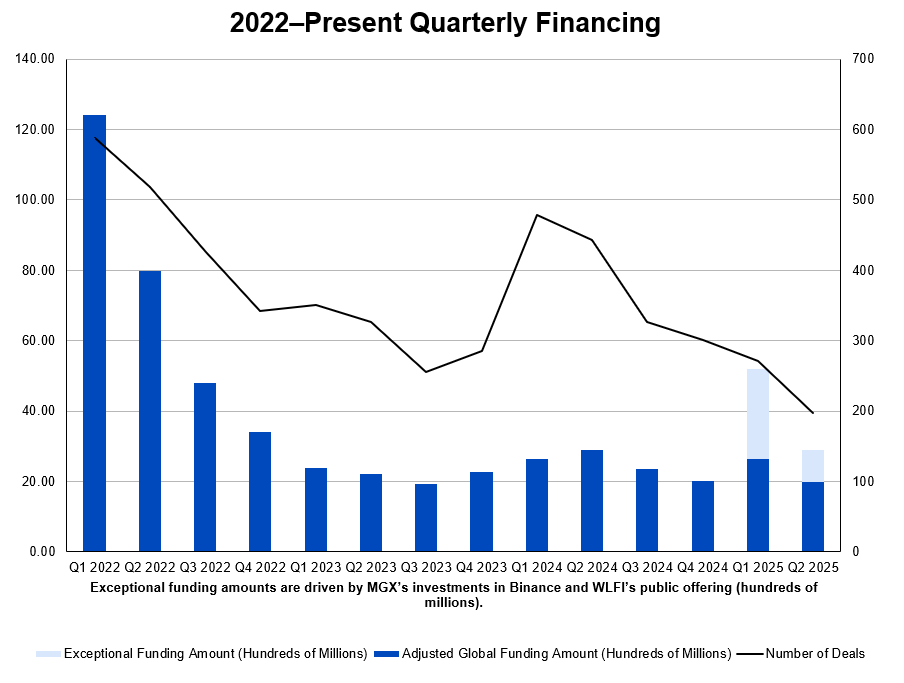
Figure: Quarterly Financing, 2022–Present
Source: RootData Funding Dashboard
This downward trend shows a clear negative correlation with Bitcoin’s market dominance. Despite Bitcoin’s significant rise since early 2023, primary market fundraising hasn’t followed suit—breaking the historical pattern where rising BTC prices fueled increased VC activity.
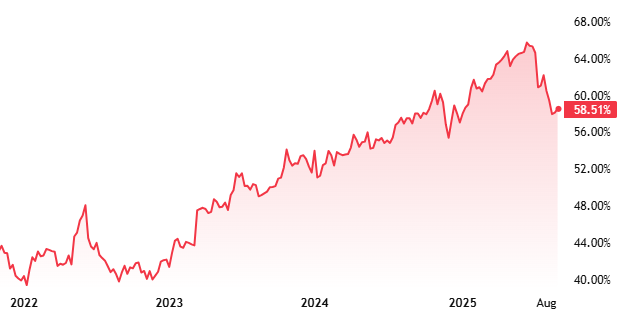
Figure: Bitcoin Market Cap Dominance, 2022–Present
This means altcoin market sentiment is no longer solely tied to Bitcoin’s price. On the contrary, as Bitcoin rises, confidence in altcoins continues to erode. The 2022 downturn reflected macroeconomic retreat; the 2023 lows signaled collapsing market confidence. The Q1 2025 rebound was largely driven by a few strategically valuable or well-capitalized projects, marking the primary market’s entry into a new phase of “selective concentration.” The era of “many flowers blooming” is over—the tide of “Web3” narrative-driven waves is receding.
For VCs, this signals the end of the “spray and pray” era. Reassessing certainty, strengthening fundamentals screening, and exit path evaluation have become the new norm. Amid declining overall returns, rising Bitcoin prices without corresponding capital inflows mean VCs can no longer rely on macro bull markets to lift all boats. Instead, focus must shift to technological moats, business model resilience, and real user value to meet investors’ heightened demand for stable returns.
Mainstream Institutional Investment Activity Analysis
In an environment where overall market performance falls short of expectations, VCs still active in crypto have had to adapt—from “many paths lead to Rome” to pursuing more certain, repeatable strategies.
First, investment preferences are shifting from early to later-stage projects. In Q1 2025, early-stage funding dropped below 50% for the first time since 2022—a historic inflection point. This indicates that amid increasing uncertainty in exit paths and resource concentration among top projects, institutions increasingly favor “certainty,” preferring mature projects with proven products and clear revenue streams. Meanwhile, the share of Pre-Seed and Seed deals has declined, though still within a relatively healthy range, indicating that early-stage entrepreneurial energy persists—but fundraising thresholds have risen significantly.
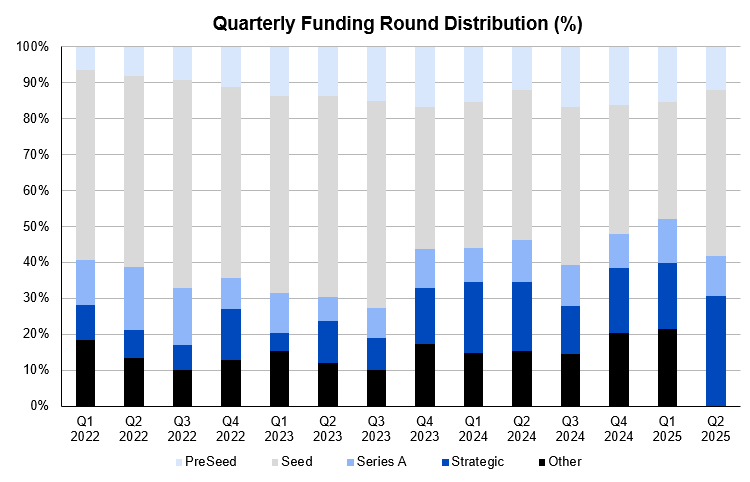
Figure: Quarterly Funding Round Distribution (%)
Source: RootData funding records, grouped by quarter and round
Second, sector preferences are becoming more concentrated. Starting Q1 2024, funding share for native non-financial crypto applications—Social, Games, NFT, DAO—dropped below 50% for the first time, signaling the decline of “concept-driven” narratives. In their place, DeFi and infrastructure sectors are returning, emphasizing real-world protocol utility and sustainable income. Investor attention is shifting from ToC stories to ToB business-model platforms. Meanwhile, CeFi, though less prominent in market narratives, maintains high funding volumes, reflecting ongoing capital recognition of its cash-intensive business needs.
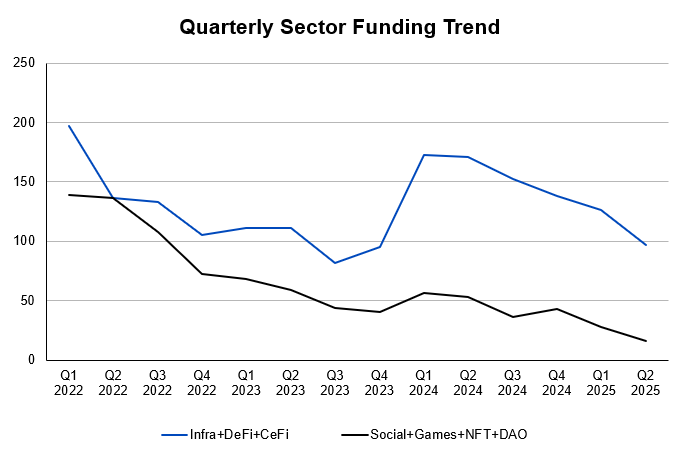
Figure: Quarterly Sector Funding Trend
Source: Number of funding deals per sector recorded by RootData
This shift in investment preference also means entrepreneurs have far fewer viable paths. If crypto entrepreneurship used to be an open-ended exam, it’s now more like a “structured essay”—with only a few options left: Infra, DeFi, RWA. The final challenge is who can emerge victorious from this red ocean.
For VCs, this trend means research frameworks must closely track structural industry changes, dynamically reallocating time and resources to prioritize projects with deep value capture capabilities—not short-term traffic-chasing themes.
Project Lifecycle and Exit Window Analysis
Project TGE and FDV
Project data note: This analysis uses top-tier crypto VC investments from Western markets and exchanges as samples, including firms such as a16z, Coinbase Ventures, Multicoin Capital, YZi Labs, OKX Ventures, Polychain Capital, Paradigm, and Pantera Capital. (See Appendix tables: VC Investments, VC-Backed Listings on Binance: Spot Returns, VC-Backed Listings on Binance: Spot Returns Pivot)
Data filtering criteria:
-
Deal count priority: A single project may undergo multiple funding rounds with vastly different valuations, directly impacting returns. Therefore, each round is treated as a separate investment to more accurately reflect investment activity.
-
Binance projects prioritized: As one of the world’s largest exchanges, Binance offers extensive liquidity and market coverage. To comprehensively reflect market performance, only projects listed on Binance spot trading are selected as flagship cases.
-
Data accuracy: Post-token issuance disclosures are considered OTC (over-the-counter) transactions and excluded from venture capital categories to ensure statistical consistency.
-
Exclusion of incomplete data: Projects without disclosed investment amounts or valuations are excluded due to insufficient data dimensions.
In the crypto primary market, a project’s valuation framework is a core variable affecting VC returns. In particular, post-TGE token price performance has become a key indicator of exit efficiency. However, the past decade’s practice of raising funds via project valuations or FDV (fully diluted valuation) is no longer effective in the current cycle. This renders what could have been tens or even hundreds of times paper gains into negligible outcomes upon exit.
At the same time, project failure is normal—for both traditional and crypto VCs. For VCs, a few star projects delivering high returns are sufficient to significantly boost overall portfolio performance. Thus, external evaluation of VC performance hinges not on win rate, but on capturing those standout successes.
By analyzing post-listing metrics—initial FDV, peak FDV, current FDV—and comparing them with public information on institutional initial costs, we further calculated the return performance of these firms.
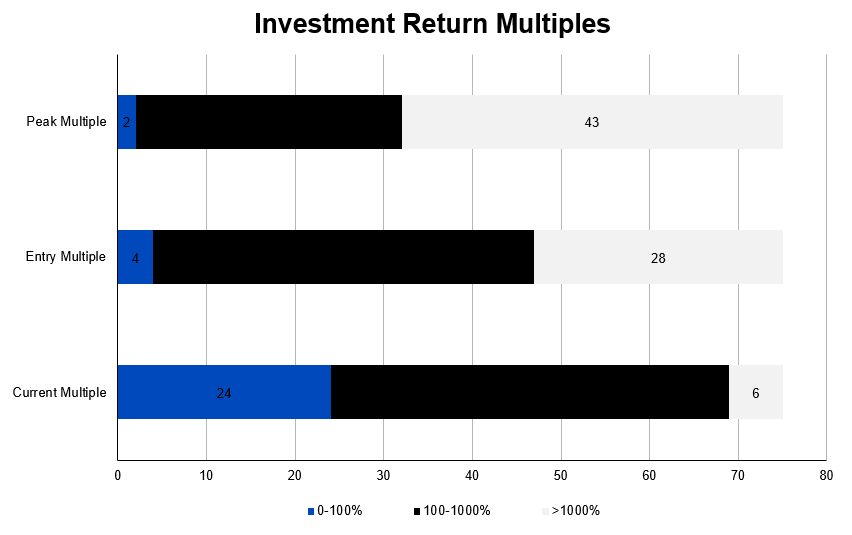
Figure: Investment Return Multiples
The chart above illustrates the post-launch market performance of mainstream VC-backed projects, revealing the severity of the current return landscape. By calculating ratios of Initial FDV/Private Valuation, Peak FDV/Private Valuation, and Current FDV/Private Valuation, it’s evident that many investments now have current FDVs below—or far below—private round valuations. Moreover, the number of projects achieving >10x returns at listing or peak has sharply declined over time.
Statistical results show that among 75 investment cases across 42 projects (see detailed data in appendix):
-
71 deals / 40 projects achieved Initial FDV / Private Valuation > 100%, with 28 deals / 18 projects exceeding 1000%.
-
73 deals / 41 projects achieved Peak FDV / Private Valuation > 100%, with 46 deals / 29 projects exceeding 1000%.
Yet currently, only 6 deals / 4 projects achieve Current FDV / Private Valuation > 1000%, while 24 deals / 18 projects fall below 100%, representing 32% and 42.85% respectively. This means nearly one-third of investments and over four-tenths of projects fail to meet private round valuation expectations in current market performance.
Notably, some star projects—even after listing on highly liquid Binance—still fail to match their high private round valuations. This reflects the current market’s rigorous challenge to project valuations and highlights growing pressure on investor returns.
Additionally, given the common “1+3” lock-up period (one year locked, linear unlock over three years) set by top exchanges, final exit amounts for investment firms are severely limited. This further underscores that despite high early valuations, subsequent performance often fails to support expected investor returns.
This phenomenon of “inflated paper valuations” is particularly common in the crypto primary market: project teams use high FDV pricing during early fundraising to secure favorable terms, but once entering the circulating phase at TGE, insufficient demand and continuous token unlocks often fail to sustain original valuation expectations, causing prices to drop rapidly. Data shows that many projects’ actual circulating market caps remain long-term below their private round entry valuations, directly compressing VC exit multiples.
Essentially, high FDV typically masks two core issues:
-
"Paper wealth" lacking real secondary market liquidity, making realization difficult;
-
Token release schedules severely misaligned with market demand, leading to immediate sell pressure post-TGE and further price suppression.
For VCs, if FDV remains the core pricing anchor in primary market investments, they may significantly overestimate achievable liquidity returns, thereby inflating portfolio book values.
Therefore, in the current market cycle, valuation assessment must return to fundamentals: including intrinsic closed-loop design of tokenomics, supply-demand balance, vesting release rhythm, and real buyer-side liquidity support post-TGE. We believe FDV should not be viewed as a “valuation ceiling,” but rather as a “risk ceiling.” The higher the FDV, the harder the realization, and the greater the discount risk on investment returns.
Shifting focus from “high FDV paper premiums” to “realization of exitable circulating value” is a necessary evolution in VC investment methodology at this stage.
Performance of Projects Listed on Top Exchanges
In the crypto primary market, listing on top-tier exchanges was once seen as a hallmark of project success and an exit window for VCs. But this “endorsement effect” is clearly weakening.
Analysis of price changes for projects listed across multiple exchanges from January 2022 to June 2025 reveals significant differences between platforms. However, a universal trend is that most projects experience rapid price declines shortly after listing—even falling below issue prices—indicating diminishing exchange-powered price support.
The chart below shows price change statistics for spot projects listed on Binance from 2022 to Q2 2025.
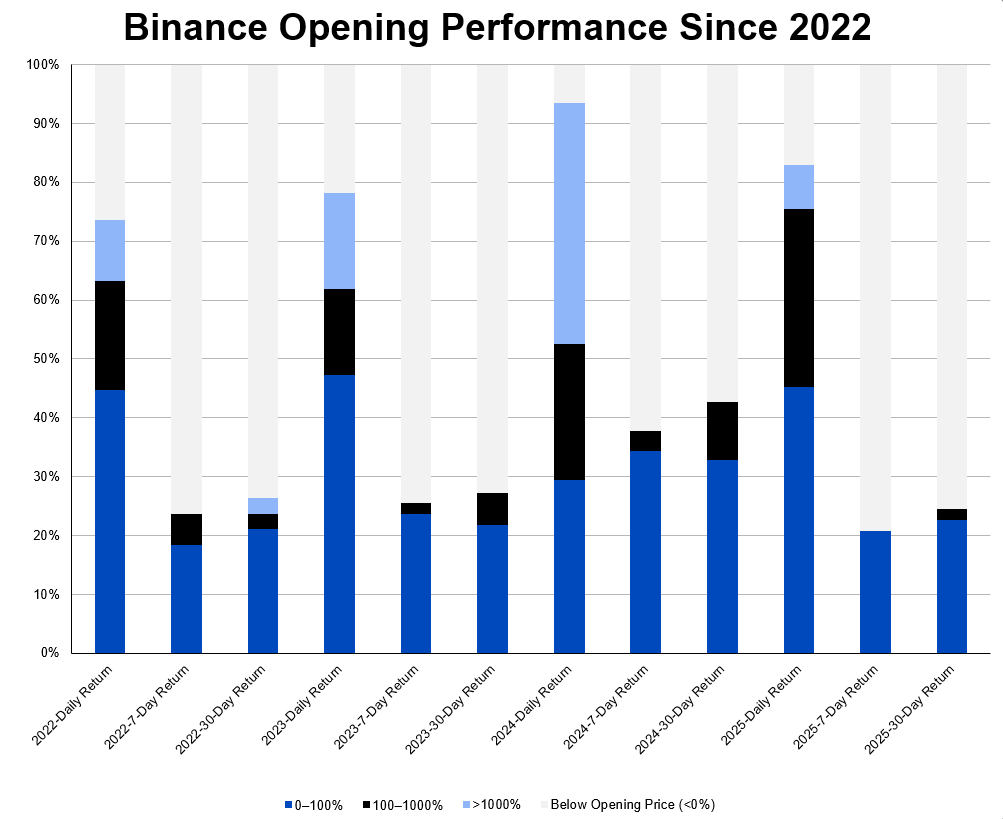
Figure: Binance Opening Performance Since 2022
This “pump-and-dump” pattern stems largely from pre-listing over-incentivization and artificially manufactured liquidity booms. Some projects boost TVL and user attention via large-scale airdrops or “points mining,” but simultaneously introduce massive sell pressure at TGE. For example, Berachain in 2025 saw rapid user attrition and token price collapse post-TGE.
More importantly, exchange listing is no longer the “endgame” of valuation closure, but an ongoing test of market performance. In 2025, Binance adjusted its listing logic, launching the Alpha platform as an early showcase and introducing stricter tracking mechanisms focused on active users, liquidity quality, and price stability. Projects unable to maintain real user growth and narrative stickiness may be marginalized or delisted, even if listed.
This trend implies that the primary market’s liquidity exit window is shifting from “event-driven” to “process-driven.” Models relying solely on listing events to create short-term valuation recovery windows are failing. For VCs, this demands longer-term post-investment engagement and value-capture logic—projects must rely on solid product strength and market validation to sustain secondary market token performance, rather than one-off “valuation realization” events.
Funding-to-TGE Cycle and TGE Success Rate
Project data note: This analysis uses top-tier crypto VC investments from Western markets and exchanges as samples, including Coinbase Ventures, Multicoin Capital, YZi Labs, OKX Ventures, Polychain Capital, and Pantera Capital. (See Appendix table: VC Portfolio Failure & Non-Listing Rate)
Data filtering criteria:
-
Deal count priority: Same rationale as above.
-
Binance projects prioritized: Same rationale as above.
-
Data accuracy: Same rationale as above.
-
Exclusion of incomplete data: Same rationale as above.
From the previous section’s data, even star projects often disappoint in final performance—so how do the vast majority fare? Can they salvage credibility for crypto VCs? In this bottom-up industry, could the ultimate winners be unknown “dark horses” that gain value over time? The answer is bleak. More likely, investors simply cannot find viable exit routes.
In traditional VC, seed rounds typically take 6–12 months, Series A 9–18 months. Due to flexible token fundraising mechanisms (e.g., quick ERC-20 or BEP-20 deployment), the crypto industry once saw extreme models like “fundraising in days, TGE in weeks.” However, with rising regulatory pressure and a calmer market, teams now prioritize product refinement and user growth, significantly extending the average funding-to-TGE timeline.
While longer cycles allow better preparation, they haven’t fundamentally improved project quality. Data shows that since 2021, Coingecko has recorded 17,663 crypto assets, with trading volumes near zero for those ranked beyond #1500—indicating most lack real value and longevity.
More alarmingly, high failure rates aren’t limited to grassroots projects—they’re widespread even among institution-backed ones. Data shows that by 2024, about 20.8% of VC-backed projects had ceased operations, with top-tier firms not spared. For instance, Coinbase Ventures’ backed projects had a 21.6% failure rate, while Polychain Capital’s reached 26.72%. This suggests the market’s project selection mechanism still needs improvement, and VC success rates urgently need enhancement.
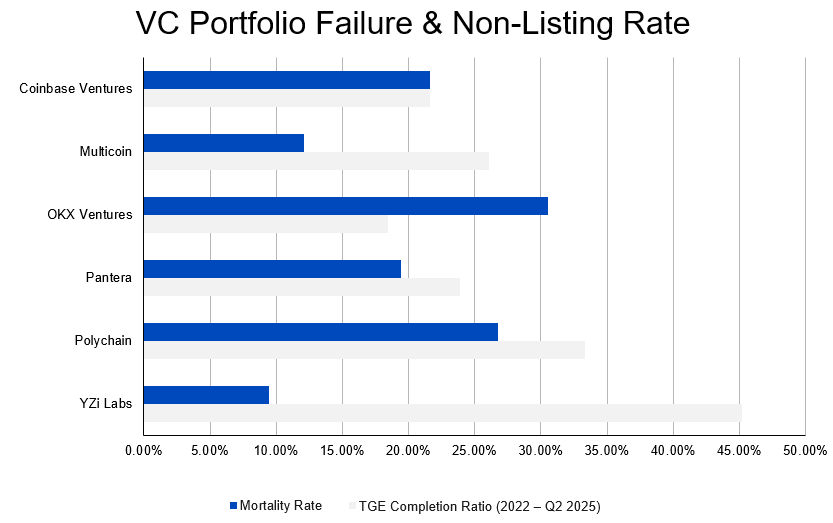
Figure: VC Portfolio Failure & Non-Listing Rate
Moreover, although funding size correlates positively with survival rate, many megaprojects (> $50M) still shut down. Examples include Mintbase ($13.5M), MakersPlace ($30M), and Juno ($21M)—all now defunct. This shows ample capital isn’t sufficient for success; market conditions, operational capability, and product competitiveness remain critical.
These changes impose higher demands on VC investment strategies. Shifting from the old “TGE-first, build-later” acceleration model to a “build-first, list-later” maturity cycle means projects undergo longer validation pre-listing. Investors must deeply assess technical feasibility, team execution, and product-market fit to improve survival and exit viability.
Declining Returns in the Primary Market
Structural Analysis of Declining Returns
The significant decline in crypto primary market investment returns isn’t merely a result of rate hike cycles, but the outcome of multiple structural forces. These changes profoundly affect market mechanics and pose new challenges for investment firms.
Bitcoin’s suction effect and the altcoin dilemma
In recent years, capital flow divergence has intensified. Bitcoin’s market cap dominance (Dominance) rose from ~40% in early 2023, repeatedly breaking 55% in 2024—becoming the dominant force in market liquidity. Meanwhile, US spot Bitcoin ETFs, approved in January 2024, attracted over $100 billion in AUM, with net inflows exceeding $30.7 billion.
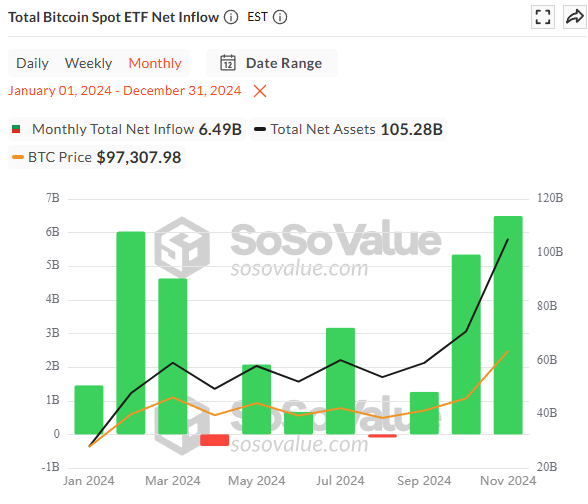
Figure: Total Net Inflow of Bitcoin Spot ETFs in 2024
In stark contrast, the crypto primary market remains depressed. Total 2024 fundraising was only $9.897 billion—far below 2022’s $28.6 billion. The old pattern of “Bitcoin rises, altseason follows” has broken. Capital concentrates heavily in Bitcoin, leaving altcoins starved.
This reflects traditional finance’s risk appetite: compliant capital from ETFs, managed by BlackRock, Fidelity, etc., primarily serves clients’ low-risk asset allocation needs. These funds view Bitcoin as “digital gold,” not a gateway to “Web3,” and rarely flow into riskier altcoins or early-stage projects.
Meanwhile, “Web3” narratives are fading. Once-popular sectors like GameFi and SocialFi lost appeal due to broken economic models and user attrition. The market now focuses on Bitcoin’s proven store-of-value function. This structural shift channels capital overwhelmingly into Bitcoin, leaving altcoin markets unable to support vast project supply and valuation systems.
Sector consolidation and concentration
Shifts in crypto investment preferences reflect VCs’ pursuit of “certainty.” In Q1 2025, early-stage funding share dropped below 50% for the first time, signaling institutional preference for mature projects—driven by the fact that 68.75% of projects never made it to listing, with some top-tier firm-supported projects approaching 80% non-listing rates. Exit difficulties force VCs to reassess capital efficiency, prioritizing projects with clear business models and moats.
Sector choices are also converging. Since Q1 2024, concept-driven sectors like Social, Games, NFT have faded, while DeFi and infrastructure return—VCs now favor practical utility and sustainable income.
This turns entrepreneurship from an “open book exam” into a “structured essay,” with only a few competitive sectors left—Infra, DeFi, RWA. The final contest is who can break out of the red ocean. This concentration exacerbates capital fragmentation and compresses overall returns, becoming a key reason for declining VC performance. VCs must dynamically adjust research frameworks to focus on deep value capture, meeting market demand for certainty.
High project failure rates and inefficient capital conversion
Despite longer cycles allowing more preparation, project quality hasn’t fundamentally improved. Data shows that among 17,663 assets recorded by Coingecko since 2022, most coins ranked beyond #1500 have near-zero trading volume—revealing widespread lack of real value and vitality.
Alarmingly, failure rates remain high even for mainstream institution-backed projects. By 2024, ~20.8% of VC-backed projects had shut down, with top firms like Coinbase Ventures and Polychain Capital seeing failure rates of 21.6% and 26.72% respectively—showing capital and资源优势 don’t effectively reduce failure risk.
Even well-funded star projects face shutdowns—e.g., Mintbase ($13.5M) and MakersPlace ($30M).
This cycle cleansed the market through high attrition, raising the bar for investors: shift from “TGE-first, build-later” to “validate-first, list-later.” Only by deeply assessing technical execution, team resilience, and product-market fit can truly resilient projects be identified amid dual pressures of capital and cycle timing.
Listing ≠ Success: Valuation bubbles and exit dilemmas
Top exchange listing was once a symbol of project success and VC exit—but this effect is failing. Data shows 32.89% of investments and 42.85% of projects now have current FDVs below private valuations, with zero projects achieving >10x current FDV/private valuation—reflecting severe market skepticism toward high-FDV valuations.
Early high-FDV fundraising creates paper premiums, but mismatched token release schedules and market demand accumulate sell pressure, causing rapid price drops. Some projects manufacture liquidity booms via airdrops or incentives but fail to retain users or sustain narratives, ultimately collapsing in price.
Moreover, exchange listing has shifted from a “valuation realization node” to a “long-term performance test.” Top exchanges like Binance raise listing standards, requiring sustained real growth and price stability—otherwise delisting risks loom. This invalidates short-term valuation recovery windows, making exits increasingly dependent on long-term market performance.
This dilemma reveals the inherent risk of high FDV: masking illiquidity and imbalanced tokenomics, compressing return potential. VCs must return to fundamentals—focusing on closed-loop token economics and real market demand. Only solid product strength and market validation can support long-term value, preventing paper wealth from becoming an exit illusion.
Macroeconomic pressure and retreat of risk capital
Since March 2022, the Fed has hiked rates continuously, raising the federal funds rate to 5.25%-5.50% within 18 months. Concurrently, the 10-year Treasury yield broke 4.5% in H2 2023, significantly boosting the attractiveness of risk-free assets and increasing opportunity costs for high-risk investments. During this period, global risk appetite declined sharply, drastically reducing capital support for high-risk areas like crypto.
High interest rates deeply impact crypto project valuations and returns. First, higher rates increase discount rates for future earnings—meaning expected long-term growth or token value in crypto projects depreciate due to higher discounting, directly compressing secondary market valuations. Second, as risk-free yields (e.g., Treasuries) exceed 4.5%, investors prefer low-risk, high-return allocations, reducing capital inflows into high-risk crypto projects. This capital shift further weakens funding ability for crypto startups, making it hard for many to secure sufficient support. Additionally, low secondary market valuations and reduced liquidity make high-return exits difficult, shrinking investor returns—not only hurting VC fund performance but also undermining market confidence in crypto.
VC’s Survival Line: Can “Home Run” Returns Cover Massive Losses?
Project data note: Same as previous sections.
Data filtering criteria:
-
Deal count priority: Same rationale as above.
-
Binance projects prioritized: Same rationale as above.
-
Data accuracy: Same rationale as above.
-
Exclusion of incomplete data: Same rationale as above.
In venture capital, high failure rates are normal. A VC fund’s success doesn’t hinge on avoiding failures, but on whether its portfolio includes one or two “home run” projects. These winners must deliver at least 10x returns to offset losses from numerous failed projects and achieve overall profitability.
In today’s crypto market, successfully listing on Binance spot has become the gold standard for a project “making it.” Thus, the core question shifts from “will the project die?” to: what proportion of invested projects ultimately list on Binance? And do their returns suffice to cover massive losses from those that don’t?
Let’s examine this funnel-like selection process from investment to Binance listing, using macro data across two dimensions: “deal count” and “project count.”
Take a portfolio of 1,026 investments across 757 unique projects:
Most investments go silent (no TGE)
-
As high as 747 deals (72.8%), covering 584 projects (77.1%), failed to complete TGE (token generation and exchange listing). This means over 70% of investments and projects remain off-market, facing extreme uncertainty.
Few successfully “launch tokens” (complete TGE)
-
Only 279 deals (27.2%), covering 173 projects (22.9%), achieved TGE and entered secondary markets. This is the first step toward early investor exits—but still far from “success.”
The final bottleneck (listing on Binance)
-
At the pyramid’s peak, only 76 deals, covering 42 projects, successfully listed on Binance spot.
-
This means even among successfully token-launched projects, only about one-quarter (24.3% by project count, 27.2% by deal count) reach Binance’s top-tier liquidity market.
-
From the portfolio’s starting point, success rates are minuscule:
-
By deal count, only 7.4% eventually list on Binance.
-
By project count, the rate drops to just 5.5%.
For any crypto fund, the probability of an investment reaching Binance is only ~5.5%. This means over 94.5% of projects fail to deliver top-tier returns.
Now, how do these 5.5% “chosen ones” perform? Below is an estimated average return for top-tier VC-backed projects after Binance listing:
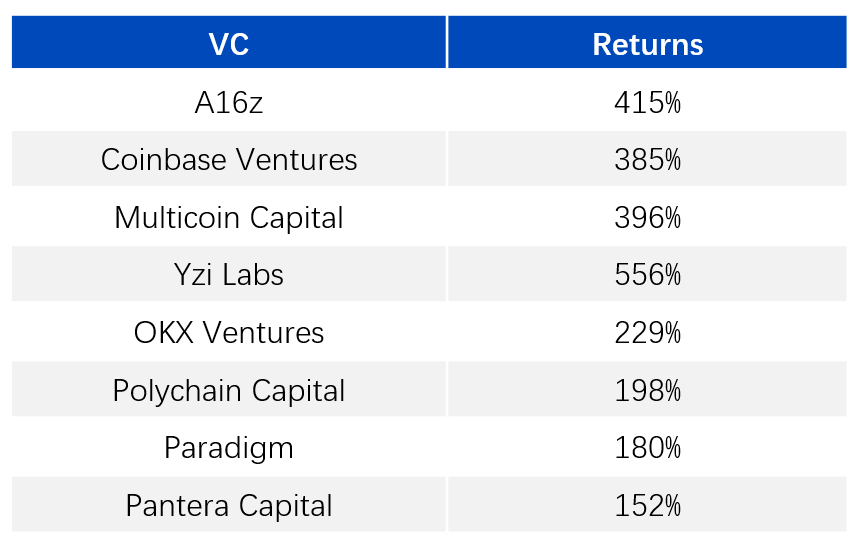
Even the world’s top VCs see average returns on Binance-listed projects ranging between 2x and 5x—far below the mythical “10x” needed to cover losses.
Let’s do the math. Assume a fund needs to break even. In a simplified model: if 77% of projects go to zero, the remaining 23% must generate at least 4.3x average returns (1 / 0.23 ≈ 4.3) to barely break even.
But reality is:
-
Listings on Binance are too rare: Only 5.5% of projects reach top-tier liquidity.
-
Returns on Binance are too low: Average 2–5x returns are far too small to offset losses from the other 95.5%. Not to mention projects that only list on smaller exchanges—returns and liquidity are worse.
The brutal truth is that even for top funds, considering all investments as a whole, current Binance listing rates and post-listing returns are insufficient to cover losses from the vast majority of failed projects.
This leaves primary market investors facing three major hurdles: declining absolute returns, shrinking listing multiples, and liquidity drought. The industry’s investment logic is being forced to shift from “spray and pray for hits” to deeper evaluation of intrinsic value, team execution, and product-market fit.
Returning to Essence: When the Tide of the “Web3 Revolution” Recedes
The preceding analysis clearly reveals the “outcome”—a comprehensive downturn in primary market returns and the failure of the 2017–2022 Crypto Vintage investment logic. However, to truly understand this transformation, we must explore the underlying “causes.” We believe the current困境 faced by crypto VCs isn’t a simple cyclical adjustment, but a profound paradigm revolution. At its core, after a tumultuous period of mass exploration, the crypto industry is finally shifting from grand “Web3” narratives back to its true foundational value—as a disruptive force building next-generation financial infrastructure.
Misallocated Skill Tree: The Bankruptcy of Web3 Narratives and the End of Growth
For years, the entire industry has been immersed in the “Web3” dream—a decentralized internet where users own their data and rival Web2 giants. Under this narrative, VC logic was simple: find the next exponential-growth SocialFi, GameFi, or NFT platform, capturing trillion-dollar markets through disruptive application-layer innovation.
But this path proved misguided.
The End of Growth: User Bottlenecks in Web3 Narratives
All disruptive application stories rest on exponential user growth. But reality shows crypto has hit a user ceiling. Complex wallet interactions, unintuitive private key management, and lack of real-world use cases prevent crypto apps from breaking out of niche circles into the mainstream. When user growth myths collapse, so do the high-valuation models built upon them. Once-hyped sectors now lie in ruins.
Value Misalignment: When “Revolution” Deviates from Core Strengths
Blockchain’s core advantage lies in its financial attributes: efficient asset creation, permissionless global distribution, and programmable automation. It aims to transform production relationships—especially financial asset creation and circulation. Yet, past “Web3” projects—with fewer than 20% targeting this core—used blockchain’s “financial hammer” to forcefully solve non-financial “nails” like social or gaming. This value misalignment wasted resources and led to failed experiments. VCs drove this great social experiment—its results, though disappointing, were valuable: they used real money to prove which paths don’t work.
Returning to Core: The True Nature of Crypto Is Building Next-Gen Financial Infrastructure
If the door to Web3 remains temporarily closed, where does crypto’s real value lie? The answer is becoming clearer: return to its technological roots and focus on building a new, efficient, global financial infrastructure.
Unlike the “start-from-scratch” Web3 revolution, building financial infrastructure is more pragmatic and foundational: it doesn’t aim to create a virtual world detached from reality, but to use blockchain to provide superior “tracks” and “traffic rules” for real-world asset and value flows.
This perfectly explains the trends observed earlier:
-
Return of DeFi and infrastructure: These are the “tracks” themselves—the bedrock of value transfer, whose importance is self-evident.
-
Rise of RWA (Real-World Assets): This enables real-world “cargo” (bonds, real estate, credit) to run on new “tracks,” bridging virtual and physical worlds and empowering real economies with blockchain efficiency.
-
Sustained funding capacity of CeFi (Centralized Finance): As “transfer stations” and main gateways between old and new financial systems, their cash-flow value is highly prized as markets regain rationality.
When the industry’s direction shifts from “Web3 applications” to “financial infrastructure,” the entire evaluation framework changes. Valuation models based on vague narratives and user growth expectations are abandoned, replaced by a more traditional infrastructure-like framework emphasizing system stability, transaction efficiency, asset security, and sustainable business models. This is the root cause of the broad valuation correction.
Changing Participants: From “Believers” to “Rational Actors”
In any emerging industry’s early days, “believers”—idealistic insiders—dominate. They embrace risk, create and spread new narratives, and pay for dreams of high-risk, high-reward.
However, with Bitcoin ETF approval, crypto is irreversibly moving from niche geek circles into mainstream finance. The participant structure is fundamentally changing.
-
Capital sources are changing: Traditional finance giants like BlackRock and Fidelity bring compliant capital. They don’t seek speculative 100x returns, but stable asset allocation. To them, Bitcoin is “digital gold,” not a ticket to Web3.
-
Investor mindset is changing: After enduring a brutal bear market, investors shift from frenzied speculators to more cautious “rational actors.” They begin scrutinizing fundamentals and intrinsic value, not blindly chasing the next hype.
This shift from “believers” to “rational actors” isn’t isolated—it mirrors a classic case in Web2 history: the dot-com bubble circa 2000.
At the peak, “believers” firmly believed “eyeballs equal everything.” They ignored profits, paying only for clicks and grand narratives. A prime example is Pets.com. It had a disruptive story selling pet supplies online and successfully went public, but collapsed after burning through capital—ignoring high logistics costs and basic business logic. Pets.com’s failure wasn’t because the internet vision was wrong, but because it had “believer” fervor without “rational actor” business substance.
After the bubble burst, capital dried up, and markets regained sanity. The central question shifted from “How fast is your user growth?” back to the fundamental “How do you make money?” It was in this “rational actor”-dominated market that true giants emerged. Amazon, despite a stock crash, survived thanks to its heavy-asset warehousing and logistics moat. Google succeeded with AdWords—a clear, efficient monetization model—going public in 2004 and ushering in a new era.
History clearly mirrors today: Today’s failed Web3 projects with unviable economic models are yesterday’s Pets.com. Meanwhile, DeFi, infrastructure, and RWA projects now favored by capital resemble Amazon and Google of yesteryear—rooted in sustainable, verifiable business logic, not just beautiful stories.
This participant shift is a necessary step toward industry maturity. When market leadership shifts from “believers” to “rational actors,” high-valuation bubbles built on faith and consensus will inevitably burst. Only projects delivering real, measurable value will earn fair valuations and market recognition in the new value system.
In summary, the current primary market困境 is a “course correction” in industry development. It marks the end of an era—one driven by grand narratives and infinite imagination—and the beginning of a new age—one defined by real utility, sustainable business models, and rational capital. For VCs navigating this landscape, understanding and adapting to this foundational shift will be key to surviving cycles and winning the future.
Investment Logic Transformation Under Value Reassessment
The market has declared in the harshest way possible: a business model relying solely on “listing on Binance” as an exit path is not investing—it’s gambling. With secondary market liquidity premiums gone and primary market valuation bubbles burst, the industry’s value chain is undergoing painful yet necessary reassessment.
But this isn’t a reason to pessimistically exit. On the contrary, it’s precisely the golden moment for top-tier investors to recalibrate—with rigor and patience—to capture real value. The goal is no longer chasing the next hot token, but investing in and nurturing the “Stripe or Uber of crypto.”
From a VC perspective, in the post-AI era, capital’s marginal returns are diminishing, and capital intensity will decline. Past costs for hiring, market expansion, and R&D will decrease with AI advancement. Thus, a VC’s value is no longer just writing checks, but providing endorsement and visibility. This will lead to the demise of mid-to-lower tier VCs that fail to proactively identify undervalued opportunities and merely follow the herd.
From “Narrative-Driven” to “Business-Driven”
In recent years, VC investment overly relied on “sector narratives”: ZK, Layer2, GameFi, SocialFi, NFT… but most projects failed to prove themselves in user retention and real revenue.
The future’s core question is no longer “How many users do you have?” but:
-
Who are your users?
-
Do they pay for real pain points?
-
Will they stay if token rewards are removed?
Truly resilient projects often have stable on-chain transaction and fee income—driven by real demand, not subsidies.
Case Study: Ethena
-
Launched stable asset USDe in 2024, circulating supply exceeded $3 billion within six months, becoming one of the fastest-growing stablecoins;
-
Core mechanism: Delta-neutral hedging of perpetual contracts, generating Real Yield consistently across market cycles;
-
Users include not just “degen farmers,” but institutions, market makers, and hedge funds—demand rooted in “hedging and stable yield,” not short-term incentives;
-
Revenue model directly tied to derivatives markets, annualized yield briefly exceeding 20% in 2024, gradually forming protocol-level cash flow.
This is the virtuous cycle of “user demand → real revenue → protocol value,” explaining Ethena’s breakout in the fiercely competitive stablecoin market.
“Ballast Stone” Cash Flow
Future portfolios need more counter-cyclical cash flow protocols or applications.
-
Compliant and secure API services: Chainalysis generated over $200M in revenue in 2022, with valuation peaking at $8.6B;
-
Web3 infrastructure SaaS: Alchemy, Infura charge USD subscriptions, revenues decoupled from token prices, highly stable;
-
Hybrid on-chain/off-chain valuation: Incorporate both on-chain metrics (TVL, protocol revenue) and traditional equity tools (DCF, P/E).
Such models provide value anchors, serving as the “ballast stone” of portfolios.
Realistic Return Curves
Crypto VC return curves are shifting from “100x in two years” (J-shaped) to “10x in eight years” (staircase).
Future exit paths will diversify:
-
Acquisition by tech giants;
-
Listing on compliant STO platforms;
-
M&A integration with traditional industries.
This implies longer horizons and deeper patience.
Signals Are Clearer Than Ever
The current primary market contraction is merely “deleveraging” after a period of wild growth. As noise fades, signals are clearer than ever before.
For serious investors, this means:
-
Due diligence must mirror top-tier equity VCs—focused on market size, unit economics, product moats;
-
Post-investment support must genuinely empower—providing clients and channels, not just exchange connections.
Prospective Sectors: Next-Wave Investment Opportunities in Crypto Markets
ArkStream Capital identifies the following three areas as having long-term investment potential:
Stablecoins: The Foundation of Next-Gen Global Payment and Settlement
The significance of stablecoins goes beyond “counter-cyclicality” or “cash flow generation”—it’s about liberating capital from geopolitical constraints, foreign exchange controls, and local financial systems, granting capital “universality (Universal Finance)” for the first time. Previously, dollar assets couldn’t freely circulate—or even be accessed—in many countries, but stablecoins changed this: acting as a “digital artery,” injecting global capital into previously unreachable regions and industries.
Cross-border e-commerce & game publishing
-
Pain point: Cross-border payments typically take 3–7 days, fees 3%–7%, low credit card penetration leads to lost conversions.
-
Stablecoin solution: USDT/USDC enable T+0/minute-level clearing and settlement, direct wallet connections globally, significantly reducing fees and reconciliation costs.
-
Market size: Cross-border e-commerce >$1 trillion/year (2023), projected >$3.3 trillion by 2028; global gaming $184 billion (2023)—if just 10% of e-commerce and 5% of gaming adopt stablecoins, potential annual on-chain flow exceeds $200 billion.
Global remittances & remote payroll
-
Pain point: Traditional remittance averages 6.39% cost (2023Q4), slow transfers, limited channels; LMIC remittances totaled $656 billion (2023).
-
Stablecoin solution: 24/7 transfers, on-chain traceability, significantly lower than traditional MTO costs, enabling automated bulk salaries and micro-payments.
-
Market size: Global remittances ~$860 billion (2023); if 20% migrate to stablecoins, it creates ~$170 billion/year in incremental on-chain settlement space.
Working capital for businesses in high-inflation/capital-controlled markets
-
Pain point: Local currency depreciation and FX quotas squeeze operating cash flow, hindering cross-border procurement and payments.
-
Stablecoin solution: Use stablecoins as dollarized working capital, directly connecting to overseas suppliers and contractors, bypassing inefficient/unstable channels.
-
Market size: Nigeria recorded $59 billion in crypto transactions (July 2023–June 2024); $3 billion in small (<$1M) stablecoin transfers in Q1 2024—stablecoins becoming a mainstream use case.
DeFi-based hedging & global derivatives access
-
Pain point: SMEs struggle to access low-cost forex/interest rate derivatives for hedging—high barriers, slow processes.
-
Stablecoin solution: Use stablecoins as collateral for on-chain lending, forwards/options hedging—enabling programmatic, composable risk management and financing.
-
Market size: Global OTC forex ~$7.5 trillion/day (2022); every 0.5% on-chain penetration increase ≈ $375 billion/day in potential nominal on-chain volume.
RWA: Making Traditional Assets Truly Programmable
Traditional financial assets are massive but long constrained by geography, time, and settlement systems: government bonds settle only on business days, cross-border real estate investment involves cumbersome procedures, supply chain票据 approvals are lengthy, private equity funds are nearly illiquid. Despite huge capital pools, they’re trapped in “static reservoirs.”
RWA’s value lies in digitizing rights to income and settlement—creating cash flows that can automatically circulate and combine on-chain. Government bonds can be used as collateral like stablecoins, real estate rents auto-distributed, supply chain financing instantly discounted, private equity shares gaining secondary liquidity. For investors, this isn’t just digitizing single assets—it’s a reconstruction of global capital efficiency.
Treasuries / Money Market Funds
-
Pain point: High entry barriers, T+1/2 settlement slows capital turnover.
-
On-chain solution: Tokenized T-Bills/MMFs enable 24/7 redemption and collateralization (e.g., BUIDL, BENJI).
-
Market size: US money market funds >$7T; tokenized US Treasuries only ~$7.4B (Sep 2025).
Real Estate & Private Equity Funds
-
Pain point: Poor liquidity, long exit cycles, complex cross-border investment.
-
On-chain solution: Tokenize property/fund shares, auto-distribute rent/dividends on-chain, introduce secondary liquidity.
-
Market size: Global real estate $287T, private equity AUM >$13T; on-chain value < $20B.
Supply Chain Financing & Receivables
-
Pain point: SME financing difficulties, global trade finance gap $2.5T.
-
On-chain solution: Tokenize receivables, connect investors directly to cash flows, automatic payout via smart contracts.
-
Market size: Supply chain finance $2.18T; cumulative on-chain financing >$10B.
Commodities & Stocks/ETFs
-
Pain point: High friction in cross-border transfer of gold/ETF shares, limited fractional trading.
-
On-chain solution: Tokenize physical gold, ETF/stock shares—usable for both settlement and collateral.
-
Market size: Gold token market cap ~$2B; on-chain ETF/stock AUM >$100M.
Crypto + AI: Enabling AI to Truly Function as an Economic Agent
For AI to achieve autonomy, it must be able to spend money, reconcile accounts, and prove delivery. Traditional finance fails here: payments rely on manual account setup, cross-border settlements are slow, billing cycles are long, and output verification is difficult. Crypto networks provide a full “operating system”:
-
Monetary layer: Stablecoins/deposit tokens enable 24/7 global clearing; smart wallets let Agents autonomously spend; streaming payments enable “pay-per-call” billing.
-
Contract layer: Funds escrow, SLA, and penalty clauses written into contracts—automatic refunds or slashing for subpar service; strategy wallets can set limits, whitelists.
-
Verification layer: TEE and zero-knowledge proofs make compute power and inference results auditable; payments based on “proof,” not “promise.”
When spendable money and verifiable work operate on the same chain, Agents cease to be mere API callers—they become capable of running like enterprises: spending on compute and data, earning revenue from delivery, accumulating cash flow and credit. This is the true meaning of **“Crypto is AI’s native currency.”**
Agent-native settlement and treasury
-
Pain point: Fragmented API billing and cross-border payments, manual reconciliation/invoicing/risk control, inability to “settle while calling.”
-
On-chain solution: Agents use smart wallets for streaming/micro-payments (per token, millisecond, request); contracts escrow deposits and enforce SLAs—automatic refunds/slashing on breach; strategy wallets set daily limits, whitelists, session keys for risk and permission control.
-
Market size: GenAI total spending ~$202B (2028 estimate); if 5% flows through “Agent → on-chain” real-time settlement, it forms a $10B/year native payment channel.
Verifiable compute and inference markets (Compute & Inference)
-
Pain point: Cloud bills expensive and settled retroactively, inference results and timing unverifiable, lack of automatic compensation for service failure/downtime.
-
On-chain solution: Compute providers stake → accept orders → submit proof (TEE/zk/multi-party review) → get paid per proof; slashing for underperformance; prices matched via bidding pool—**“pay for proof”** replaces “trust then pay.”
-
Market size: AI infrastructure spending ~$223B (2028 estimate); 5% decentralized/verifiable channel ≈ $11B in usage-based settlement volume.
Data provenance and licensing revenue sharing (Provenance & Licensing)
-
Pain point: Unclear data sources for training/fine-tuning/inference, hard to measure licensing, creators and enterprise data lack continuous revenue sharing.
-
On-chain solution: Sign on-chain licenses and trace fingerprints for data/models/assets; each call automatically splits revenue to addresses (creators, data DAOs, annotators, model owners), permanently linking earnings to source.
-
Market size: Data brokerage ~$292B (2025), creator economy ~$480B (2027); connecting 5% to on-chain licensing and automatic revenue sharing creates a billion-dollar-scale continuous distribution pipeline.
Conclusion
In 2017, Crypto VCs introduced “venture capital and token fundraising” into the crypto ecosystem. By 2024, infrastructure and compliance channels were completed—the first curve—creation and circulation of assets and highways from 0 to 1—has concluded.
We officially entered Crypto’s second curve in 2024—not about creating another “hotter narrative,” but about treating crypto as a globally open, efficient, verifiable financial highway to carry real productivity: stablecoins enabling cross-border capital flow, RWA bringing cash-flow assets on-chain, Crypto + AI directly linking funds and delivery. The industry’s true value is shifting from valuation narratives to restructuring production relationships.
For VCs, the role hasn’t disappeared—it has evolved toward more pragmatic value creation. Capital must shift from “chasing trends” to “running the books,” helping founders connect real demand, stable cash flows, and reusable financial primitives to the chain. Investors committed to fundamentals and execution will become the true value capturers of the next decade.
Appendix
Financing and return data referenced in this article are available in the table below. Download welcome.
Join TechFlow official community to stay tuned
Telegram:https://t.me/TechFlowDaily
X (Twitter):https://x.com/TechFlowPost
X (Twitter) EN:https://x.com/BlockFlow_News


