

Will the market definitely rise after the rate cut in September?
TechFlow Selected TechFlow Selected
Will the market definitely rise after the rate cut in September?
Reviewing the capital market volatility before and after interest rate cuts in history.
Author: kkk, BlockBeats
It seems highly likely that interest rates will be cut in September this year. The biggest question now is: Will the market rise after the rate cut?
Based on historical experience, the answer is probably yes—but not immediately upon the rate cut.
Intuitively, markets equate "rate cuts" with signals of liquidity easing and rising asset prices. However, looking back over the past three decades, the Federal Reserve's rate cuts are far more complex than they appear. Sometimes they are preemptive measures to prevent problems before they arise; other times, emergency relief efforts during crises.
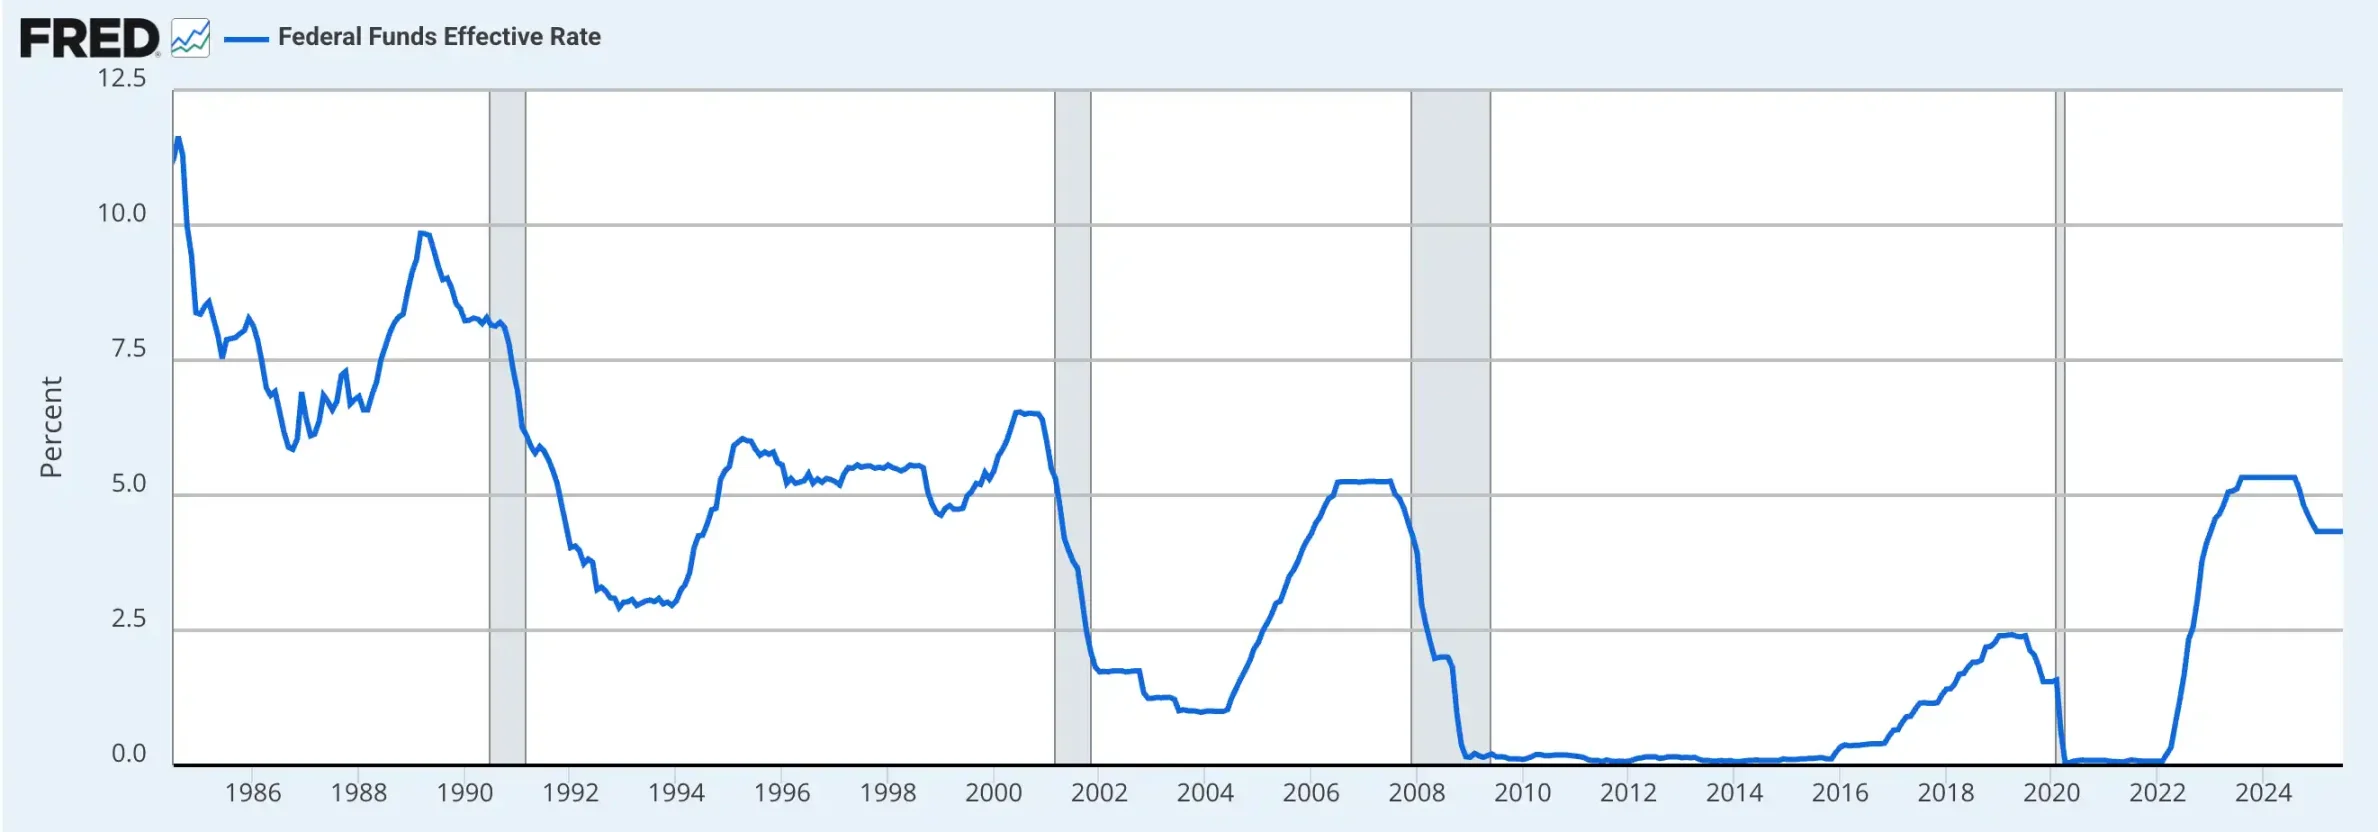
Since 1990, the Fed has gone through five major easing cycles, each driven by different economic conditions and policy objectives, with markedly different stock market reactions. Understanding the relationship between rate cuts and markets requires moving beyond the simplistic view of rate cuts as a "bull market button," instead analyzing each case within its specific macroeconomic context and investor sentiment.
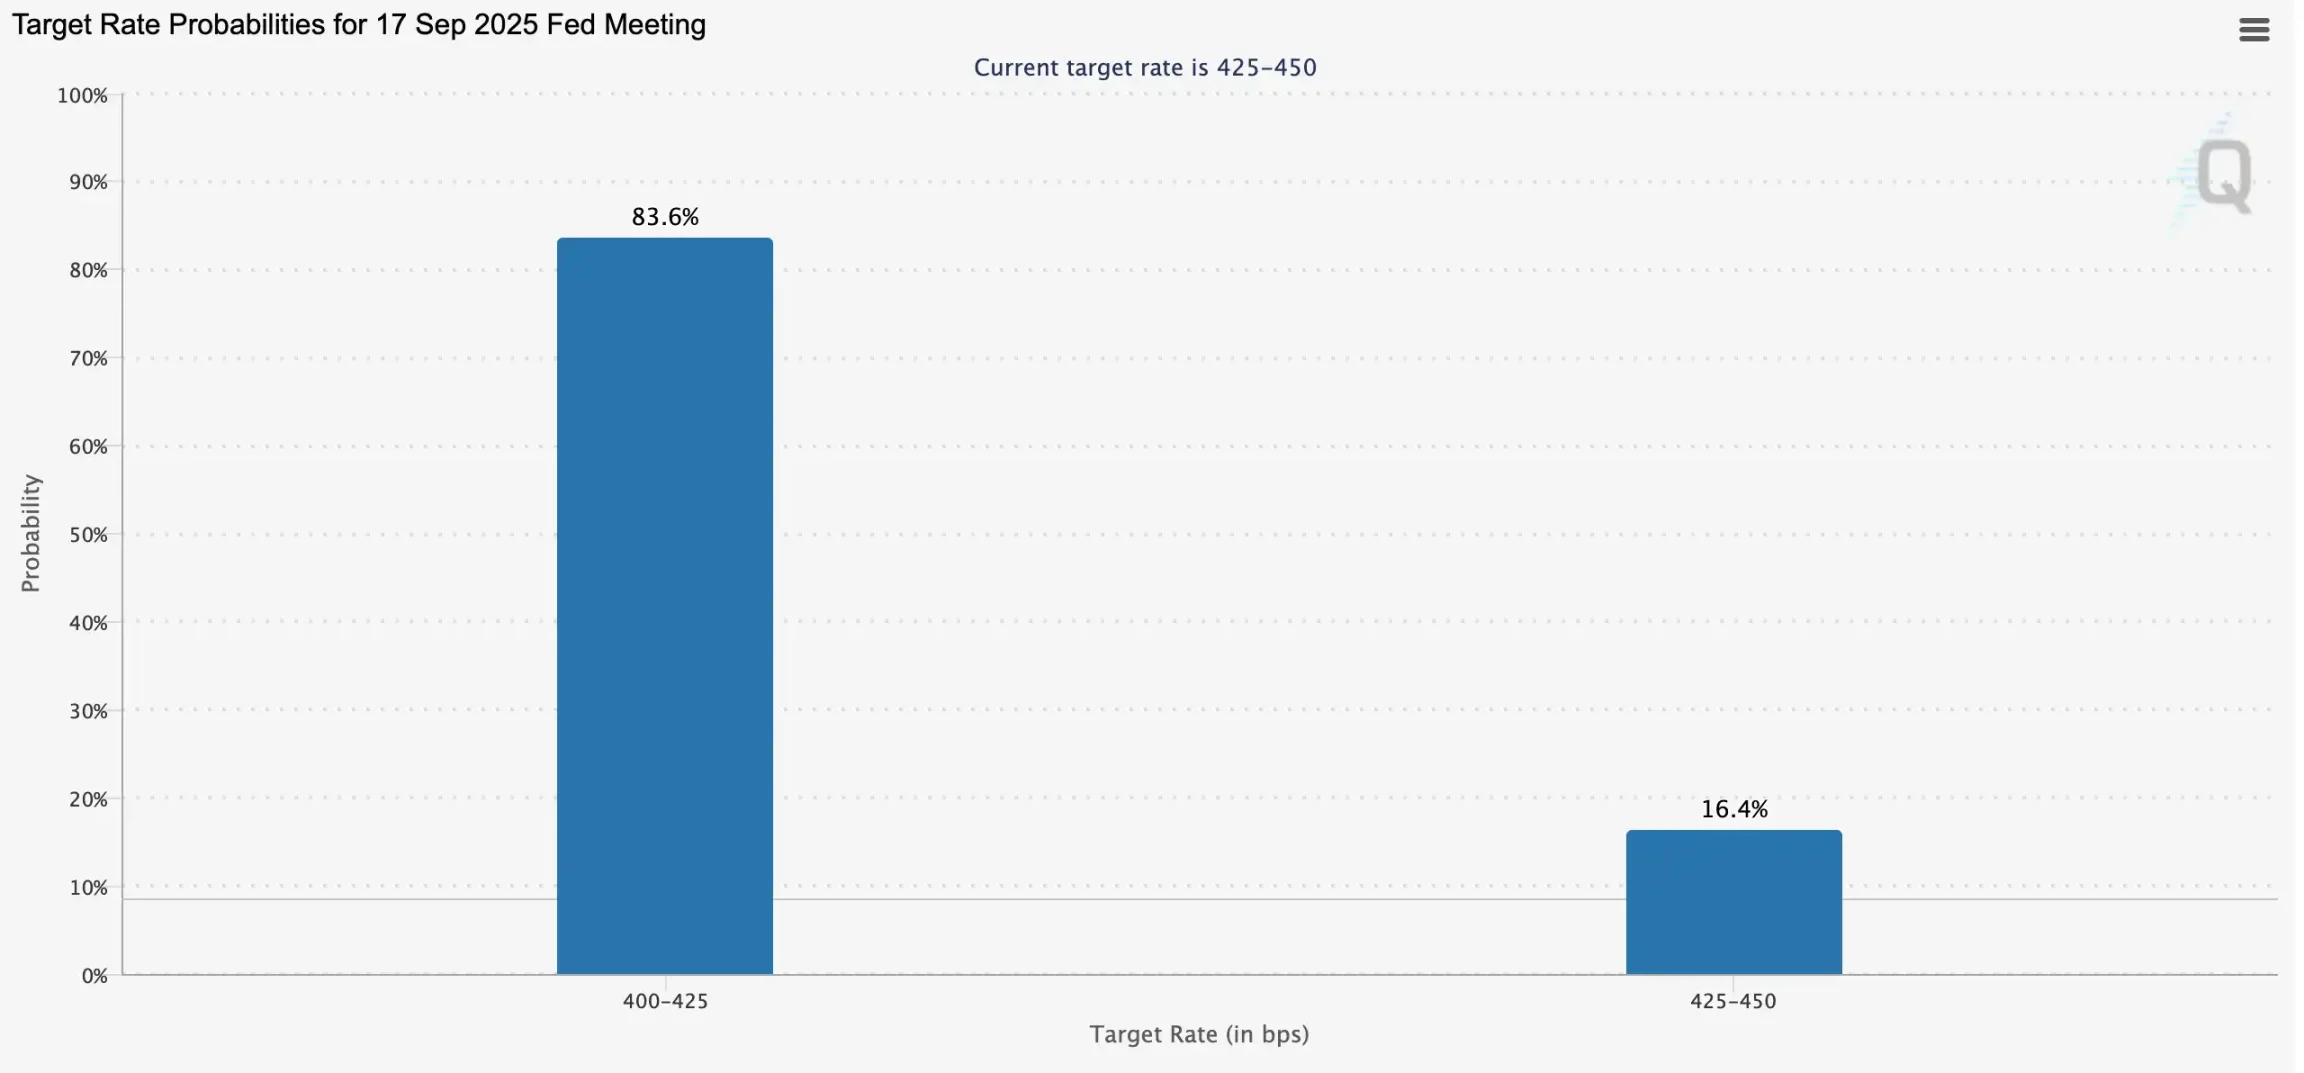
It has been exactly one year since the last rate cut, and markets are once again focusing on the upcoming September FOMC meeting. According to FedWatch data, there is now an 83.6% probability that the Fed will cut rates by 25 basis points in September. Over the past year, not only have the S&P and Nasdaq hit new all-time highs, but Bitcoin has also surged dramatically, reigniting market hopes for the "rate cut = bull market" logic. Coinbase believes the loose monetary cycle will usher in an altcoin season. But is there truly a necessary link between rate cuts and market performance? This article reviews the U.S. economy and equity market performance across all Fed easing cycles since 1990, offering a more rational basis for judging whether a bull market is truly arriving.
Rate Cuts and Bull Markets: Stock Market Performance During Easing Cycles
1990–1992: Soft Landing After the Savings and Loan Crisis and the Gulf War
From 1990 to 1992, the U.S. economy faced successive shocks from the savings and loan crisis and the Gulf War. Credit tightened sharply, consumption and investment declined rapidly, and the economy quickly fell into recession. The Federal Reserve began cutting rates in July 1990 and continued until September 1992, lowering the federal funds rate from 8% to 3%, launching a strong round of monetary easing.
Initially, the Fed observed weakening economic momentum and financial market instability, opting for a gradual shift toward looser policy. However, Iraq's invasion of Kuwait in August caused oil prices to spike and economic sentiment to deteriorate, spreading panic across markets and forcing the Fed to accelerate its rate cuts. By October, with the economy weakening further and the government reaching a budget agreement to reduce deficits, the Fed acted again. By the end of 1990, financial system stress intensified, yet inflation eased, creating room for deeper rate cuts.
This easing effectively mitigated the negative impacts of credit tightening and geopolitical turmoil. U.S. CPI rose from 121.1 in 1989 to 141.9 in 1993, but the year-on-year growth rate slowed from 4.48% to 2.75%, bringing inflation under control. GDP growth rebounded from -0.11% in 1991 to 3.52% in 1993, returning the economy to a growth trajectory.
The capital market responded more directly. From 1990 to 1992, the easing effect significantly boosted investor confidence. The Dow Jones Industrial Average rose 17.5%, the S&P 500 gained 21.1%, and the tech-heavy Nasdaq Composite surged 47.4%, emerging as the strongest recovery segment post-crisis.
1995–1998: Preventing Recession and Responding to the Asian Financial Crisis
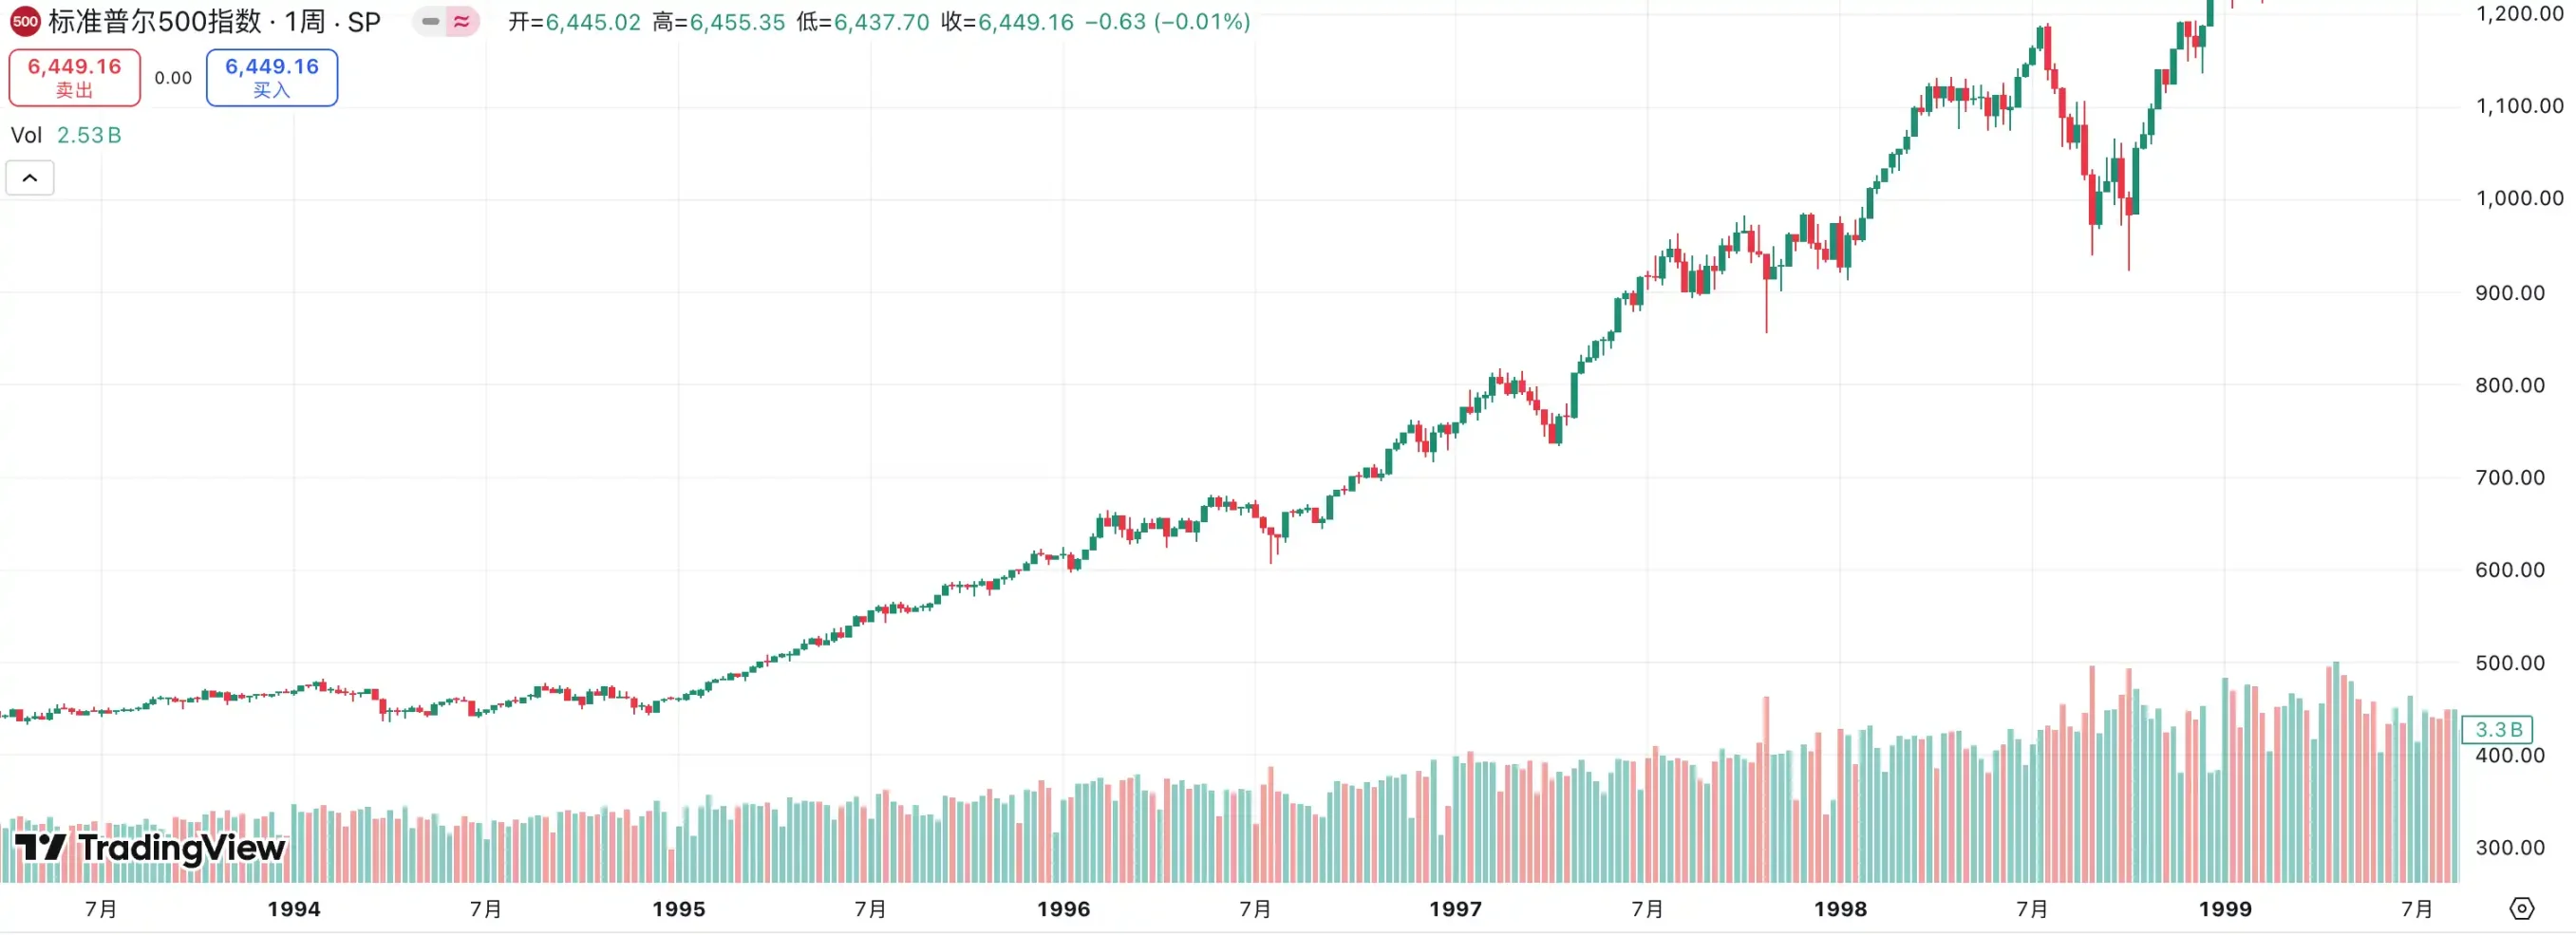
After successfully achieving a "soft landing" following the tight monetary cycle of 1994–1995, the U.S. economy still faced concerns about slowing growth. To avoid excessive tightening leading to recession, the Fed decisively shifted to easing in 1995–1996, cutting rates to support the economy. This proved highly effective—U.S. GDP growth rose from 2.68% in 1995 to 3.77% in 1996, and further jumped to 4.45% in 1997, putting the economy firmly back on an upward path.
However, the Asian financial crisis erupted in July 1997, triggering severe volatility in capital markets. Although the U.S. domestic fundamentals remained strong, global uncertainty spiked, and the collapse of Long-Term Capital Management (LTCM) ignited widespread market panic. To prevent external shocks from dragging down the domestic economy, the Fed cut rates three times between September and November 1998, reducing the federal funds rate from 5.5% to 4.75%.
This mild easing had a significant impact. The economy maintained expansion, while capital markets entered a full-blown rally. From the start of easing, the Dow Jones surged over 100%, gaining 100.2%; the S&P 500 skyrocketed 124.7%; and the Nasdaq, driven by the tech boom, rose 134.6%, laying the groundwork for the dot-com bubble that followed.
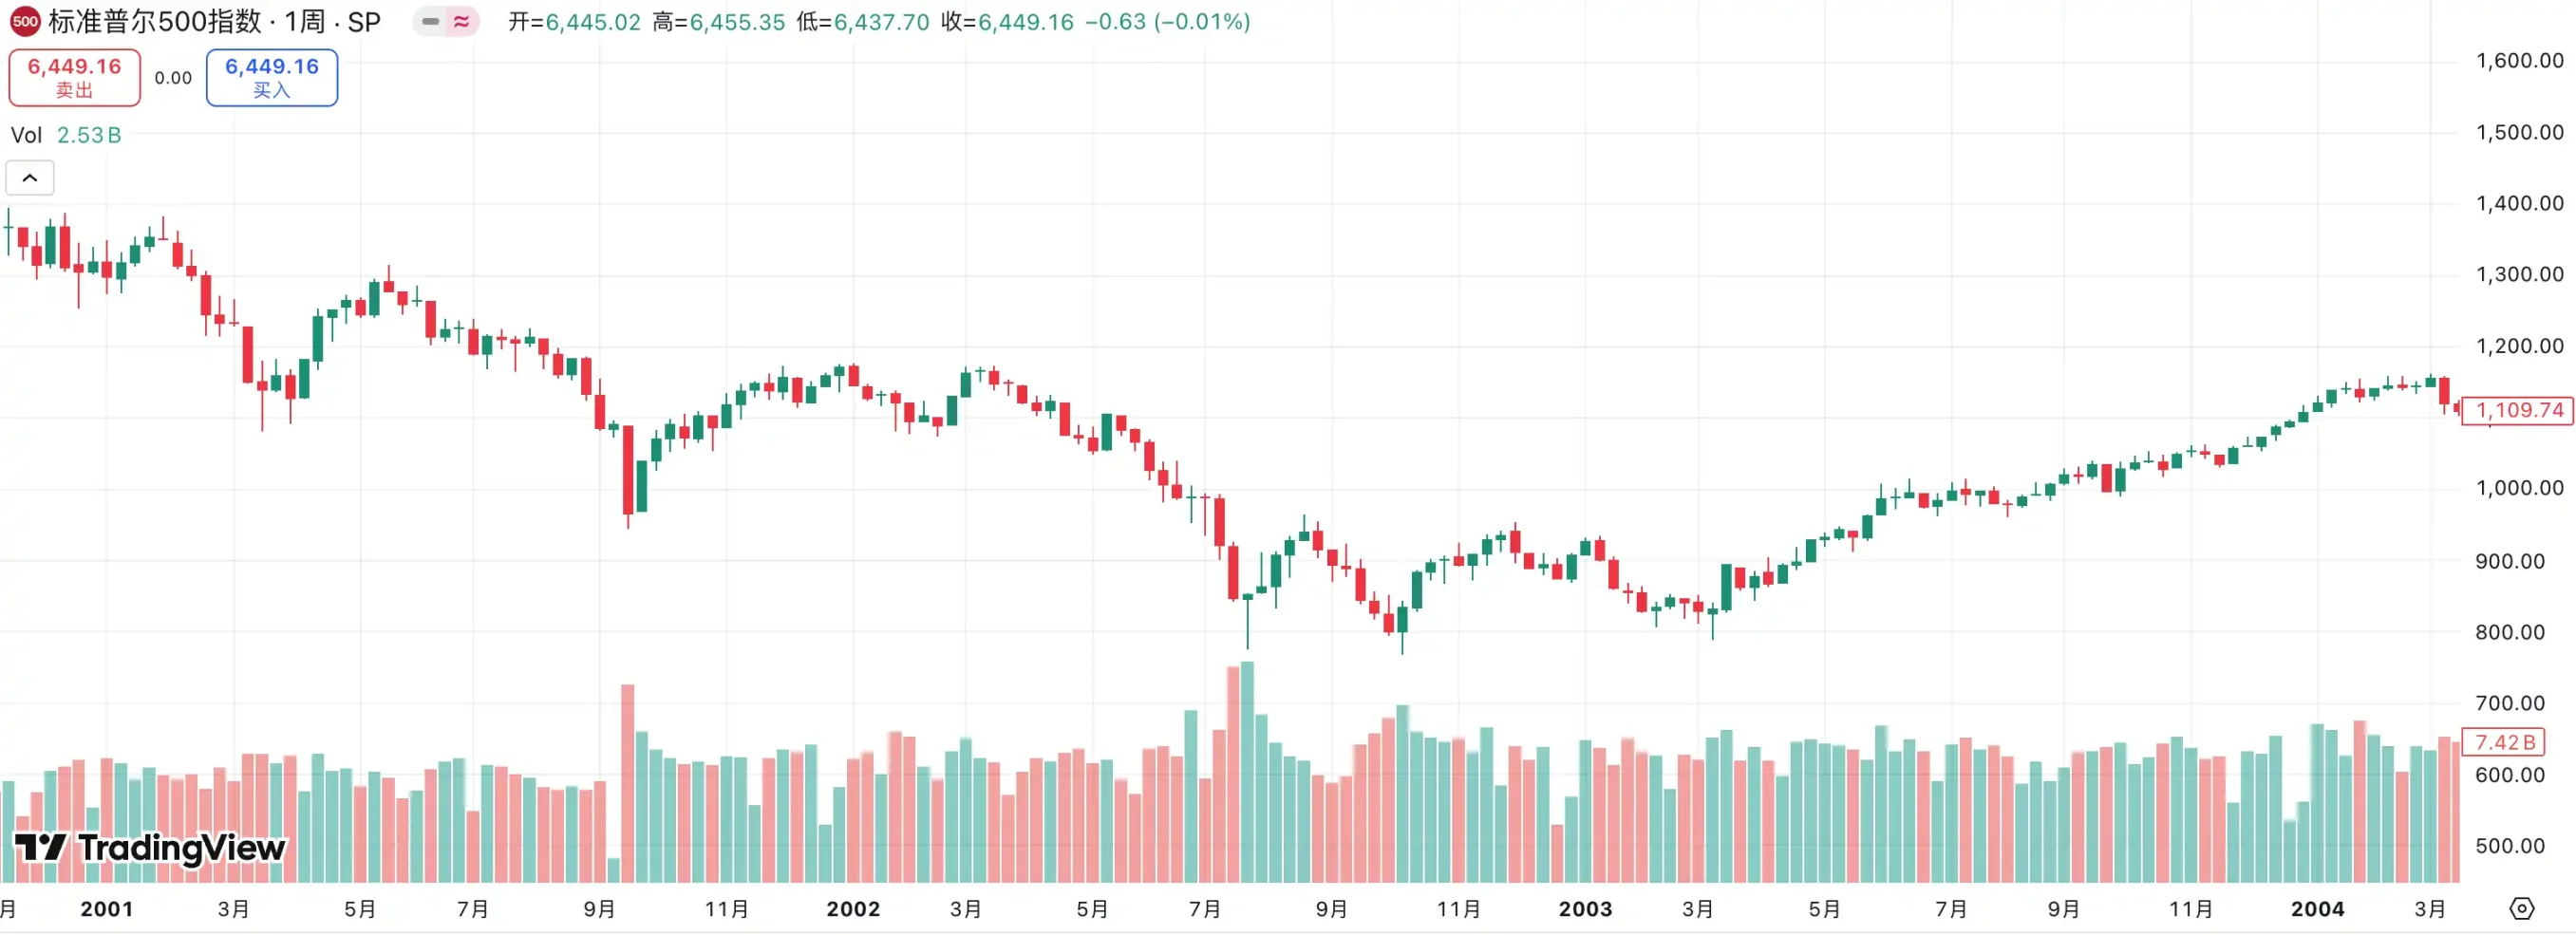
2001–2003: Recovery After the Dot-Com Bubble Burst
Between 2001 and 2003, the U.S. economy was hit by the bursting of the dot-com bubble, the 9/11 terrorist attacks, and a subsequent recession, plunging markets into deep pessimism. The collapse of the tech bubble triggered a stock market crash that quickly spilled into the real economy, causing sharp declines in business investment and rising unemployment, ultimately resulting in an eight-month-long recession. The fragile recovery was further derailed by the September 2001 terrorist attacks, which severely damaged financial markets and consumer confidence.
To counter these pressures, the Fed implemented one of the most aggressive easing campaigns in history over just two years. The federal funds rate dropped from 6.5% at the beginning of 2001 to 1.75% by December of that year, and further to 1% in June 2003—a total reduction of 500 basis points. The Fed aimed to stabilize the economy by stimulating corporate reinvestment and consumer spending through ultra-low financing costs.
The policy did help prevent a deeper systemic crisis, but the recovery was far from smooth. In 2002, U.S. real GDP growth was only 1.7%, business investment remained weak, and unemployment stayed high—the recovery struggled. However, as the easing measures gradually took effect, growth momentum improved noticeably in 2003–2004, with GDP growth reaching 3.85% in 2004, stabilizing the U.S. economy.
Yet the stock market response fell far short of expectations. Despite aggressive rate cuts, capital markets failed to reverse their downturn. All three major indices posted losses between 2001 and 2003: the Dow Jones fell 1.8%, the S&P 500 dropped 13.4%, and the tech-heavy Nasdaq plunged 12.6%. This period demonstrated that even massive monetary easing cannot instantly counteract the deep structural damage caused by a burst asset bubble.
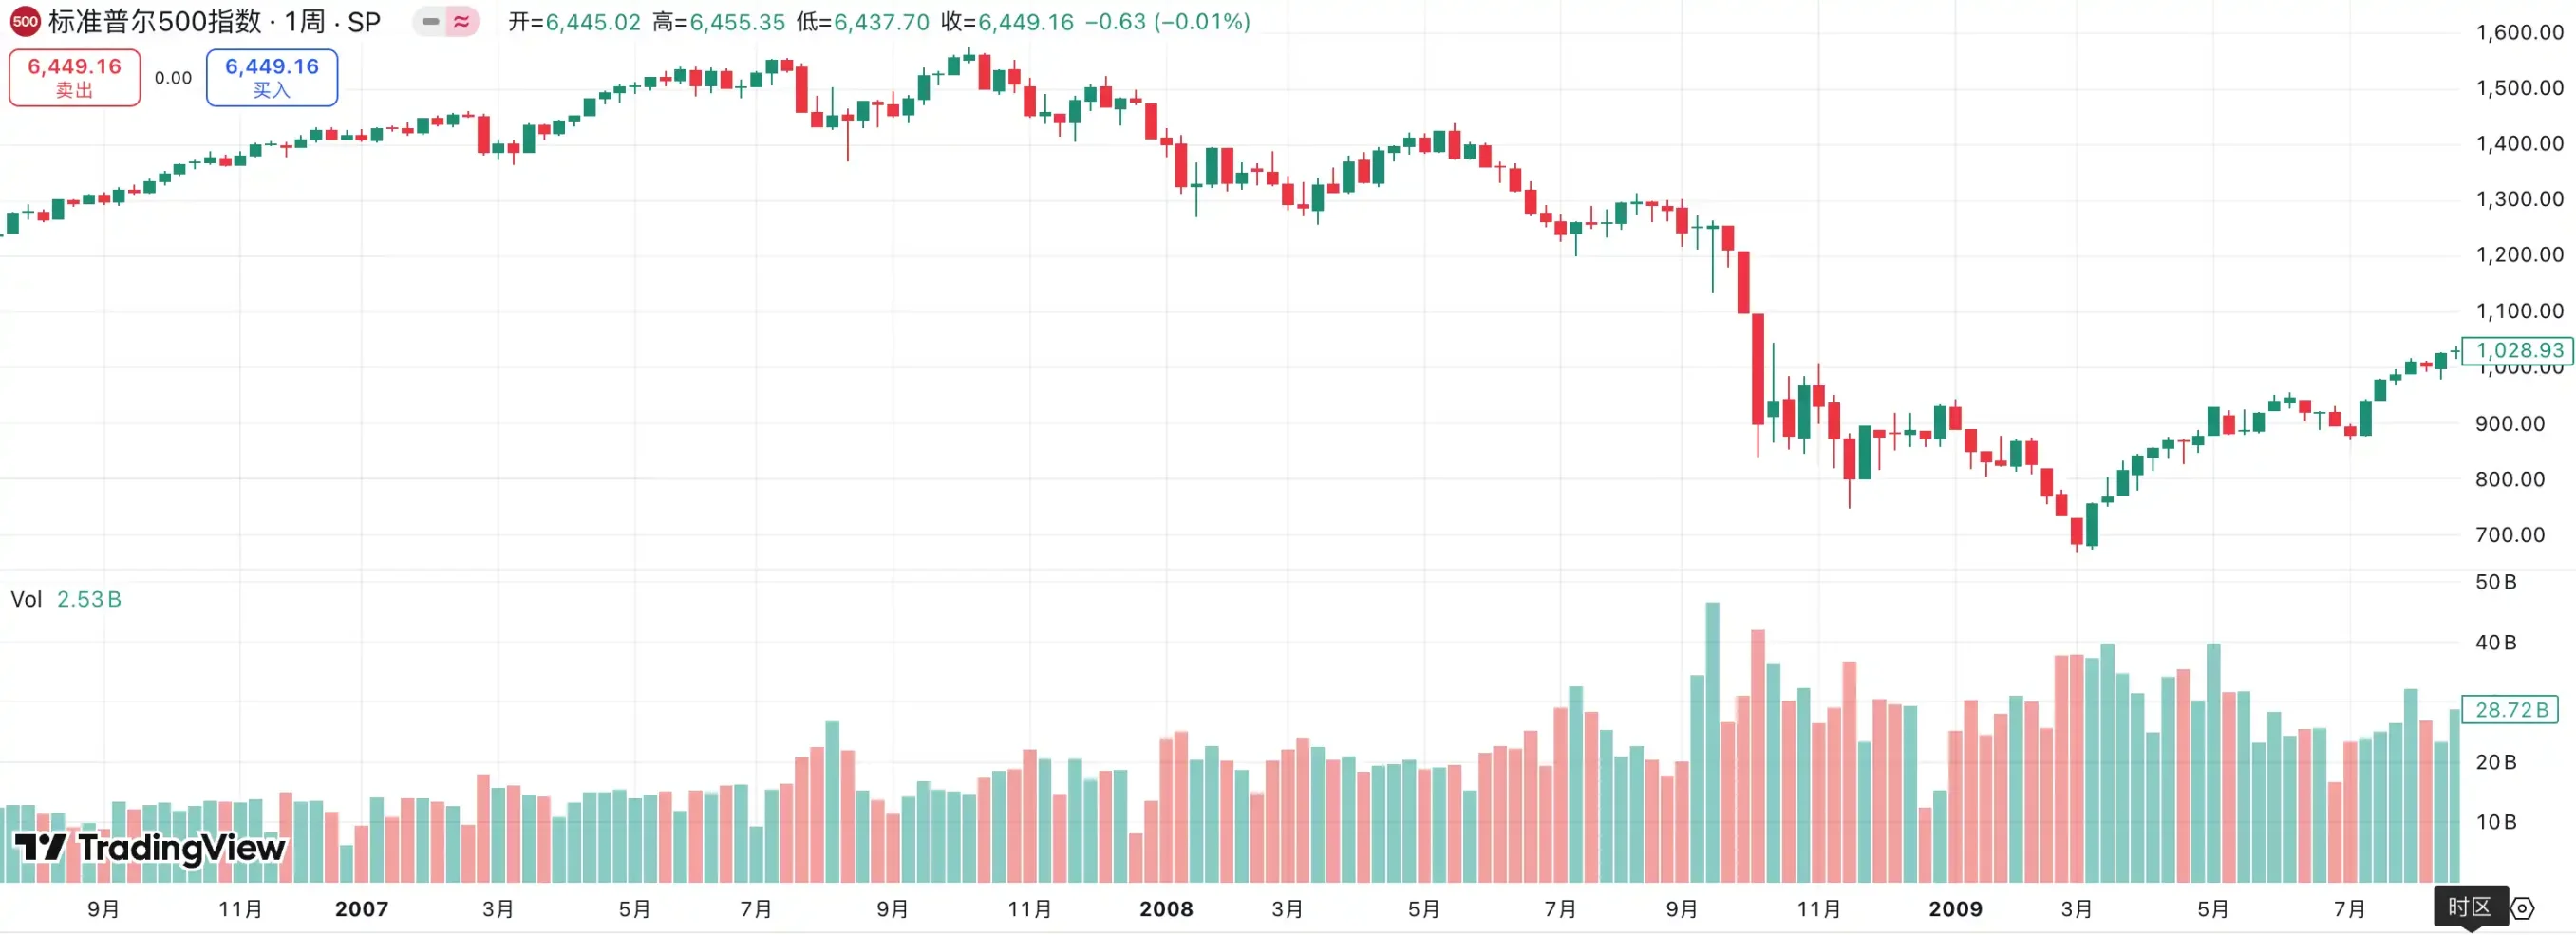
2007–2009: Financial Crisis and the Zero-Interest-Rate Era
From 2007 to 2008, the global financial crisis erupted fully, delivering a profound shock to the U.S. economy and financial system. The crisis originated in the collapse of the housing bubble and the concentrated failure of subprime mortgage loans. Previously, the U.S. housing market had enjoyed prolonged prosperity, but falling home prices led to mass borrower defaults. Financial institutions suffered heavy losses due to their exposure to large volumes of subprime loans and related derivatives, causing credit markets to freeze and liquidity to dry up abruptly.
Faced with escalating crisis, the Fed began an aggressive easing cycle in September 2007, slashing the federal funds rate from 5.25% to a range of 0–0.25% by the end of 2008—a total cut of 450 basis points, nearly hitting the zero lower bound. The goal was to stabilize financial markets and the banking system by injecting extreme liquidity and mitigate the impact of credit tightening on the real economy. In March 2008, the Fed facilitated JPMorgan Chase’s acquisition of the near-bankrupt Bear Stearns to prevent chain-reaction contagion.
Yet market panic did not subside. In September 2008, Lehman Brothers collapsed, marking the full onset of the financial crisis. Global markets plunged into a liquidity panic, U.S. unemployment soared above 10%, household and corporate assets shrank dramatically, and the economy sank into its worst recession since the Great Depression. CPI showed rare deflationary pressure, reflecting a cliff-like drop in demand.
Macro data shows that rate cuts failed to stop the recession's spread. U.S. GDP growth slowed to 1.9% in 2007, fell to -0.1% in 2008, and contracted further to -2.5% in 2009. Only in 2010, supported by ultra-loose monetary and fiscal stimulus, did the U.S. economy gradually stabilize, with GDP growth rebounding to 2.6%, setting the foundation for a decade-long expansion.
Stock market performance was devastating. Between 2007 and 2009, the Dow Jones plummeted 53.8%, the S&P 500 crashed 56.8%, and the Nasdaq tumbled 55.6%. This "Great Recession" revealed that relying solely on rate cuts is insufficient to resolve systemic financial collapse.
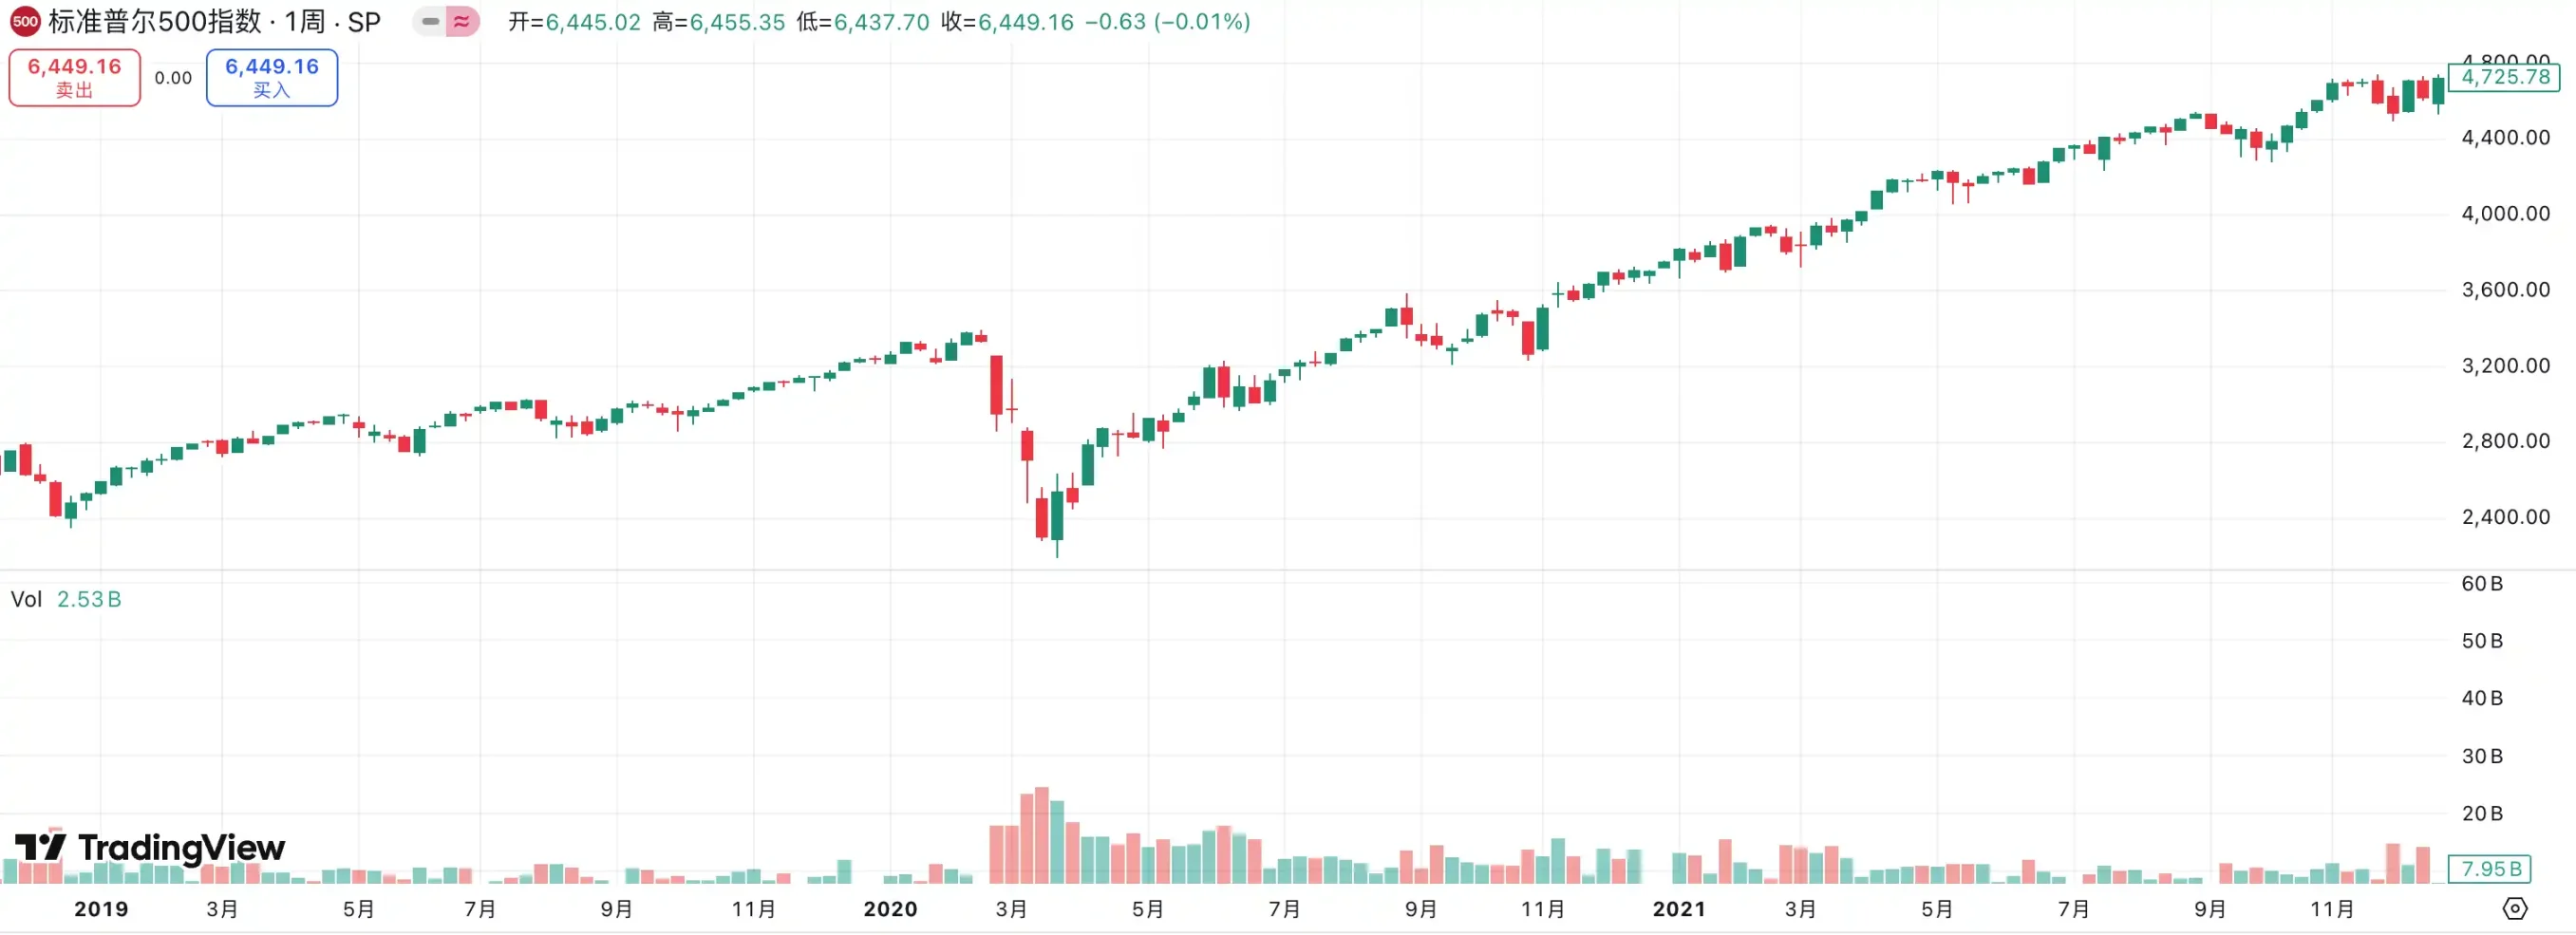
2019–2021: Preemptive Easing and Pandemic Shock
The Fed initiated a new easing cycle in August 2019, initially responding to downward pressure from global economic slowdown and U.S.-China trade tensions. However, this seemingly mild, preventive easing was pushed to extremes in early 2020 by the sudden outbreak of the COVID-19 pandemic. The virus spread rapidly, triggering unprecedented lockdowns and work stoppages, breaking global supply chains, collapsing consumption, spiking unemployment, and causing severe turmoil in financial markets amid widespread panic.
To stabilize the situation, the Fed urgently slashed the federal funds rate from 2.25% to 0.25% in March 2020, approaching zero, and launched an unlimited quantitative easing program alongside massive fiscal stimulus. The central bank's balance sheet expanded rapidly. This was not merely a rate cut, but an exceptionally rare "unconventional" monetary move, demonstrating the Fed’s determination to safeguard the financial system and economic foundation.
Macro data shows that the U.S. economy remained relatively stable in 2019, with GDP growth of 2.3%—lower than previous years but still within a healthy range. However, 2020 became a turning point as the pandemic struck, with U.S. GDP contracting by -3.4%, the worst decline since the 2008 crisis. Thanks to the powerful combination of ultra-loose monetary and fiscal policies, the U.S. economy rebounded sharply in 2021, growing 5.7%, one of the fastest recoveries in four decades.
Equity market performance was equally dramatic. After a steep plunge in March 2020, U.S. stocks staged a "V-shaped reversal," then surged relentlessly: from 2019 to 2021, the S&P 500 gained 98.3%, the Nasdaq soared 166.7%, and the Dow Jones rose 53.6%. The extreme easing and flood of liquidity during the pandemic ultimately fueled the fastest liquidity-driven bull market in U.S. history.
How the Two Largest Crypto Bull Markets in History Unfolded
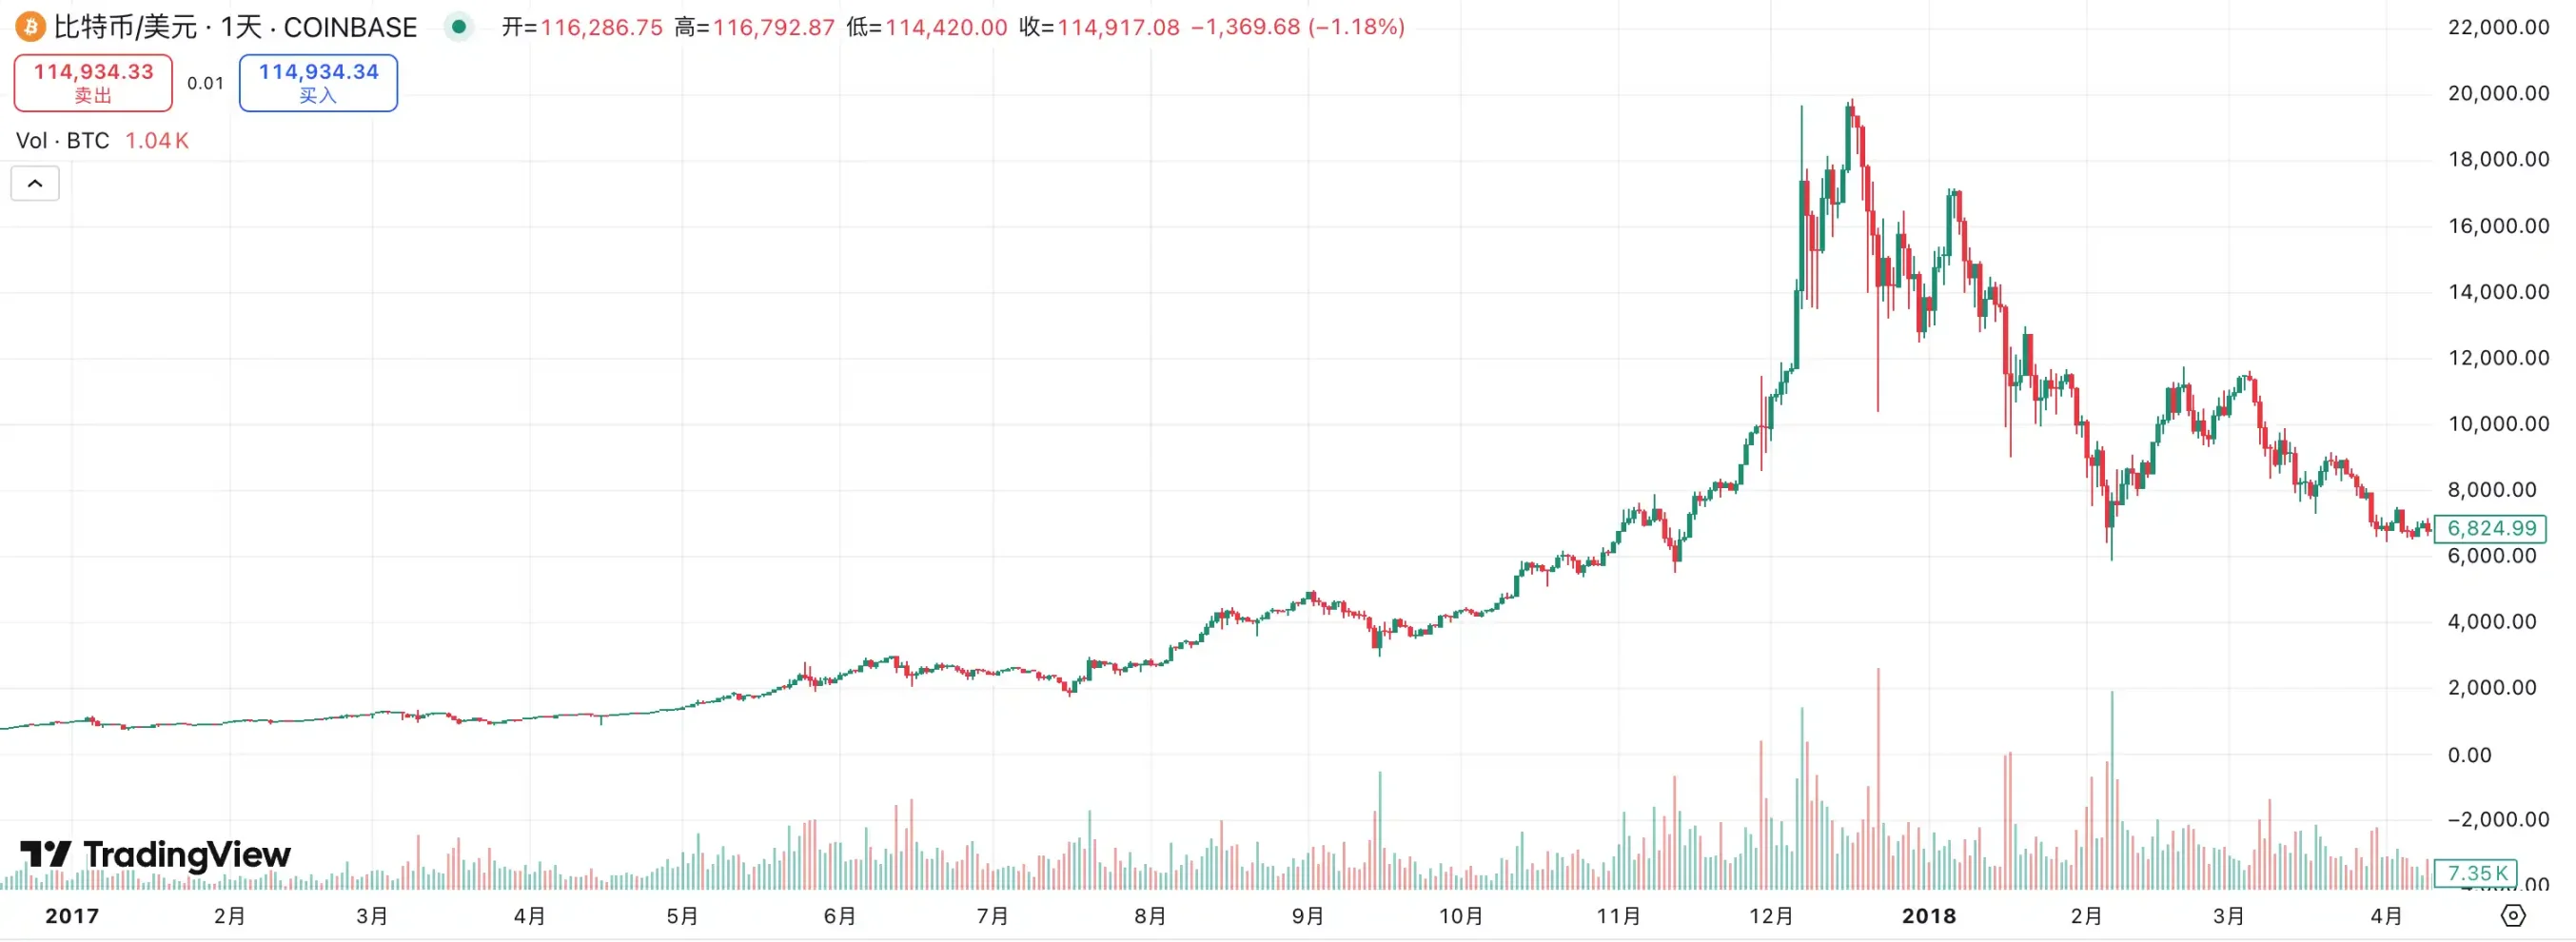
2017: ICO Mania and the First Crypto Bubble
2017 is widely seen as the "first major breakout" of the crypto market and the moment altcoins truly entered public consciousness. Macro-economically, the global economy was in recovery mode, with solid U.S. economic performance. Although the Fed had begun raising rates, overall interest levels remained historically low, and liquidity from prior monetary easing continued circulating in markets. This environment provided fertile ground for speculative assets.
Bitcoin’s price surged from under $1,000 at the start of the year to nearly $20,000 by year-end. Its explosive growth attracted massive new capital and retail investors into the market. Against this backdrop, altcoins experienced unprecedented prosperity. Unlike previous cycles, the main driver in 2017 was the ICO model: almost any project could launch a token on Ethereum and raise funds quickly. A flood of new coins emerged, creating a "hundred altcoins soaring together" phenomenon.
Ethereum was undoubtedly the core beneficiary. As most ICOs were built on Ethereum, it became the primary gateway for capital inflows. ETH’s price skyrocketed from a few dollars to $1,400 within a year, lifting valuations across the entire altcoin sector. Meanwhile, tokens across categories—from public blockchains, payments, storage, to various novel concepts—regardless of narrative strength, attracted rapid funding.
Yet behind the frenzy lay a bubble. The 2017 altcoin season was essentially a liquidity-fueled speculative spree, driven more by "new stories" than real-world applications. In early 2018, as Bitcoin peaked and reversed, most altcoins corrected by 80%–90%. Projects lacking fundamentals quickly went to zero, leaving behind a trail of wreckage.
Looking back, the 2017 altcoin season established the first global awareness of crypto markets: digital assets can generate massive wealth effects when driven by liquidity and narratives, but also expose extreme risks when bubbles burst.
2021: Flood of Liquidity and the DeFi and NFT Boom
If the 2017 altcoin season was a speculative feast ignited by ICOs, the 2021 altcoin rally was a full-scale狂欢 under a global flood of liquidity.
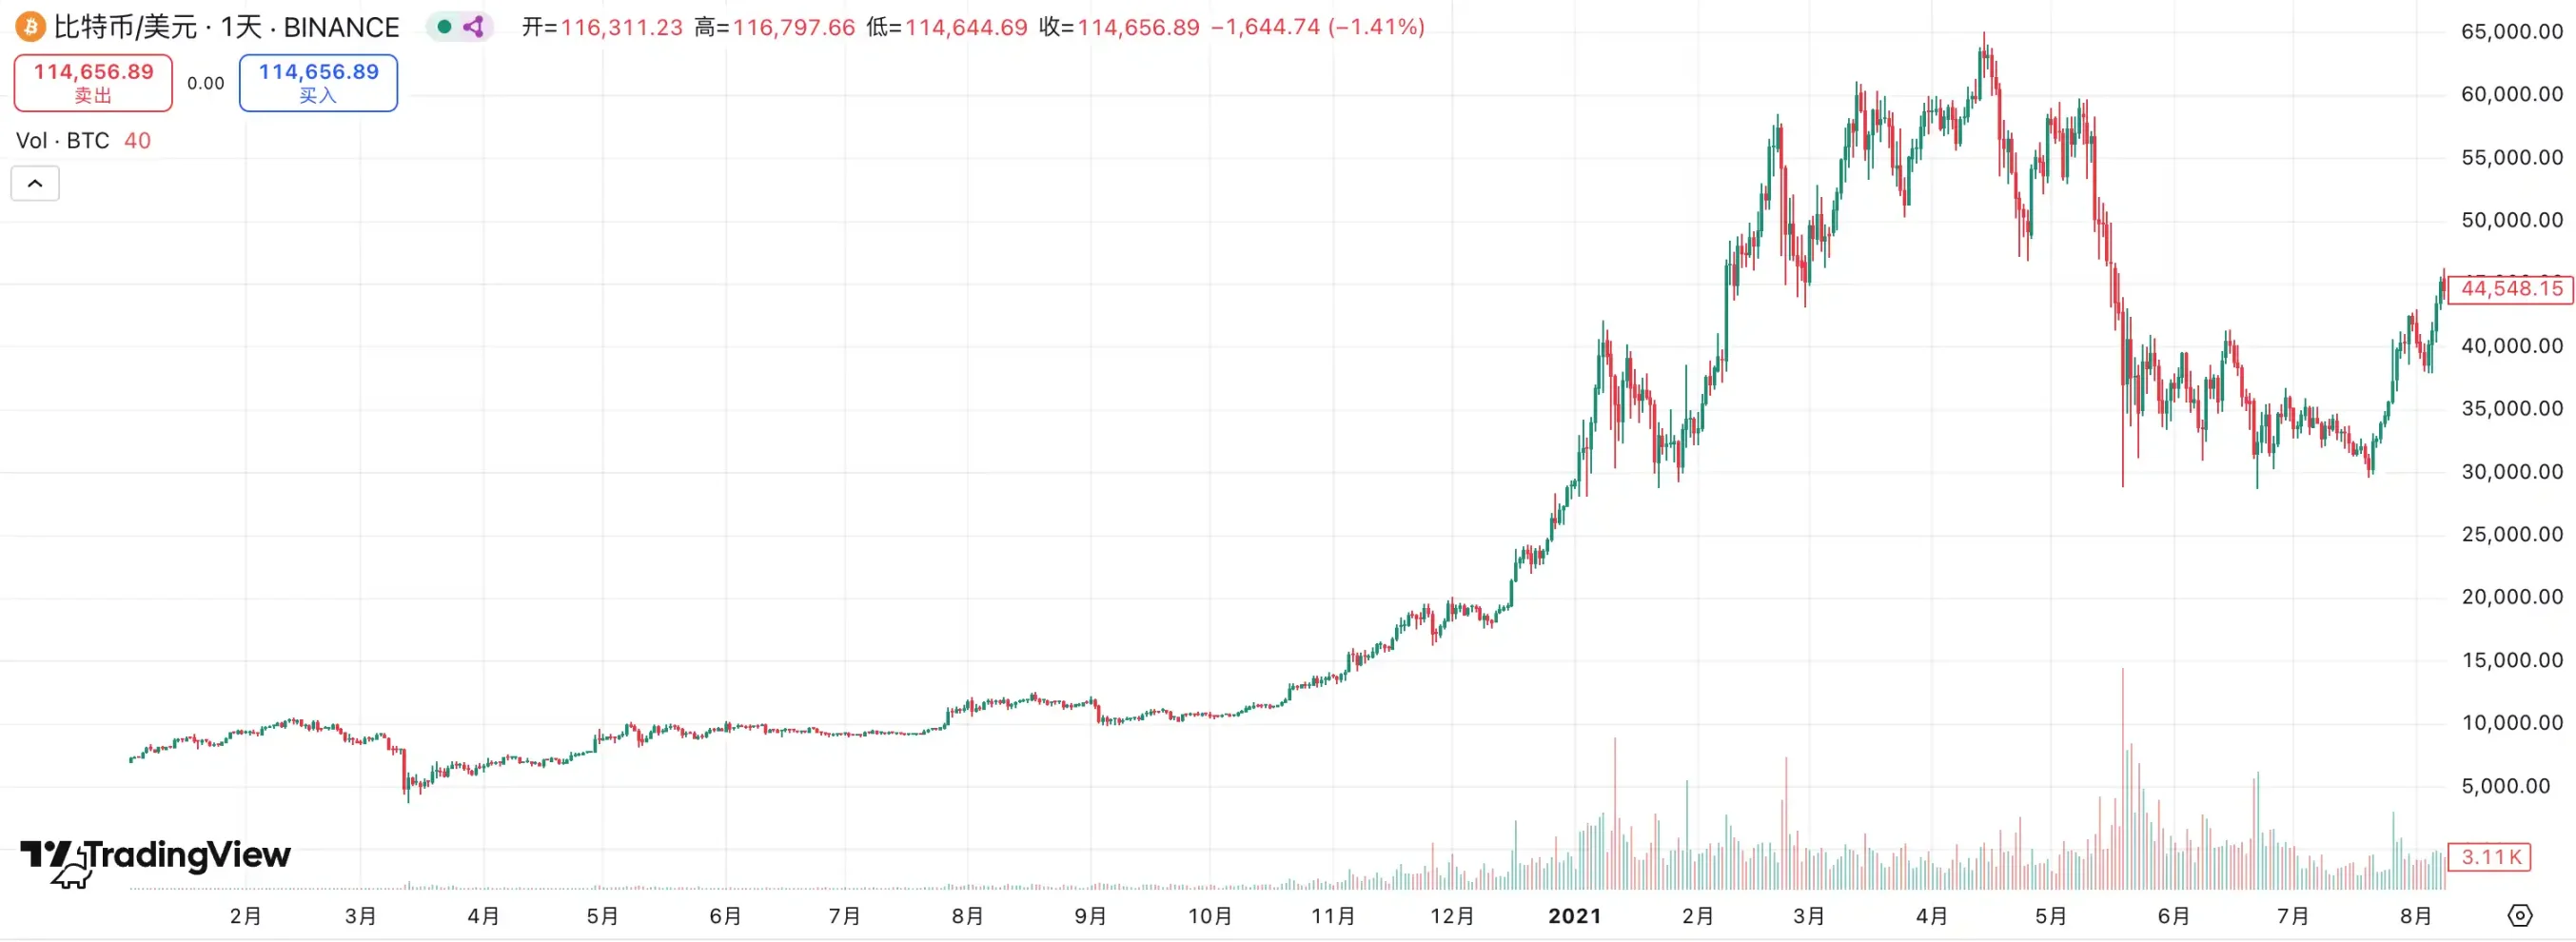
On the macro front, the pandemic hit in early 2020, prompting the Fed to slash interest rates to near zero and launch an unprecedented quantitative easing (QE) program. At the same time, the U.S. government rolled out massive fiscal stimulus, sending direct cash payments to citizens. The dual boost of loose monetary and fiscal policy flooded financial markets with liquidity, inflating both traditional and risk assets. After the V-shaped rebound in 2020, Bitcoin broke $20,000 by year-end and quickly surged past $60,000 in Q1 2021, opening space for altcoin rallies.
Unlike the 2017 "single-point explosion" centered on ICOs, the 2021 altcoin season featured a "multi-track surge." First was the rapid rise of DeFi. Protocols like Uniswap, Aave, and Compound saw fast-growing TVL (total value locked), driving independent price rallies for DeFi tokens. Second was the emergence of NFTs. Projects like CryptoPunks and Bored Ape made "digital collectibles" a global talking point, with OpenSea and other platforms seeing explosive trading volume growth. Meanwhile, Ethereum’s ecosystem boom catalyzed the rise of new layer-1 chains like Solana, Avalanche, and Polygon, officially kicking off a new era of blockchain competition.
Under these narratives, ETH climbed from under $1,000 to $4,800; SOL surged from under $2 to $250, becoming one of the year’s biggest dark horses. The total crypto market cap exceeded $3 trillion in November 2021, reaching an all-time high.
Yet rapid expansion planted seeds of a bubble. Copycat projects, over-financialized DeFi products, and meme coins with no fundamental backing surged in popularity during the liquidity rush, only to collapse sharply when liquidity retreated. As the Fed began hiking rates in 2022, global funding tightened, cooling the crypto market rapidly. Altcoins broadly corrected by 70%–90%.
Reviewing this phase, the 2021 altcoin season showcased how crypto markets, driven by a flood of liquidity and diverse narratives, can reach extreme levels of prosperity.
Current Implications: Preemptive Easing and the Altcoin Season
Historically, Fed rate cuts fall into two categories: preemptive and emergency. The cuts in 1990, 1995, and 2019 belong to the former—they occurred before full-blown recessions, primarily to hedge risks, and often injected fresh momentum into markets. In contrast, the 2001 and 2008 cuts were forced responses to severe financial crises, accompanied by sharp market declines. Today, with softening labor markets, uncertainty from tariffs and geopolitics, yet signs of moderating inflation, the current backdrop resembles "preemptive easing" more than a crisis scenario. This explains why risk assets have strengthened steadily this year, with both Bitcoin and U.S. stocks hitting record highs.
The crypto market also faces a different landscape. Regulatory developments bring unprecedented tailwinds: stablecoins are gradually being brought into compliance frameworks; digital asset treasuries (DAT) and corporate treasury management, exemplified by MicroStrategy, are becoming institutional trends; ETFs allow formal institutional entry; and tokenization of real-world assets (RWA) is gaining traction. These overlapping narratives are expanding the market base beyond anything seen before.
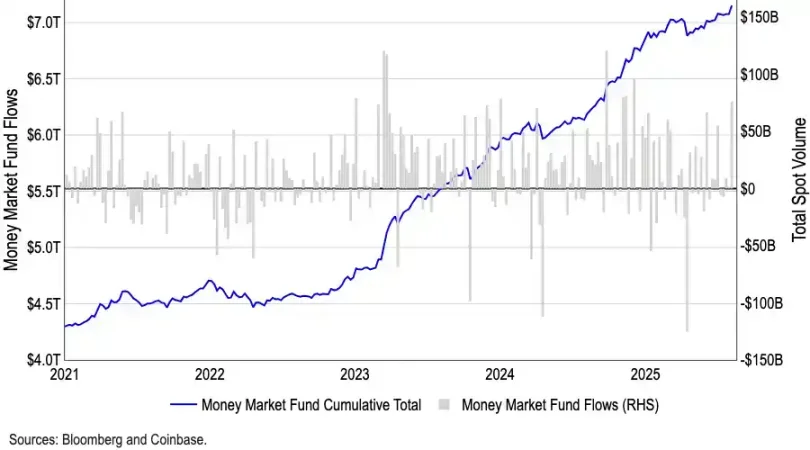
While many debate whether the September rate cut might cause crypto to peak in the short term, from a capital flow perspective, such concerns may be overblown. U.S. money market funds have reached a record $7.2 trillion, with vast amounts of capital trapped in low-risk instruments. Historically, outflows from money market funds correlate positively with gains in risk assets. As rate cuts take effect and yields diminish, more capital is likely to flow into crypto and other high-risk assets. In fact, this unprecedented pool of cash represents the most potent powder keg fueling the current bull market.
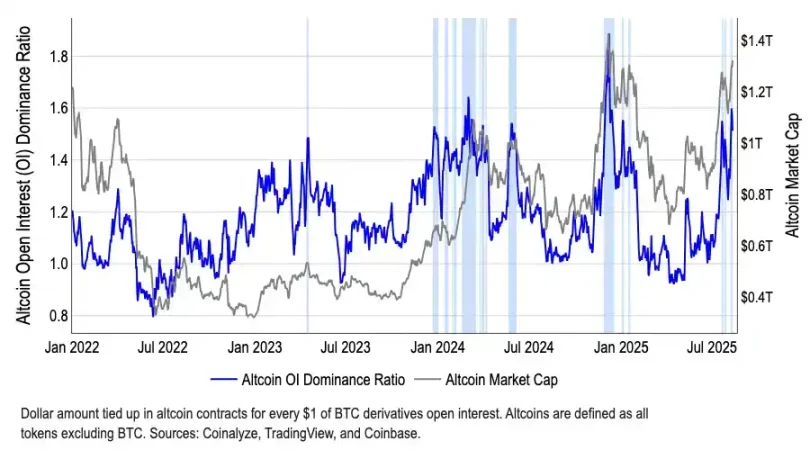
Additionally, structurally, capital is already beginning to rotate out of Bitcoin. BTC’s market dominance has declined from 65% in May to 59% in August. Meanwhile, the total market cap of altcoins has grown over 50% since early July, reaching $1.4 trillion. Although CoinMarketCap’s "Altcoin Season Index" remains around 40—far below the traditional 75 threshold for defining an altcoin season—this divergence between "weak indicators" and "soaring market cap" precisely reveals that capital is selectively flowing into specific sectors, particularly Ethereum (ETH). ETH benefits not only from institutional interest via ETFs amassing over $22 billion in assets, but also anchors key narratives around stablecoins and RWA, giving it greater capital appeal than Bitcoin.
Conclusion
The logic behind this bull market differs fundamentally from past cycles. With a vast number of projects, the market can no longer replicate the "everything soars" phenomenon. Investor focus is shifting toward value investing and structural opportunities—capital flows preferentially to top-tier projects with real cash flows, regulatory clarity, or compelling narratives, while long-tail assets without fundamentals are inevitably marginalized.
At the same time, overall market valuations are already high, and it remains unclear whether treasury strategies face risks of "over-financialization." Should institutions or project teams begin concentrated selling, it could easily trigger a stampede, inflicting deep damage on the market. Combined with ongoing global macro uncertainties—such as tariffs and geopolitical tensions—investors must not overlook potential volatility.
Therefore, while we remain optimistic about crypto assets under the current easing cycle and favorable policy environment, we must acknowledge this is more likely a structural bull market rather than a broad-based rally. Rational investing and careful sector selection are key to navigating the turbulence ahead.
Join TechFlow official community to stay tuned
Telegram:https://t.me/TechFlowDaily
X (Twitter):https://x.com/TechFlowPost
X (Twitter) EN:https://x.com/BlockFlow_News


