








ETH approaches all-time high—will it surge to $10,000 or face a deep correction?
TechFlow Selected TechFlow Selected
ETH approaches all-time high—will it surge to $10,000 or face a deep correction?
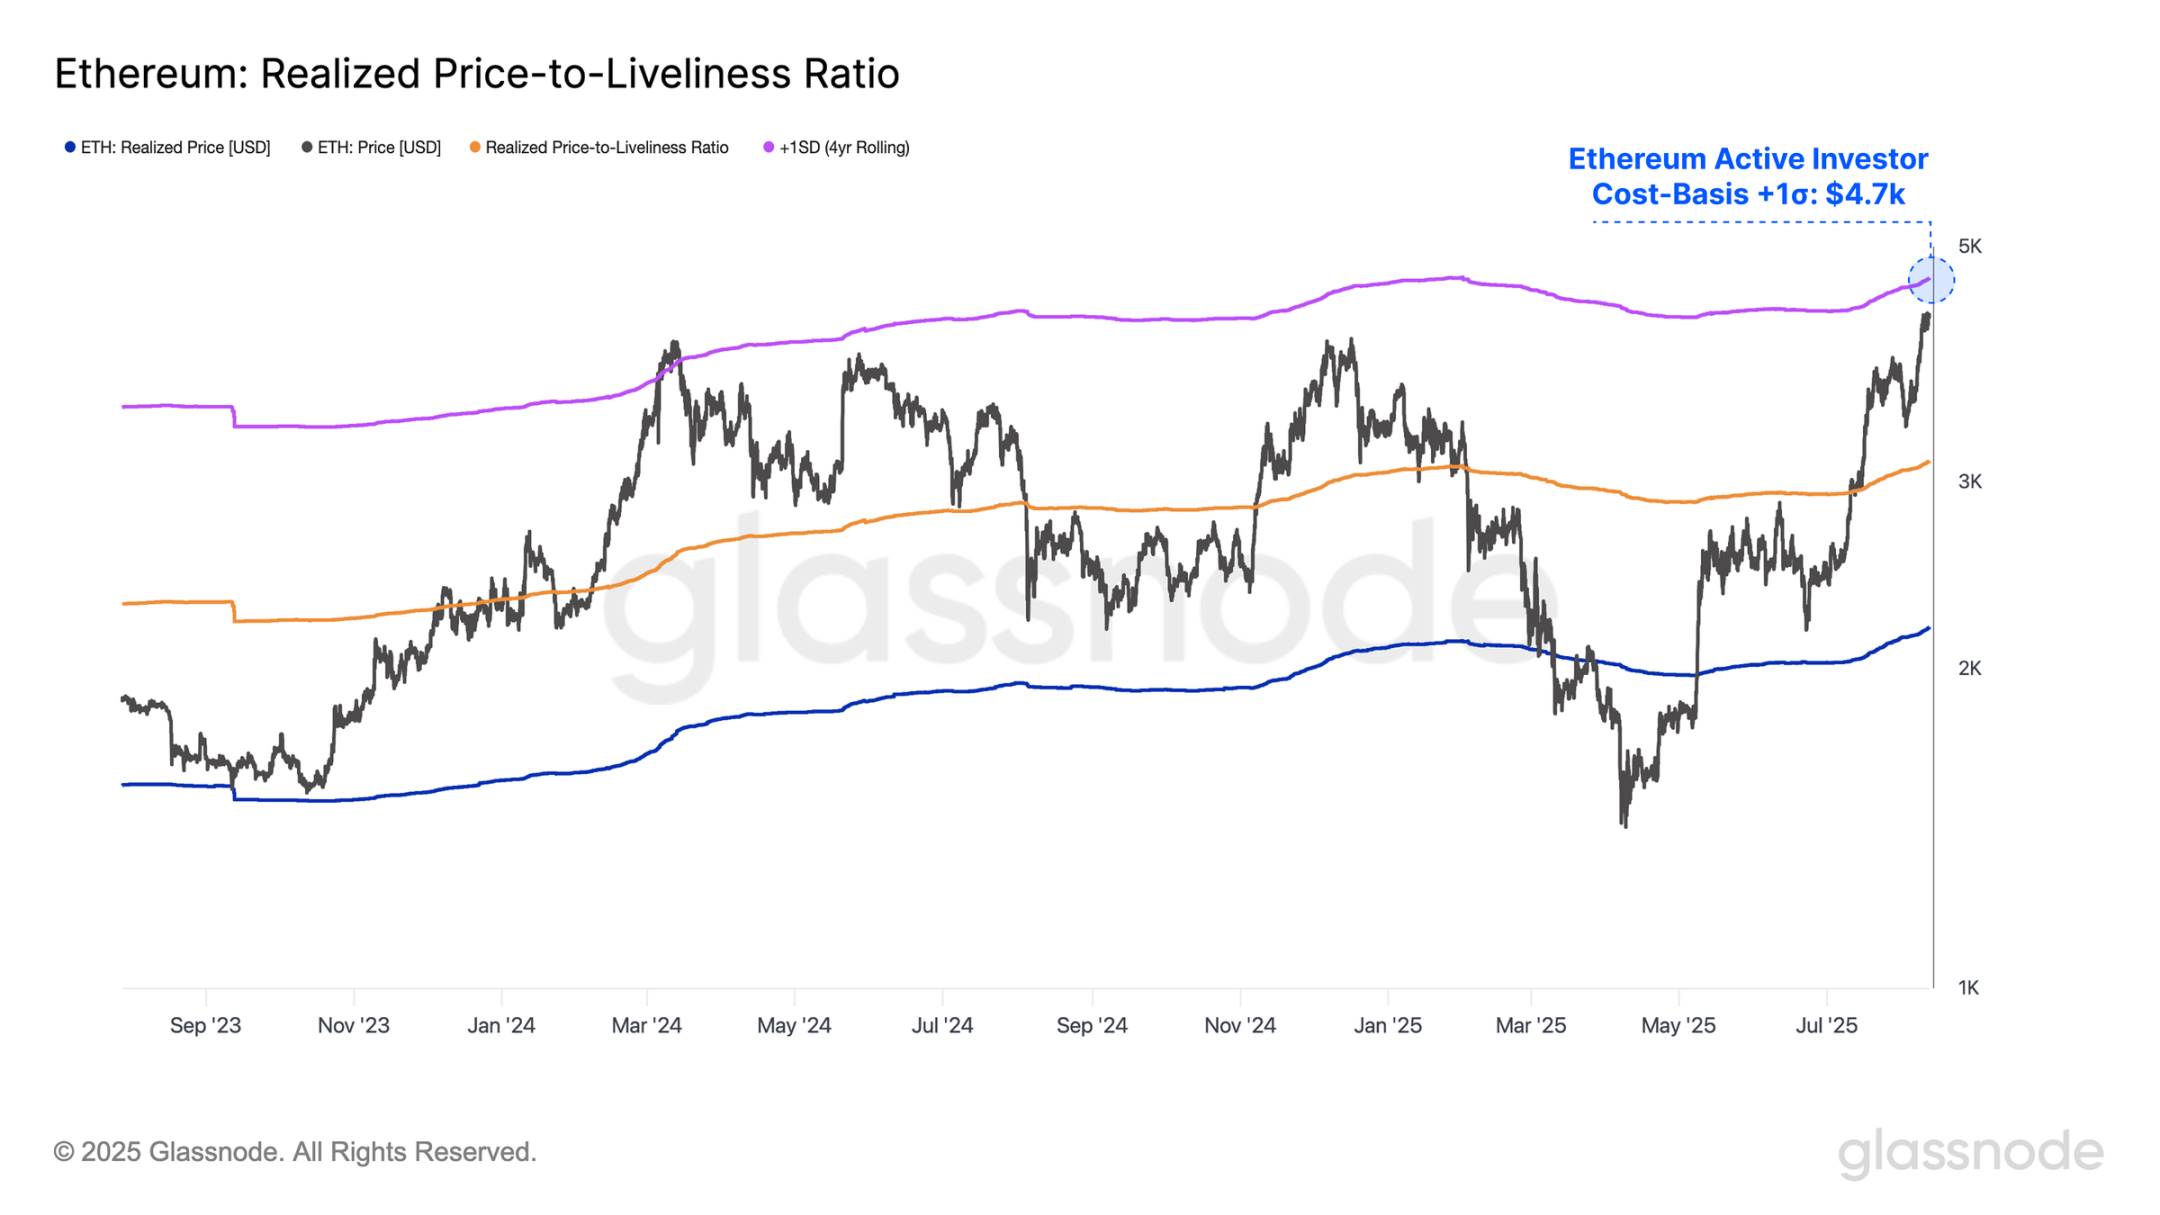
Ethereum is approaching its +1σ active realized price level of $4,700, an area that has historically triggered strong selling pressure.
 Navigating Web3 tides with focused insights
Writing: UkuriaOC, CryptoVizArt, Glassnode
Translation: AididiaoJP, Foresight News
Ethereum's price continues to strengthen, moving toward its all-time high, while Bitcoin consolidates below its peak. However, the surge in open interest among major altcoins, combined with abnormally low expectations for Bitcoin volatility, sets the stage for increased volatility across digital asset markets.
Summary
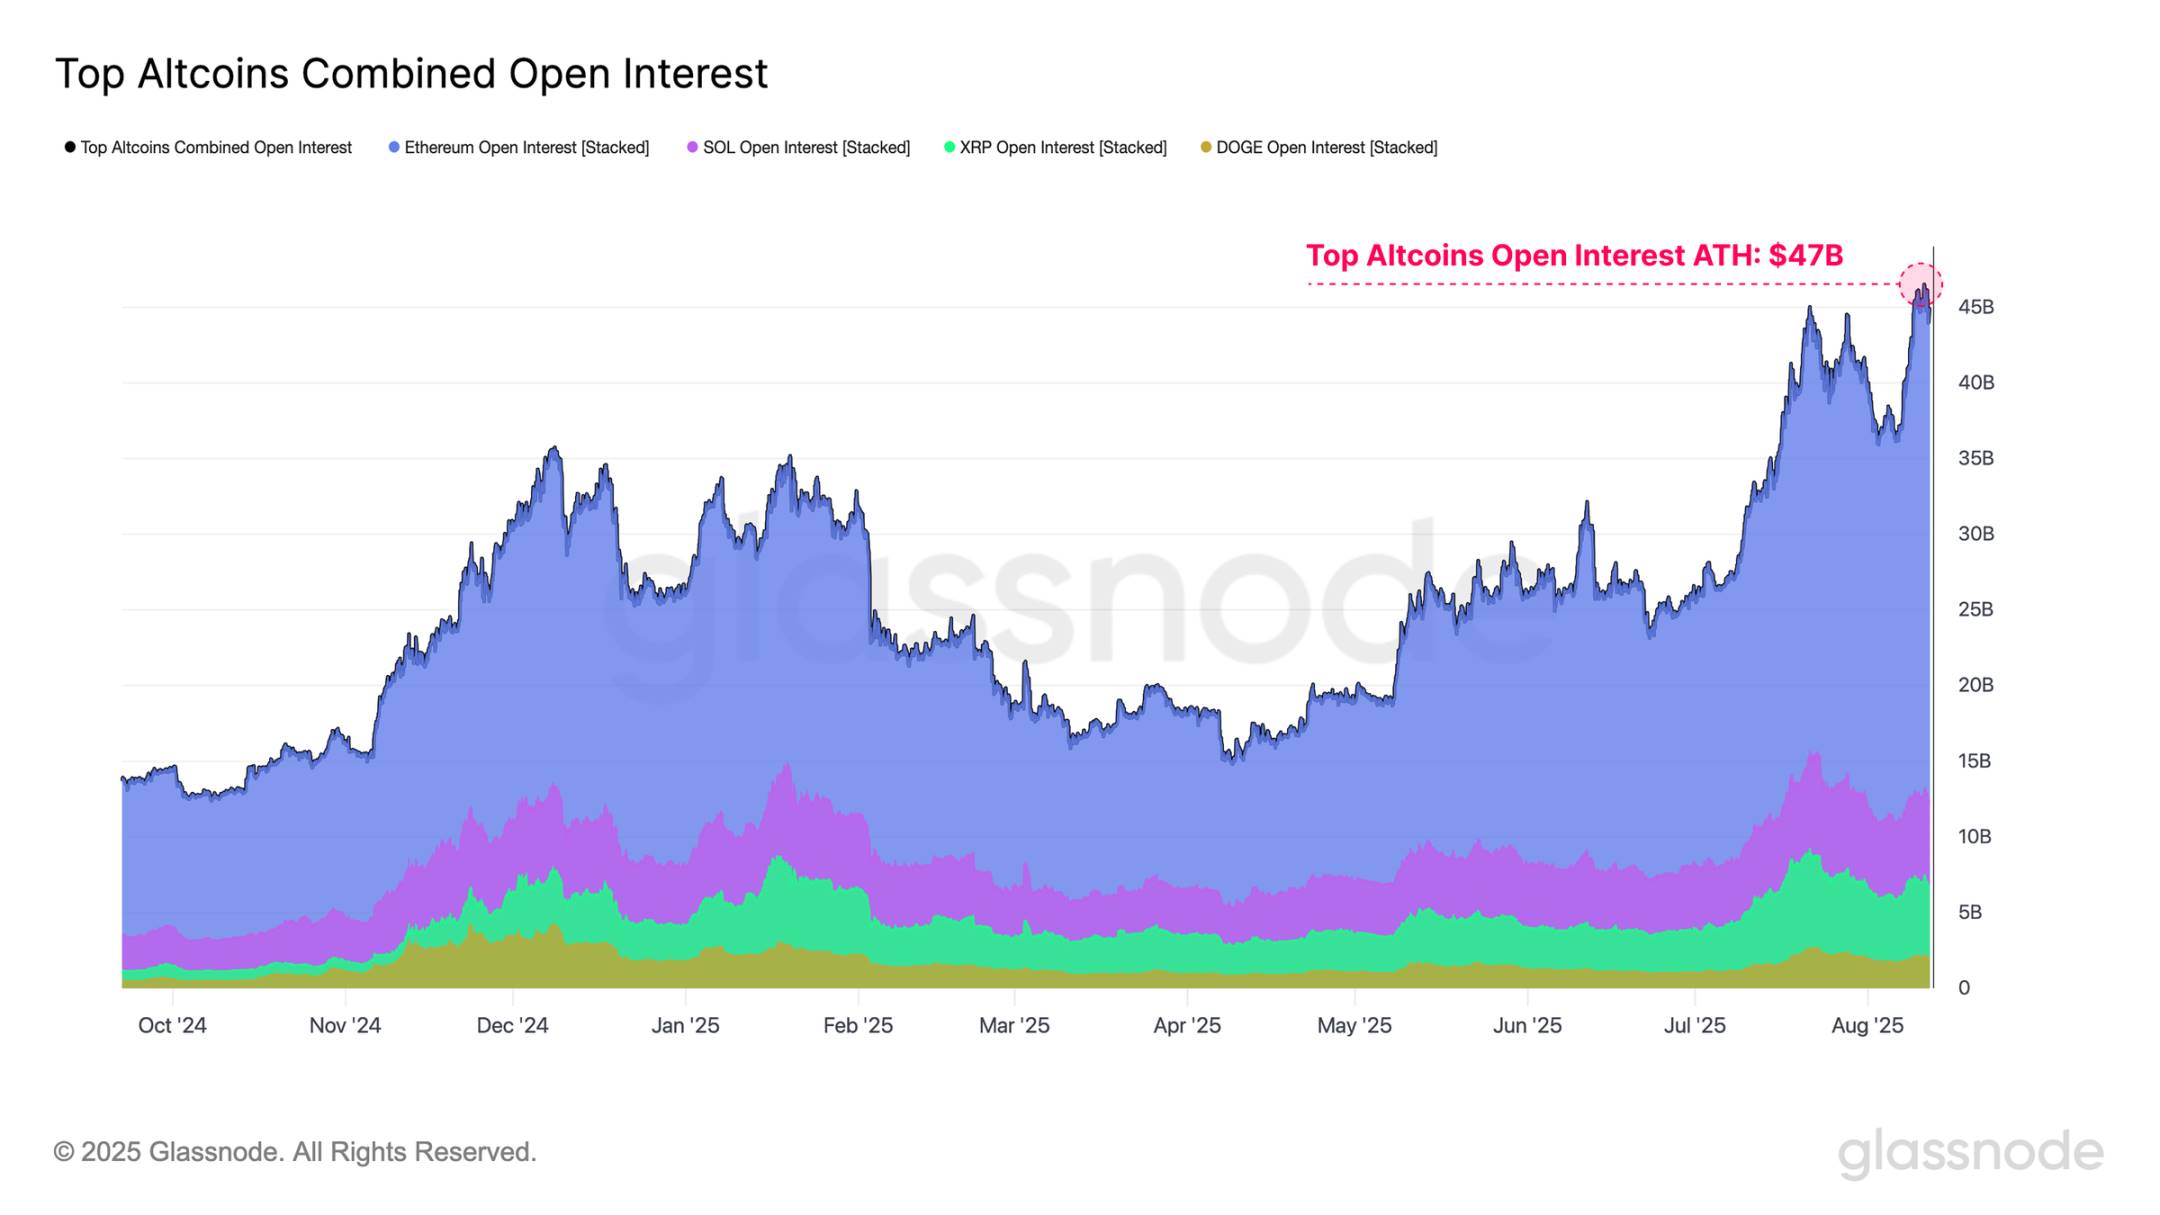
Ethereum’s rally is accelerating, reaching $4,600—the highest level since December 2021—just around 5% below its previous all-time high. Yet, speculation around this leading altcoin is growing, pushing total open interest across major altcoins to a record $47 billion. This accumulation of leverage creates a more volatile market backdrop where price shocks are becoming increasingly reflexive.
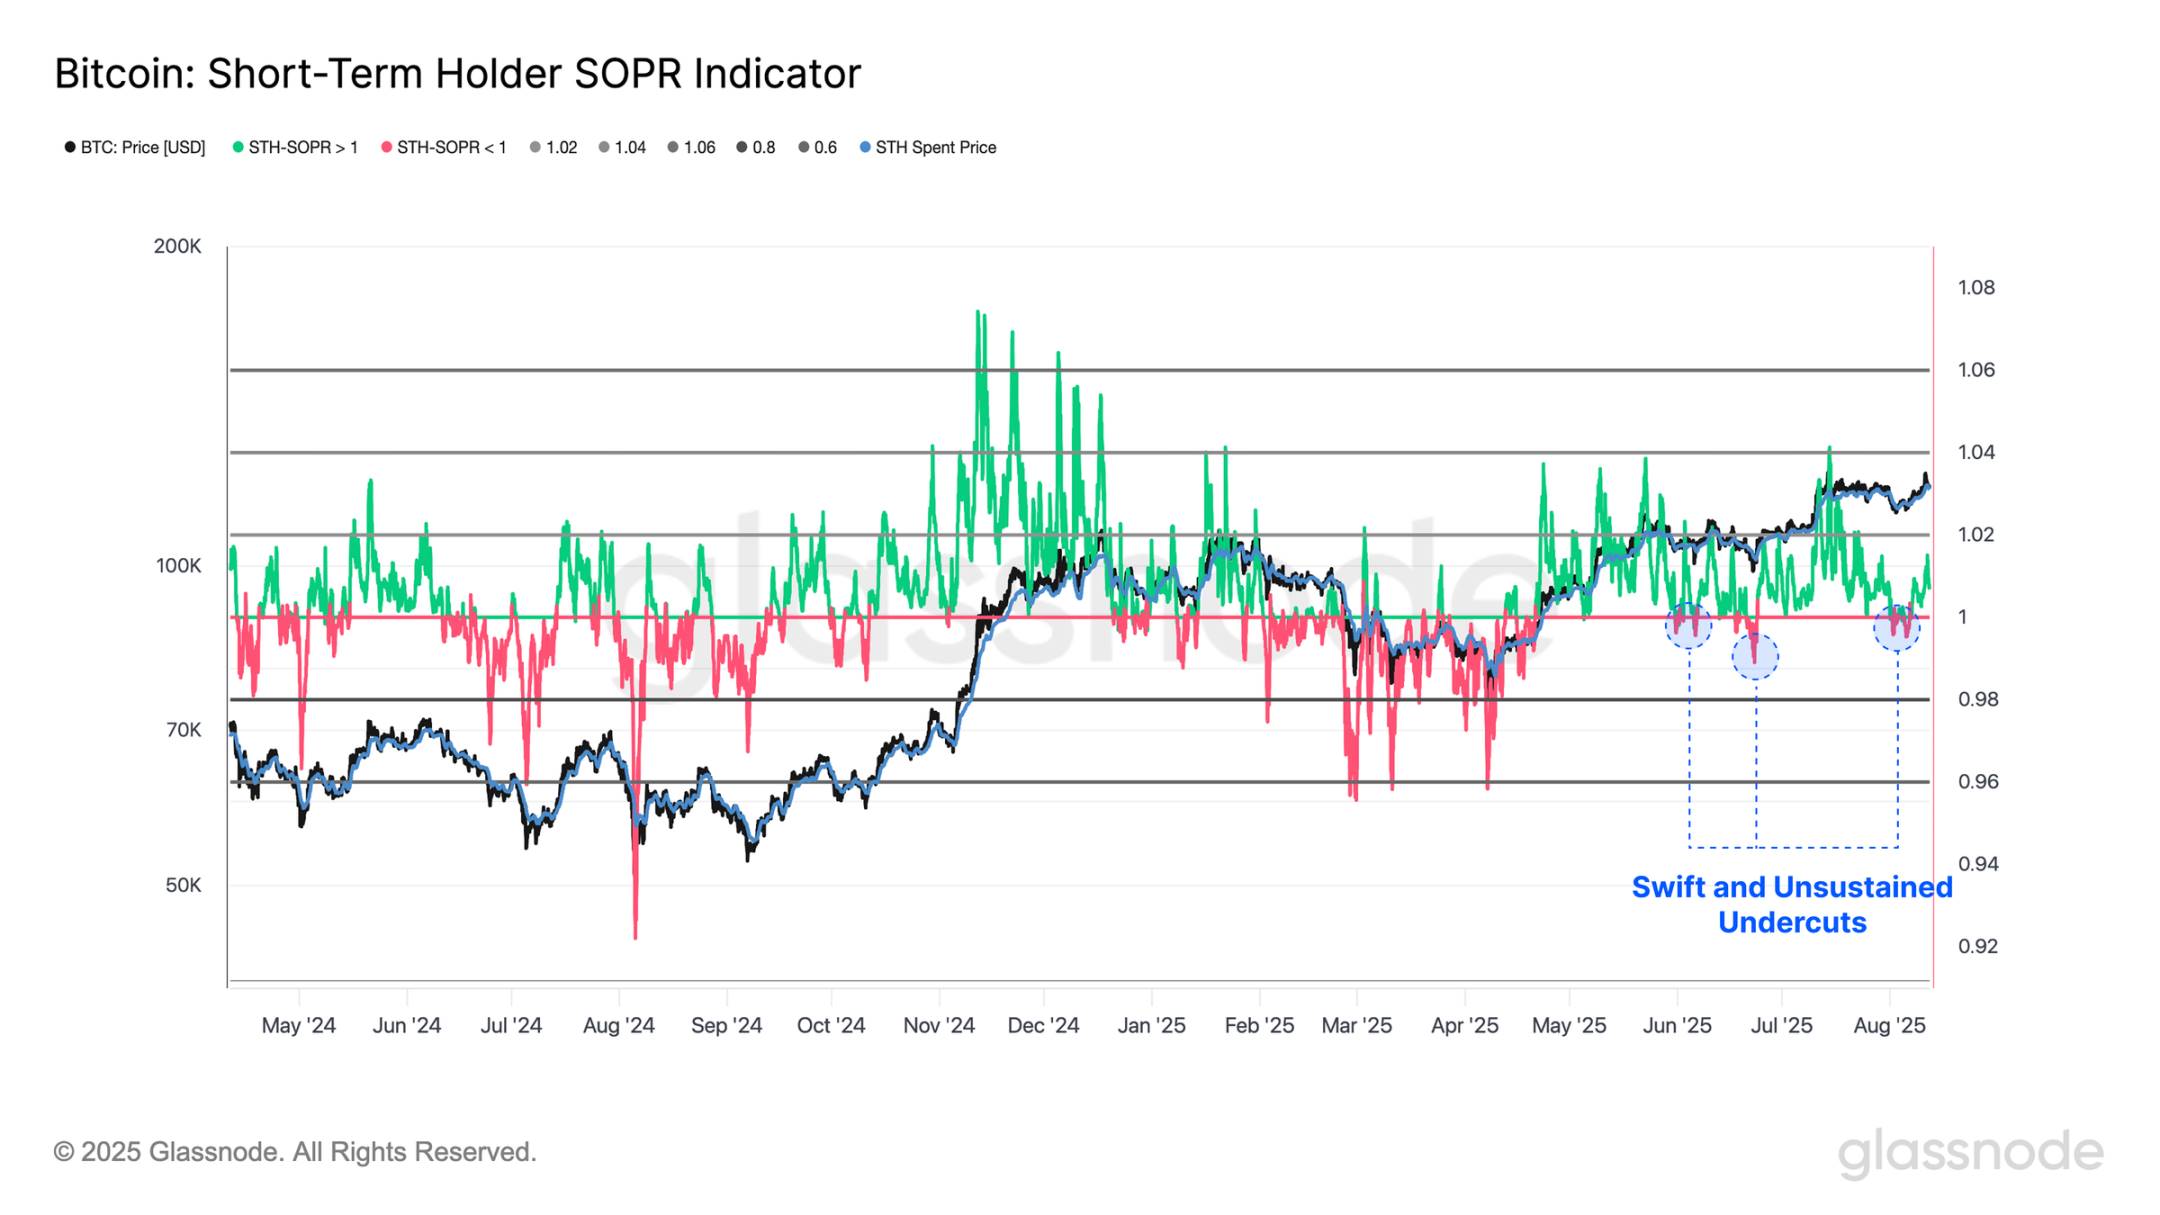
Key on-chain indicators for Bitcoin show strong momentum remains intact. Realized losses among short-term holders during the recent pullback to $112,000 were notably low, and the vast majority of investors remain in profit.
Options traders continue to bet on low volatility regimes, with at-the-money implied volatility (IV) across all maturities at multi-year lows. Historically, such periods of unusually subdued implied volatility often precede sharp expansions in realized volatility, making this a potential contrarian signal.
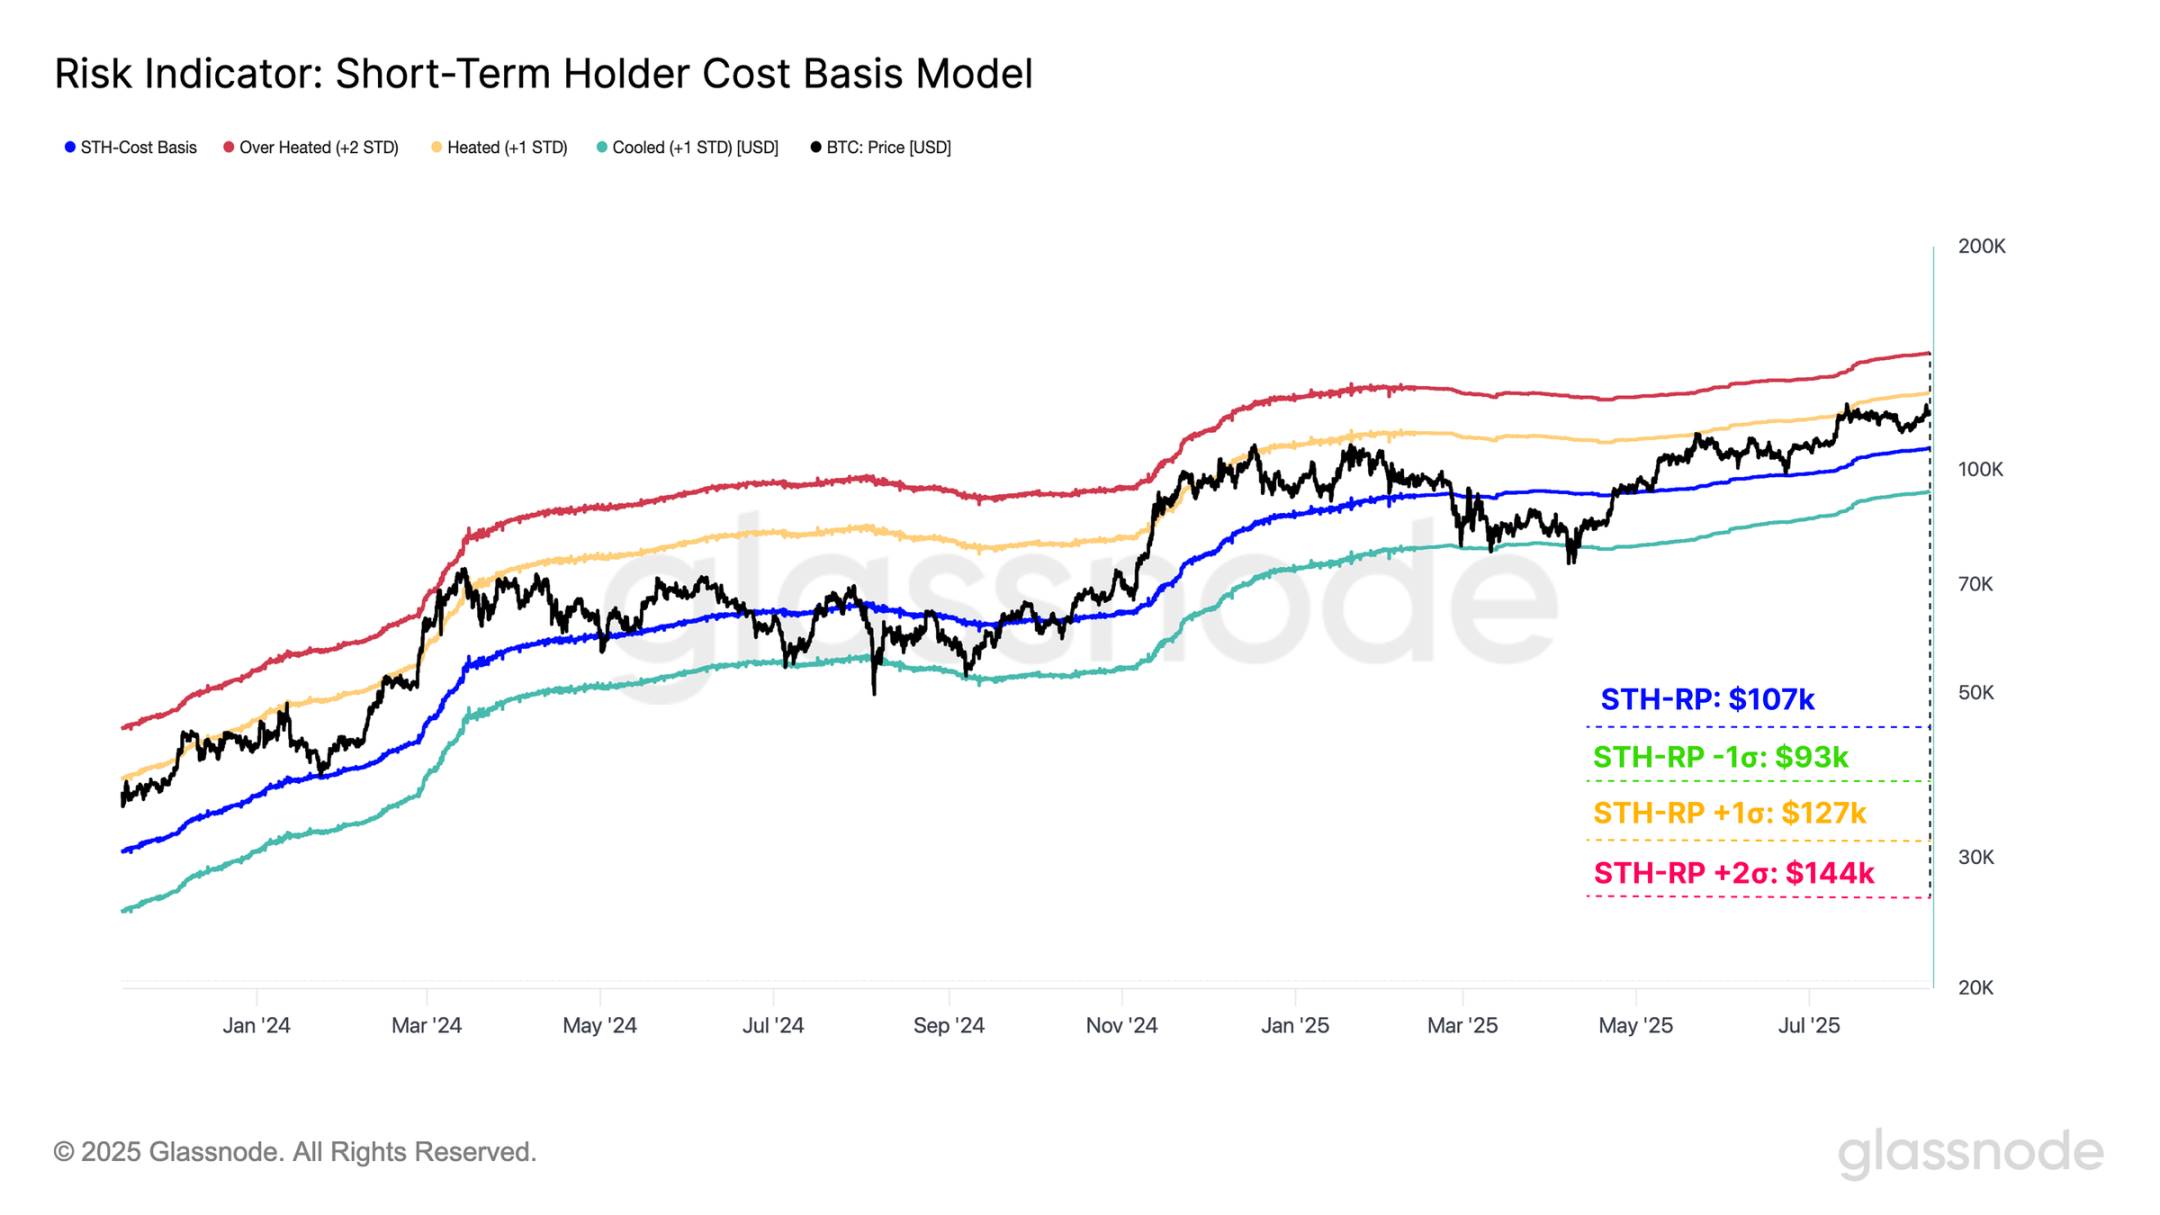
Ethereum is approaching its +1σ active realized price level of $4,700—a zone that has historically triggered strong selling pressure. Meanwhile, Bitcoin is nearing its +1σ short-term holder (STH) cost basis of $127,000, a level that has consistently acted as cyclical resistance. A decisive breakout above this level could open the path for further upside toward the +2σ level of $144,000.
Note: σ levels help traders identify historical price boundaries. +1σ represents a key short-term resistance level; a breakout may lead to testing higher standard deviation levels (e.g., +2σ). Reaching +2σ typically signals market overheating (such as excessive investor leverage), warranting caution against pullback risks. The same applies below.
Altcoin Rally
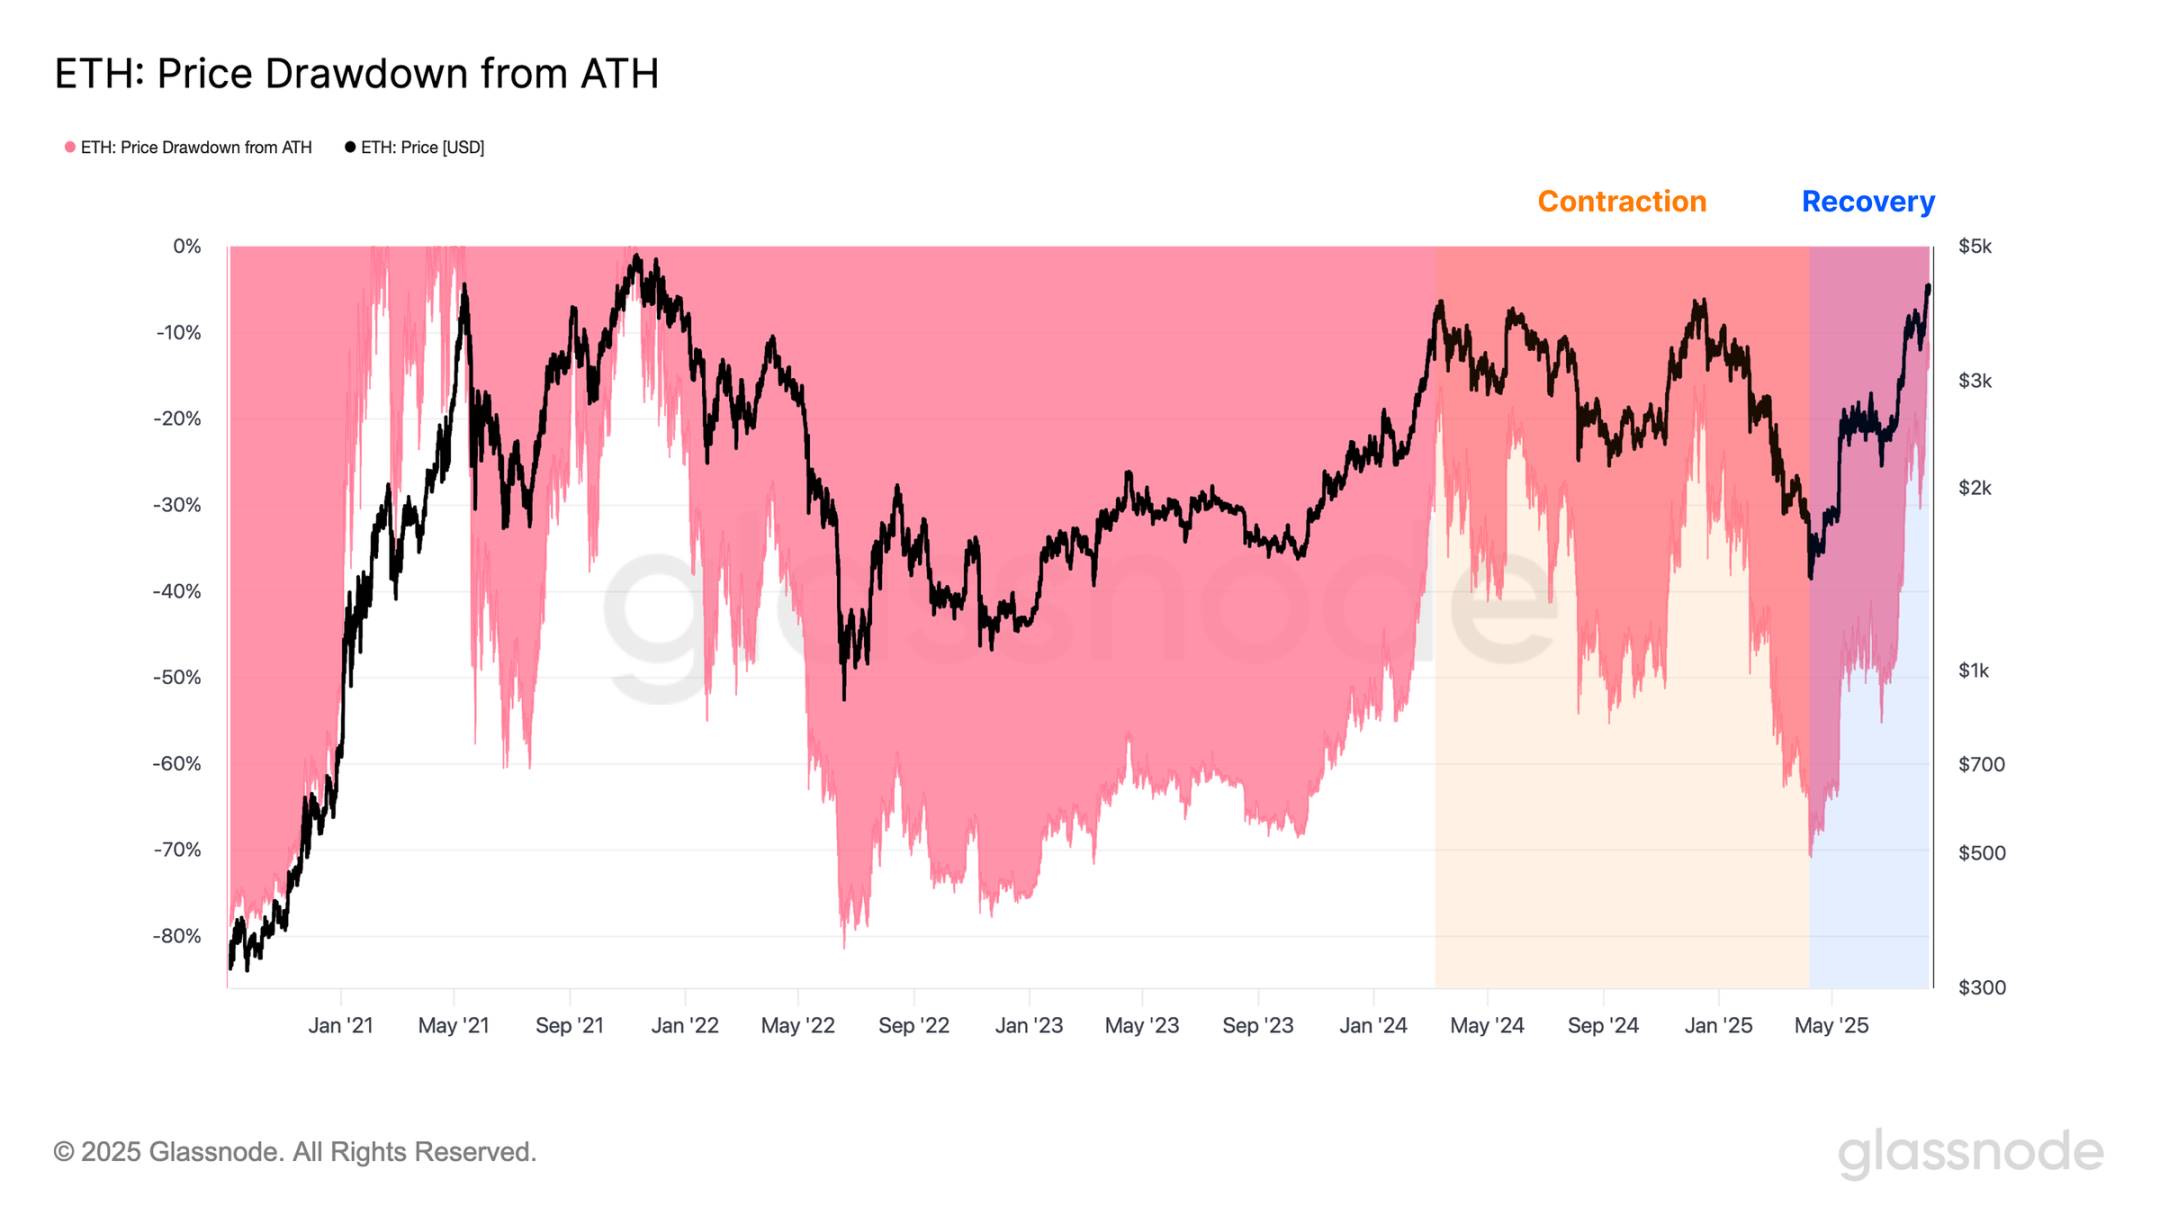
The rally in digital asset markets continues to accelerate, led by Ethereum. Its price has surged from $1,500 in April to $4,300—the highest since December 2021—just 5% below its all-time high of $4,800. Historically, Ethereum has served as a barometer for broader altcoin performance, and its recent strength is driving investors further along the risk curve into speculative positions.
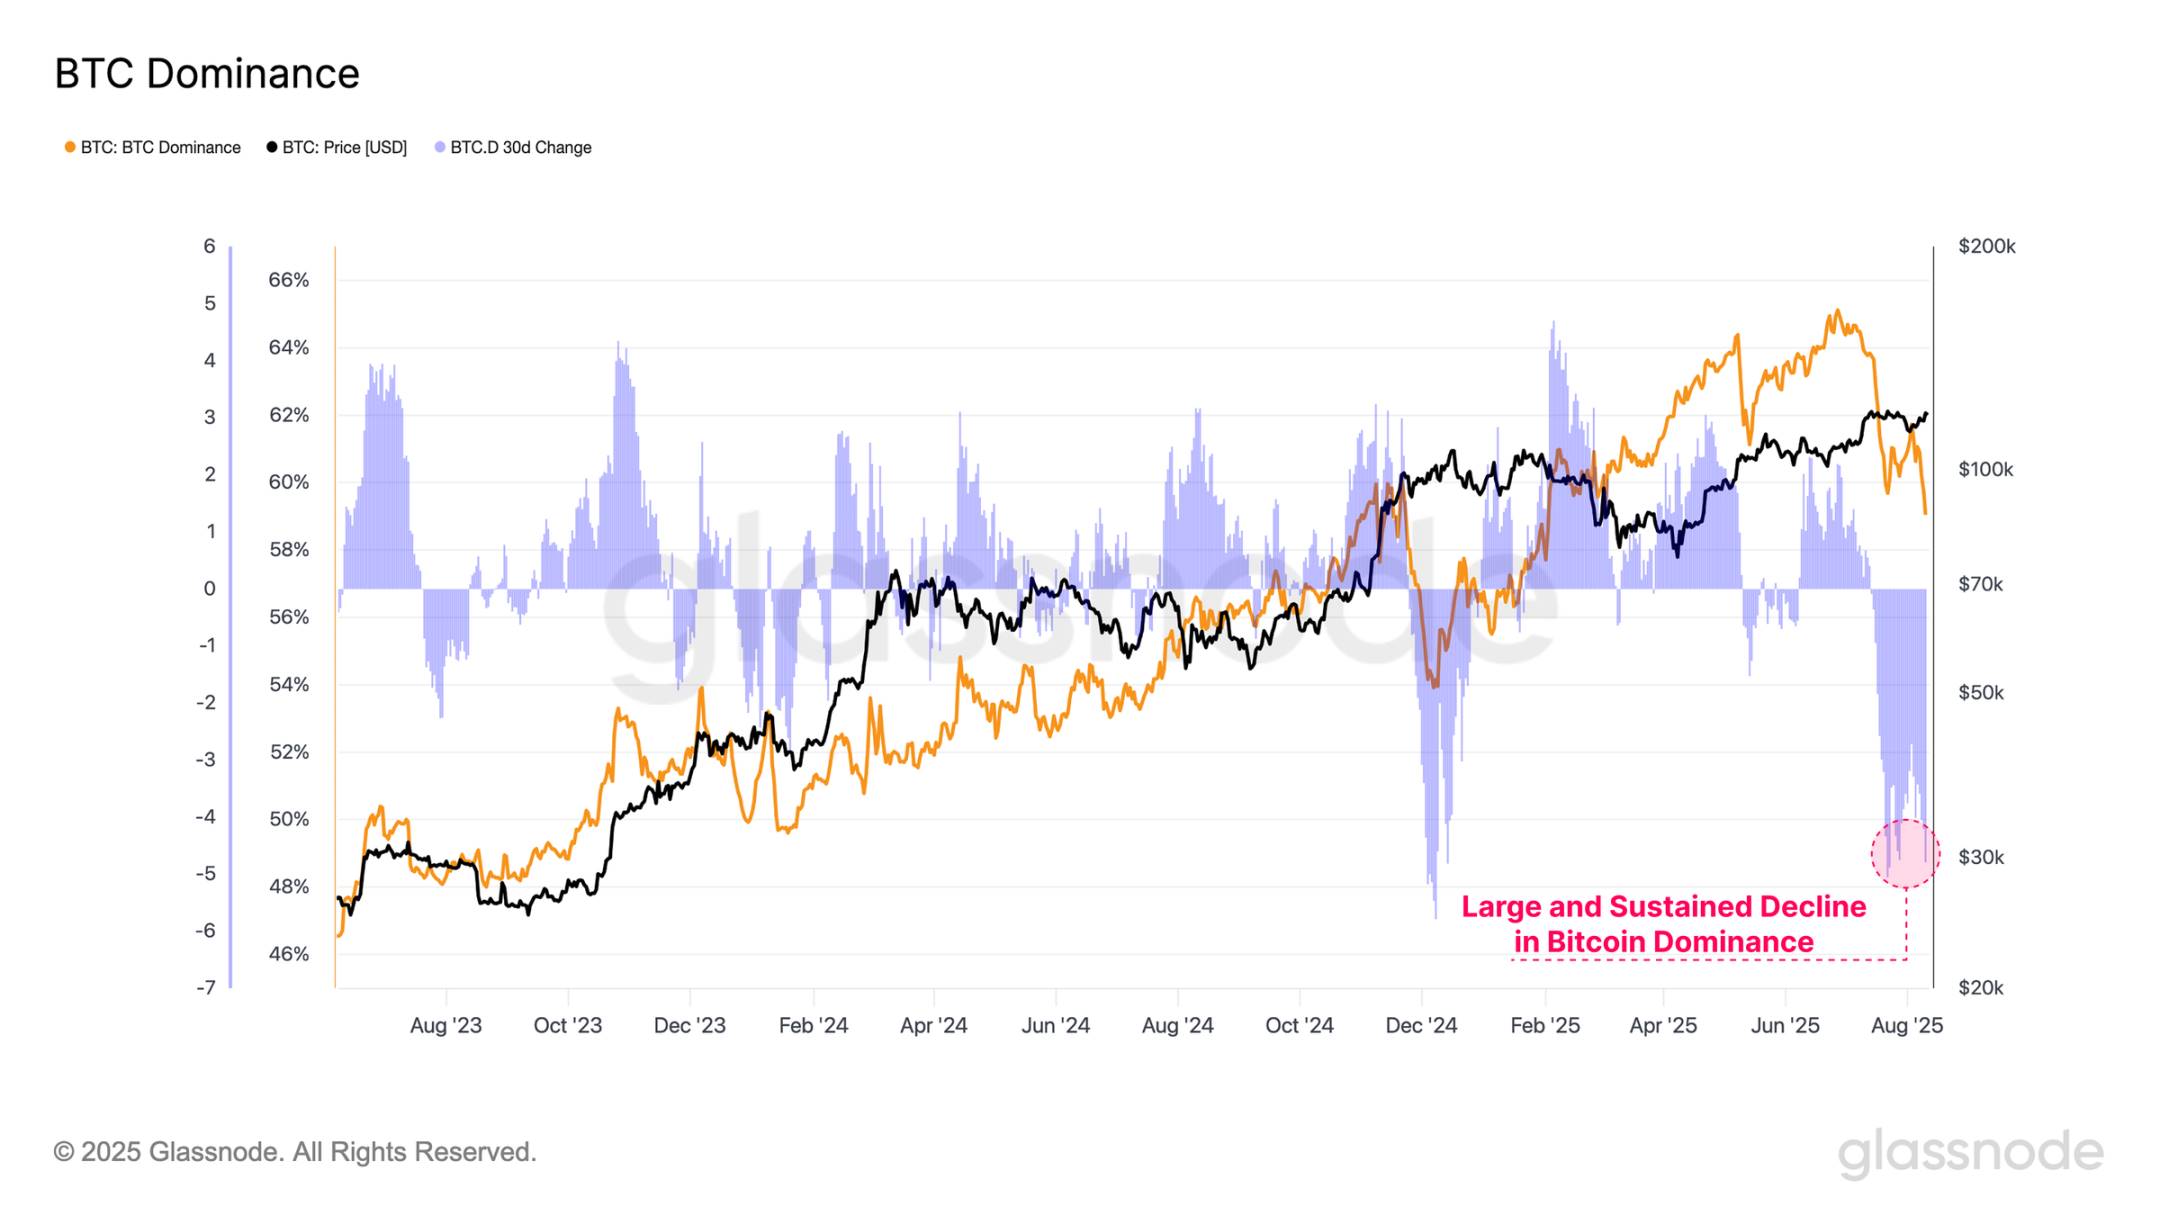
This capital rotation is also reflected in the Bitcoin dominance metric, which measures Bitcoin’s share of total digital asset market capitalization. Over the past two months, Bitcoin dominance has declined from 65% to 59%, highlighting increasing capital flows into higher-risk assets.
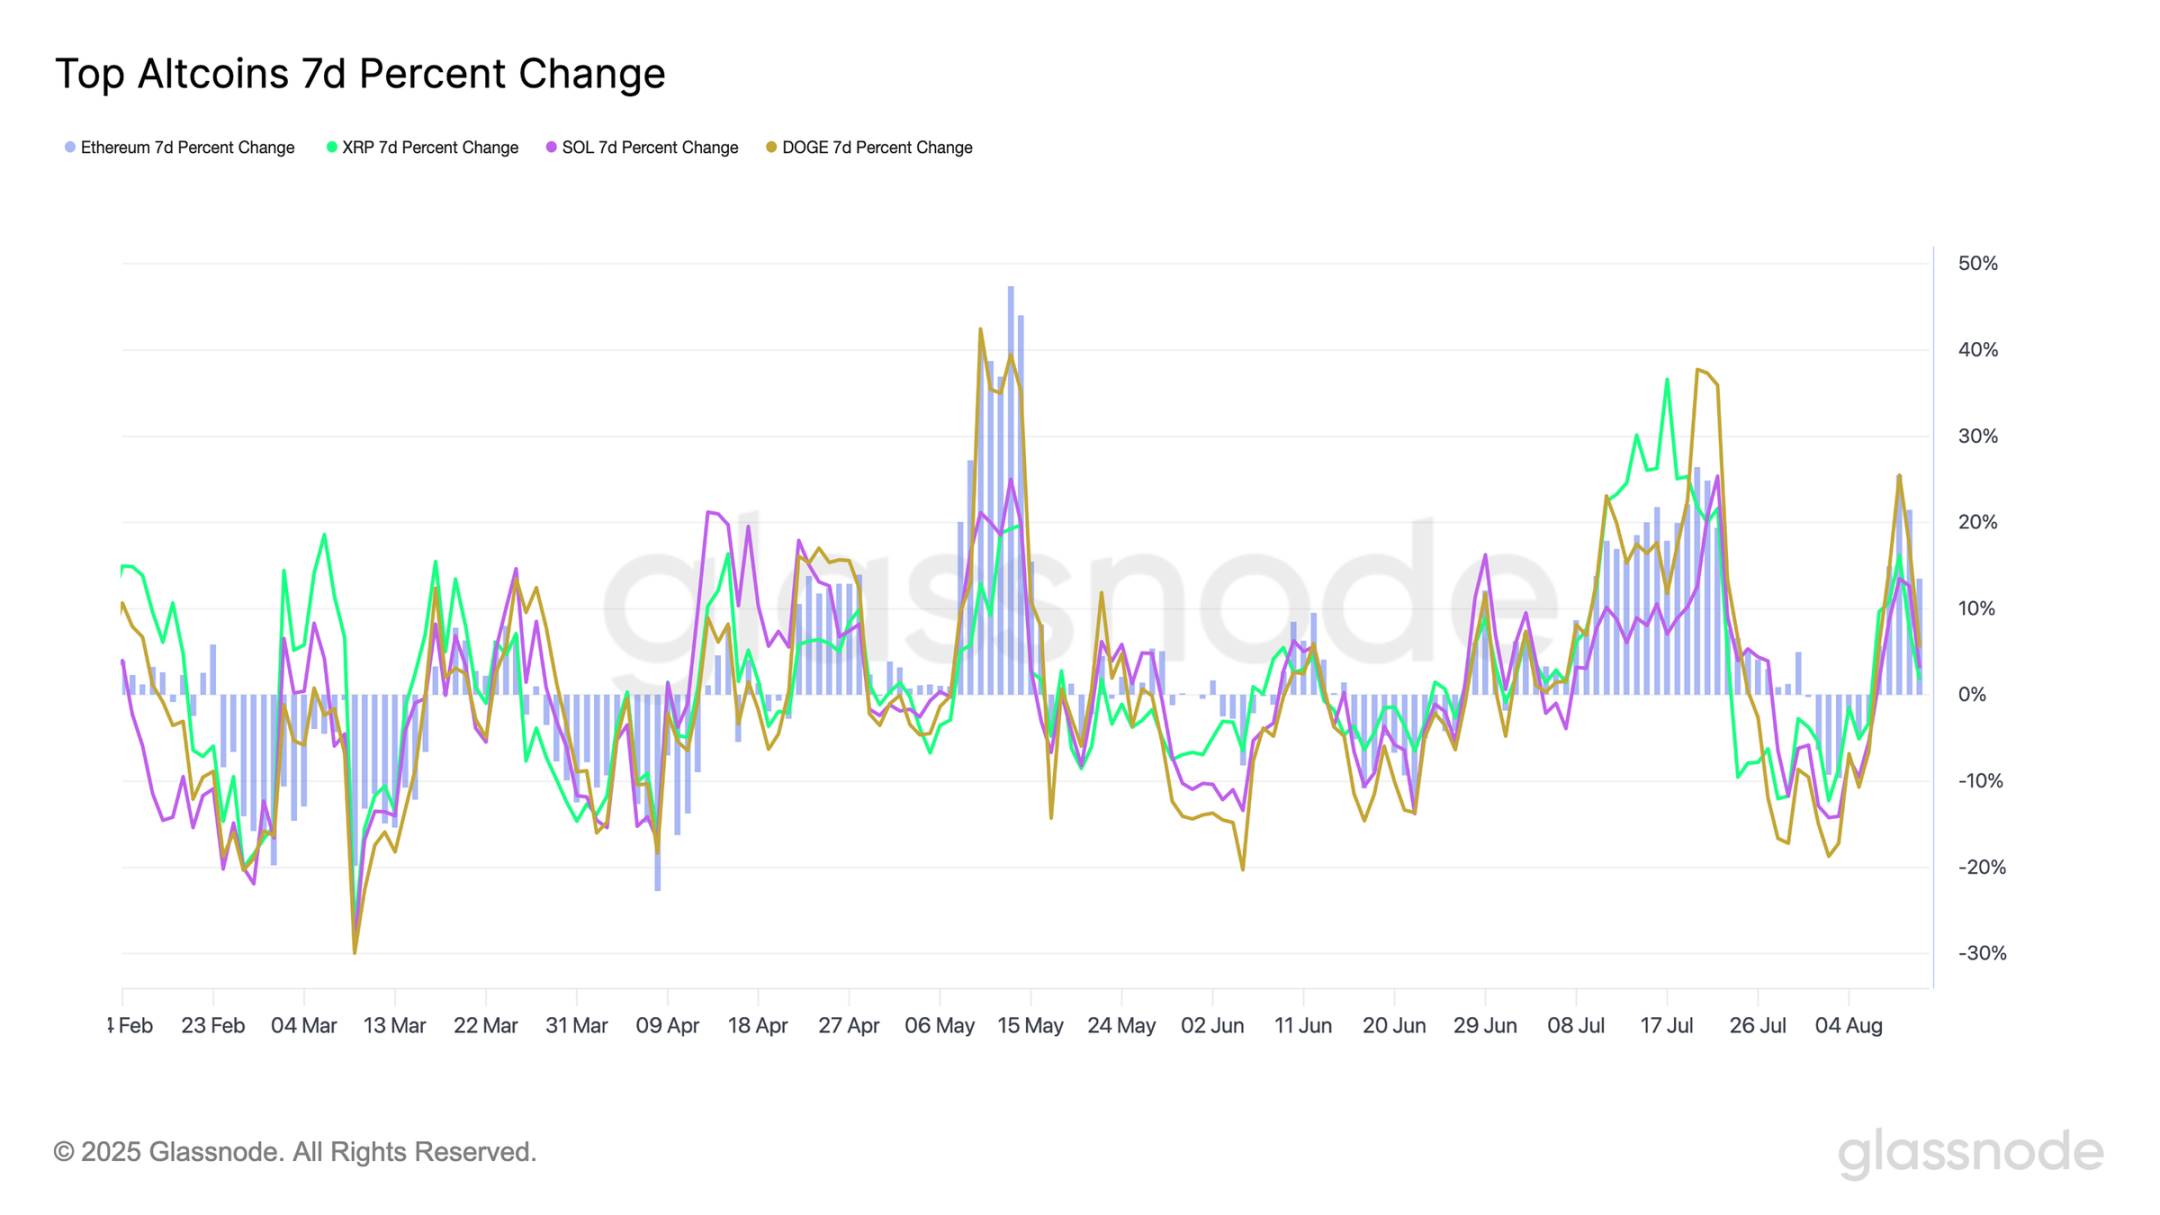
By examining the 7-day percentage changes of major altcoins (Ethereum, XRP, Solana, and Dogecoin), we observe multiple strong rallies during July and August:
-
Ethereum 7-day gain: +25.5%
-
XRP 7-day gain: +16.2%
-
Solana 7-day gain: +13.6%
-
Dogecoin 7-day gain: +25.5%
These gains indicate a broad-based altcoin rally fueled by intensifying investor speculation.
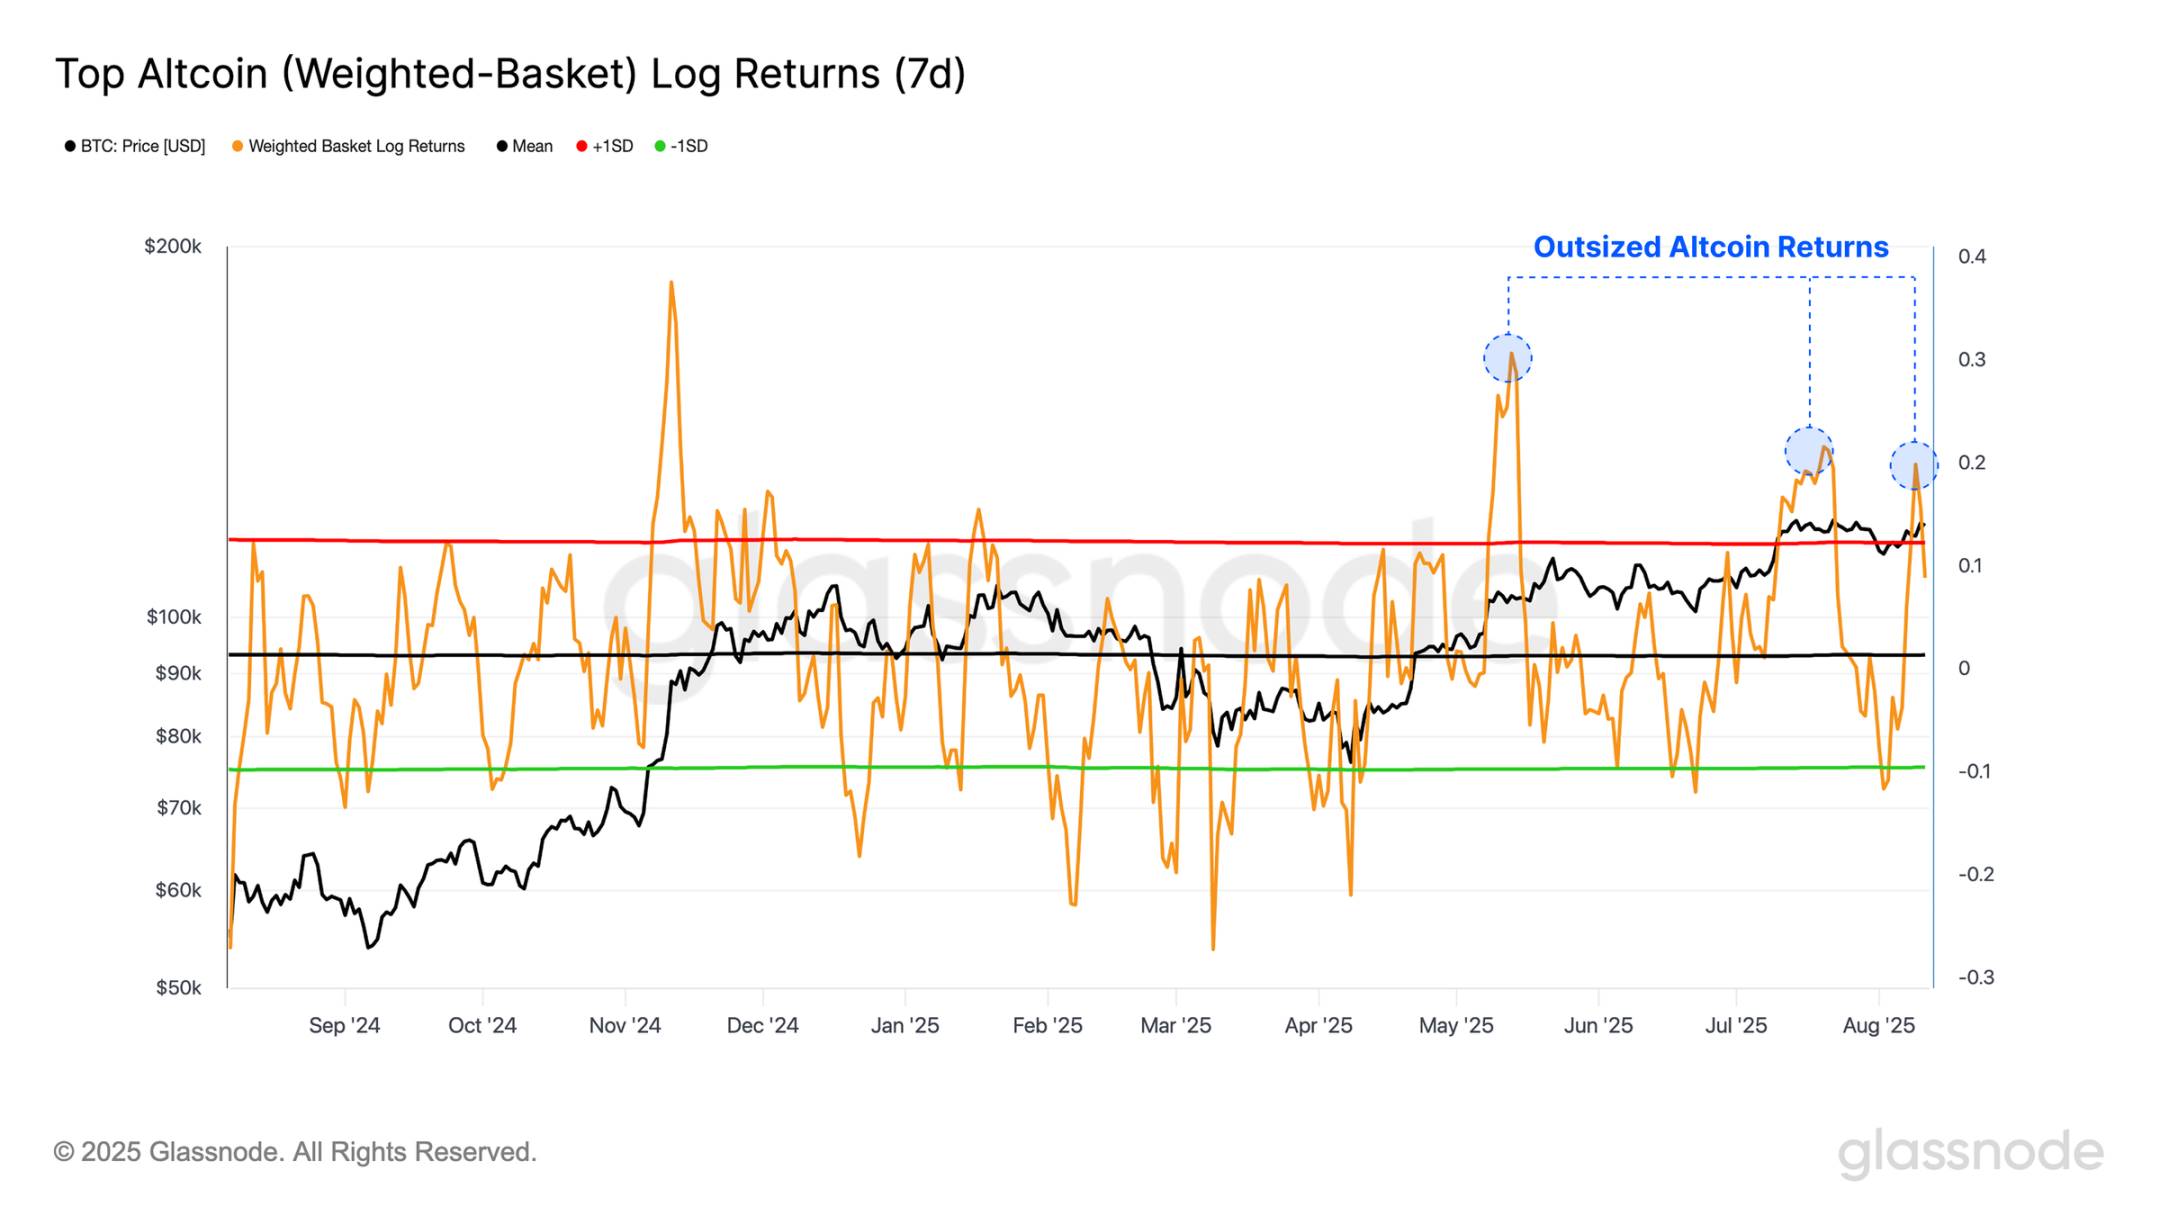
Another way to assess major altcoin performance is by constructing a market-cap-weighted altcoin basket and evaluating its 7-day logarithmic returns, naturally neutralizing scale differences between assets. Applying ±1σ bands allows us to identify statistically significant periods of outperformance or underperformance. Over the past four months, this method reveals three sustained outperformance phases, underscoring excess returns in the altcoin space.
Significant price movements in major altcoins have driven their total open interest to a record high of $47 billion. This suggests rising leverage in the market, increasing vulnerability to sharp price swings. High leverage can amplify both upward and downward moves, creating a more reflexive and fragile market environment.
Inflection Point
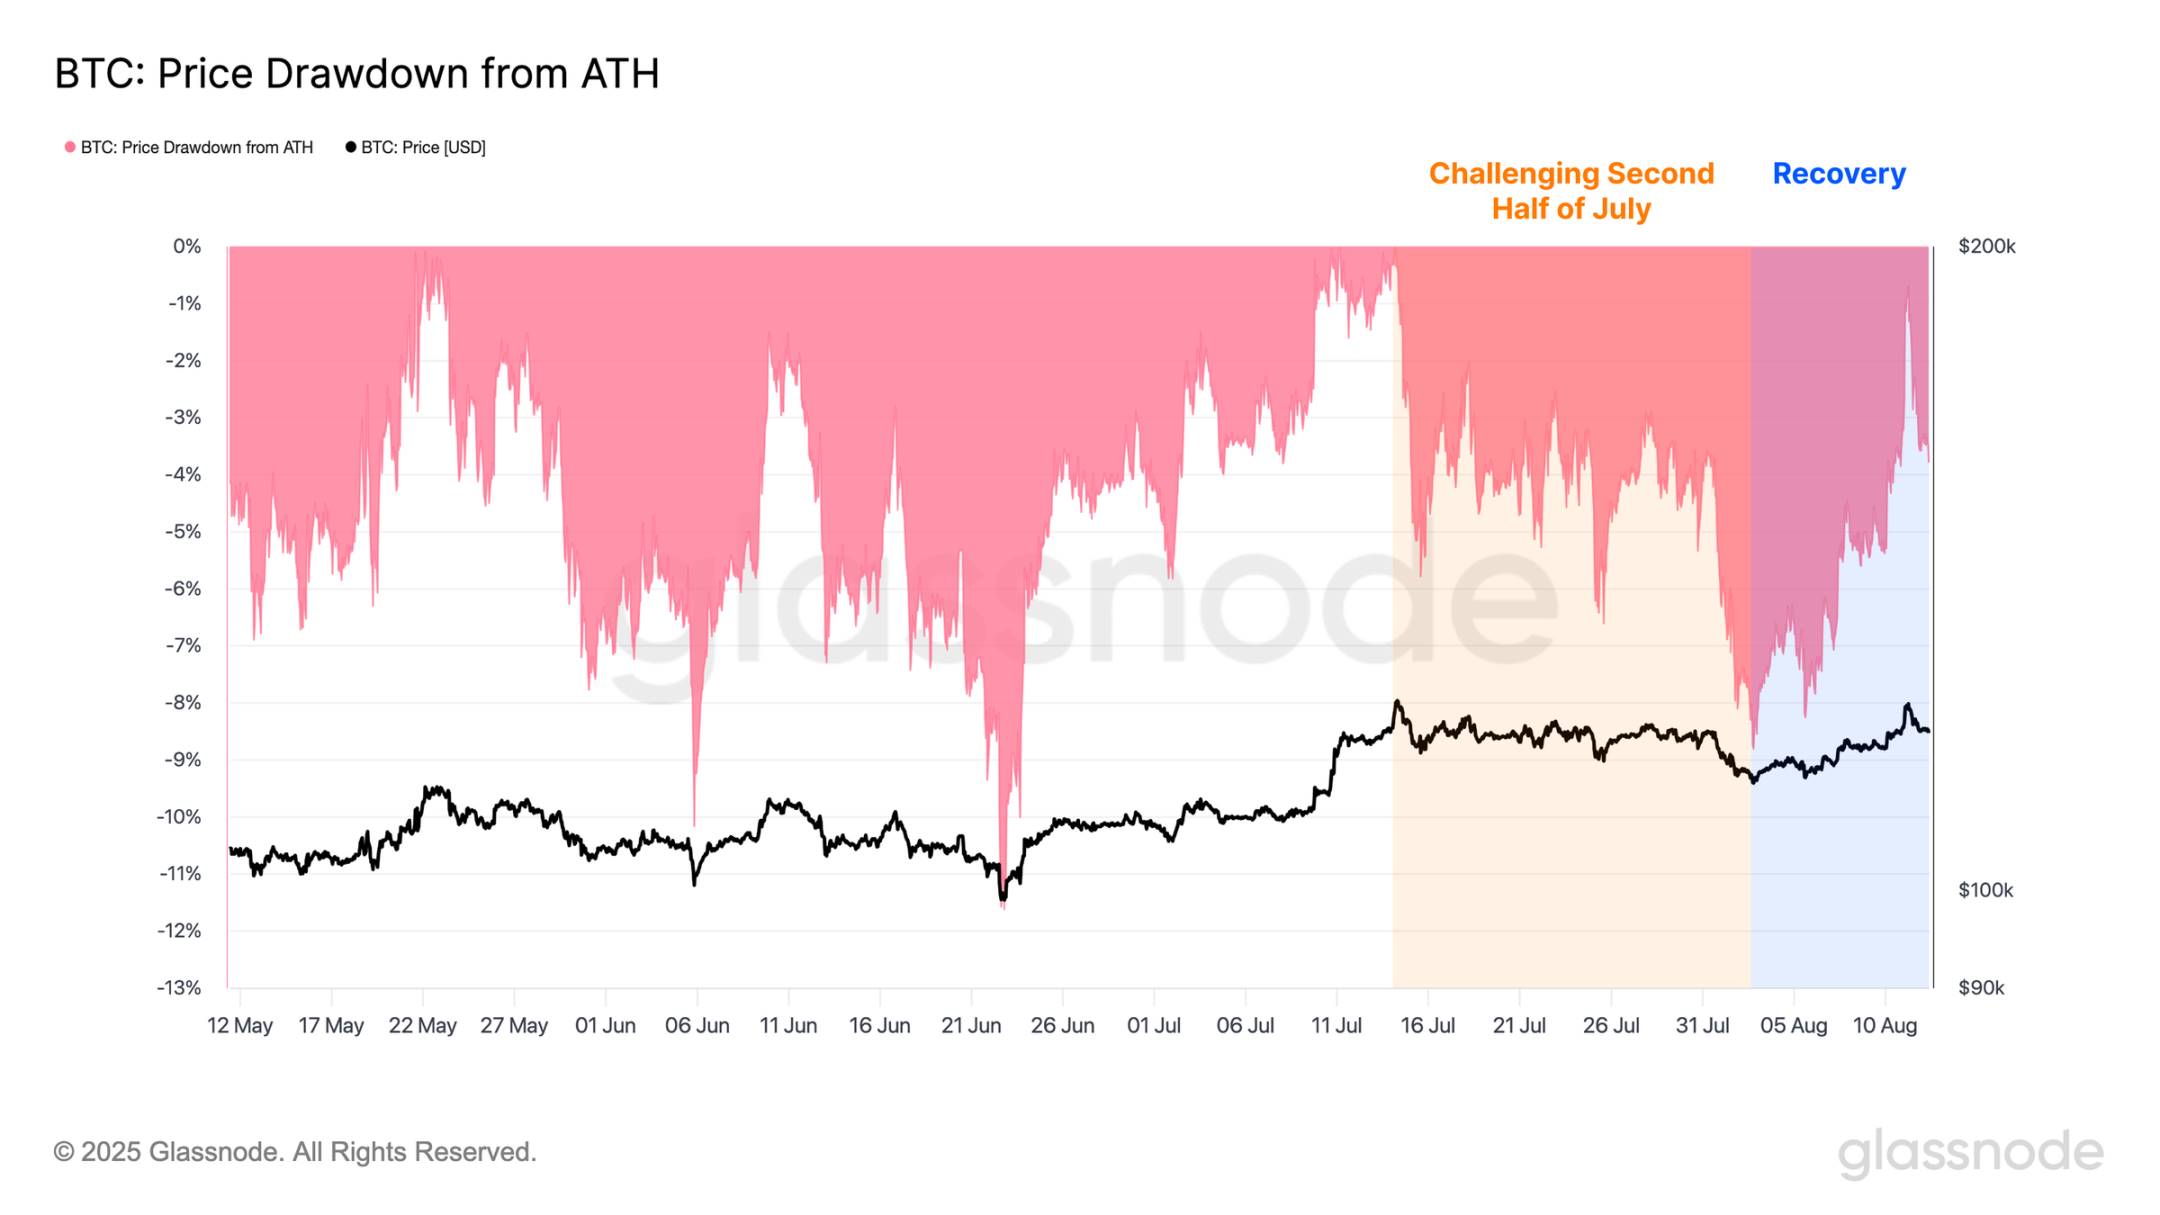
In contrast, Bitcoin has outperformed most altcoins throughout the cycle but faced challenges in the second half of July, dropping to $112,000—a 9% decline—entering a region of low liquidity. Since then, Bitcoin has rebounded strongly, now trading just 1% below its all-time high, suggesting the market is attempting a new phase of price discovery.
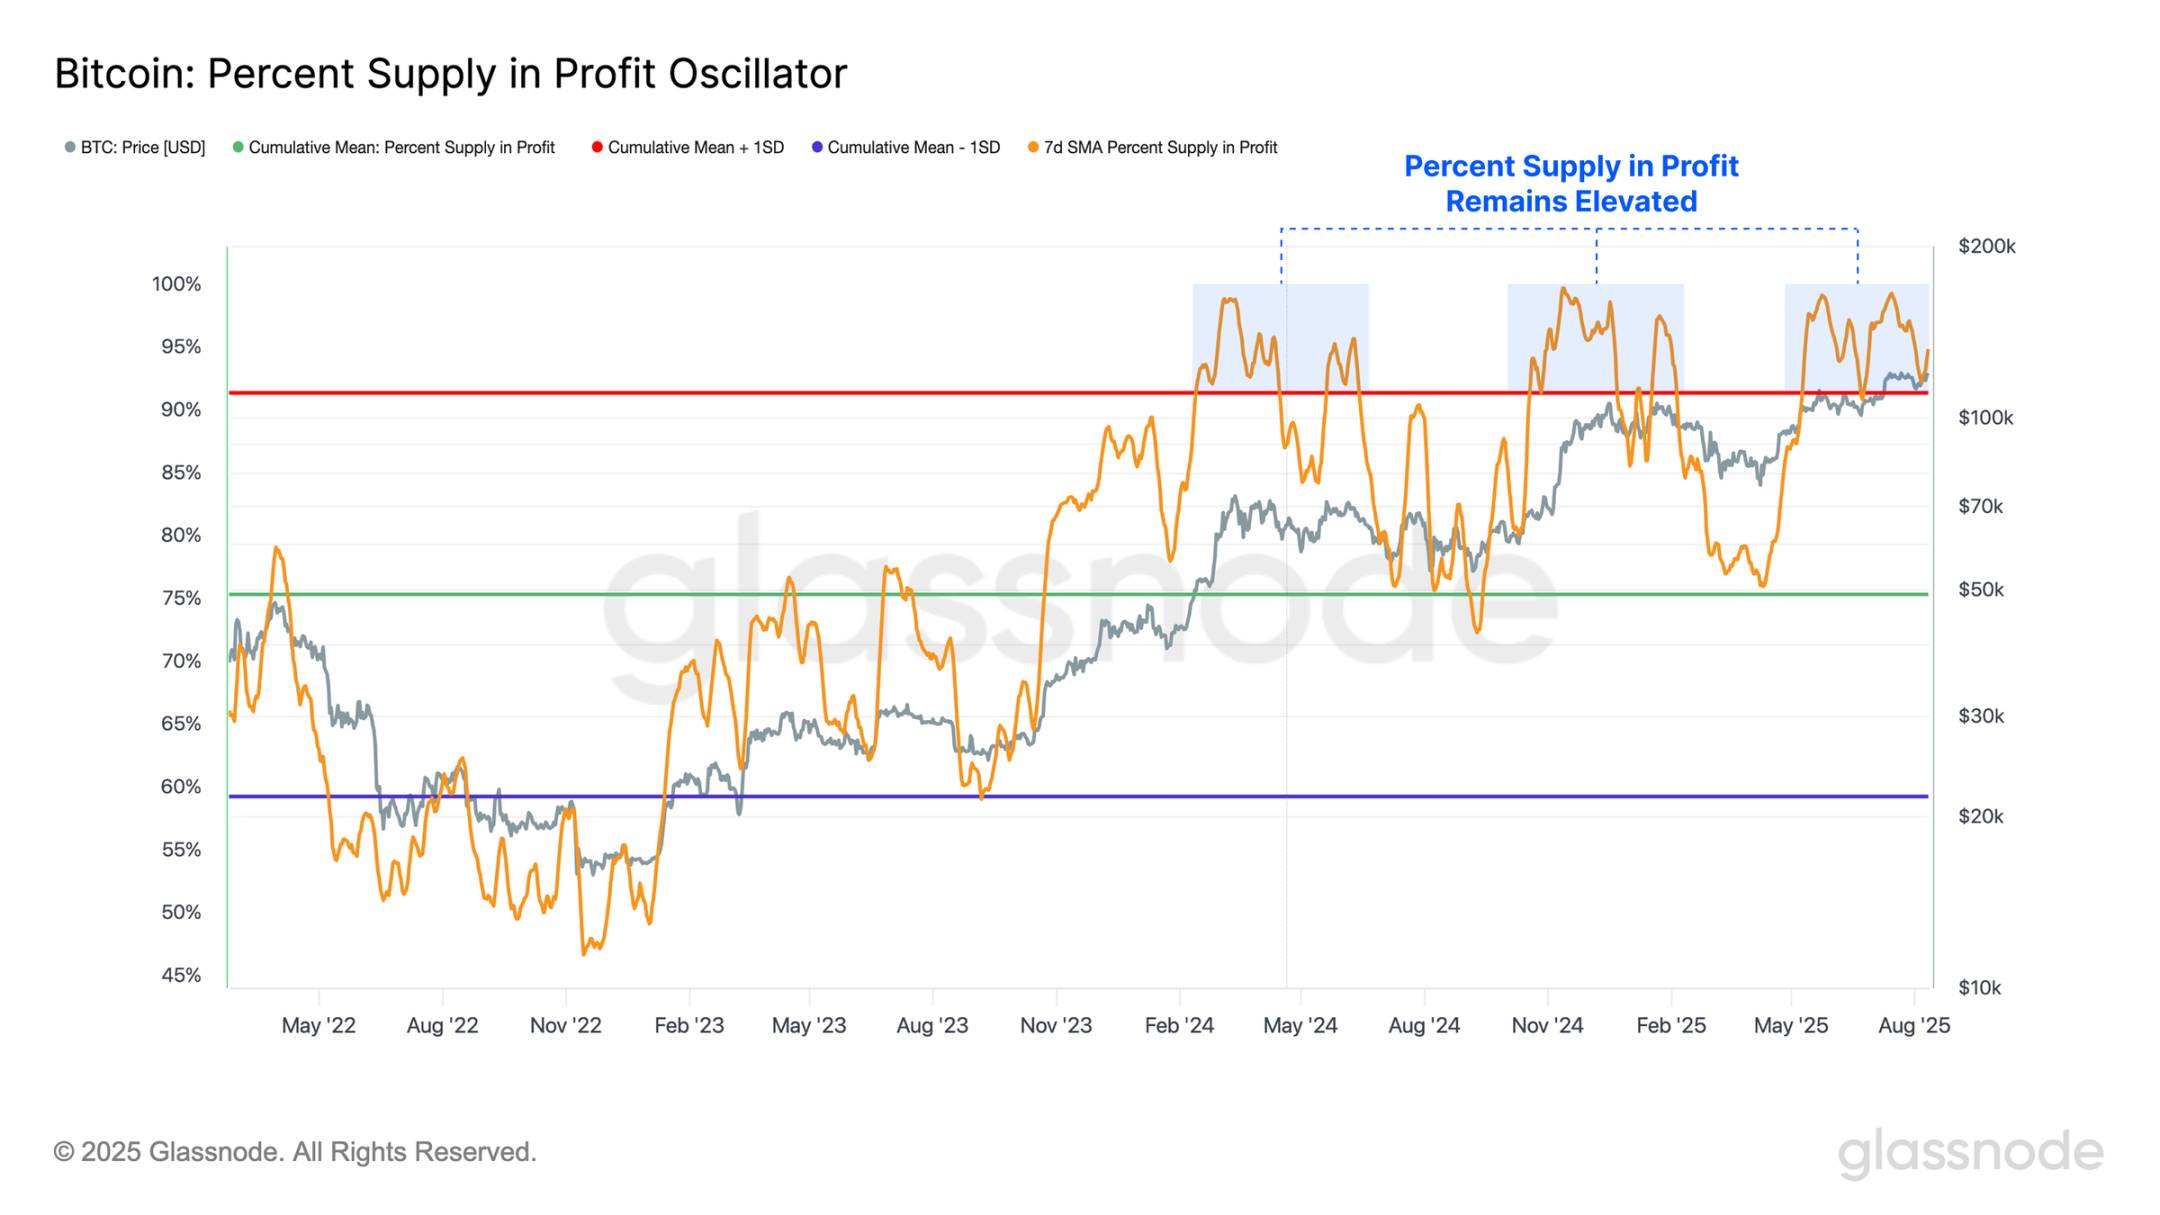
The recent upward momentum is supported by strong on-chain fundamentals. During the pullback, the proportion of circulating supply in profit remained resilient, finding support at its +1σ level. This indicates that the overwhelming majority of investors (95%) still hold unrealized profits.
During the recent market dip, the Spent Output Profit Ratio (SOPR) for short-term holders returned to the equilibrium level of 1.0, briefly and slightly dipping below it. This pattern suggests new investors actively defended their cost basis, resulting in relatively limited realized losses despite deteriorating market conditions.
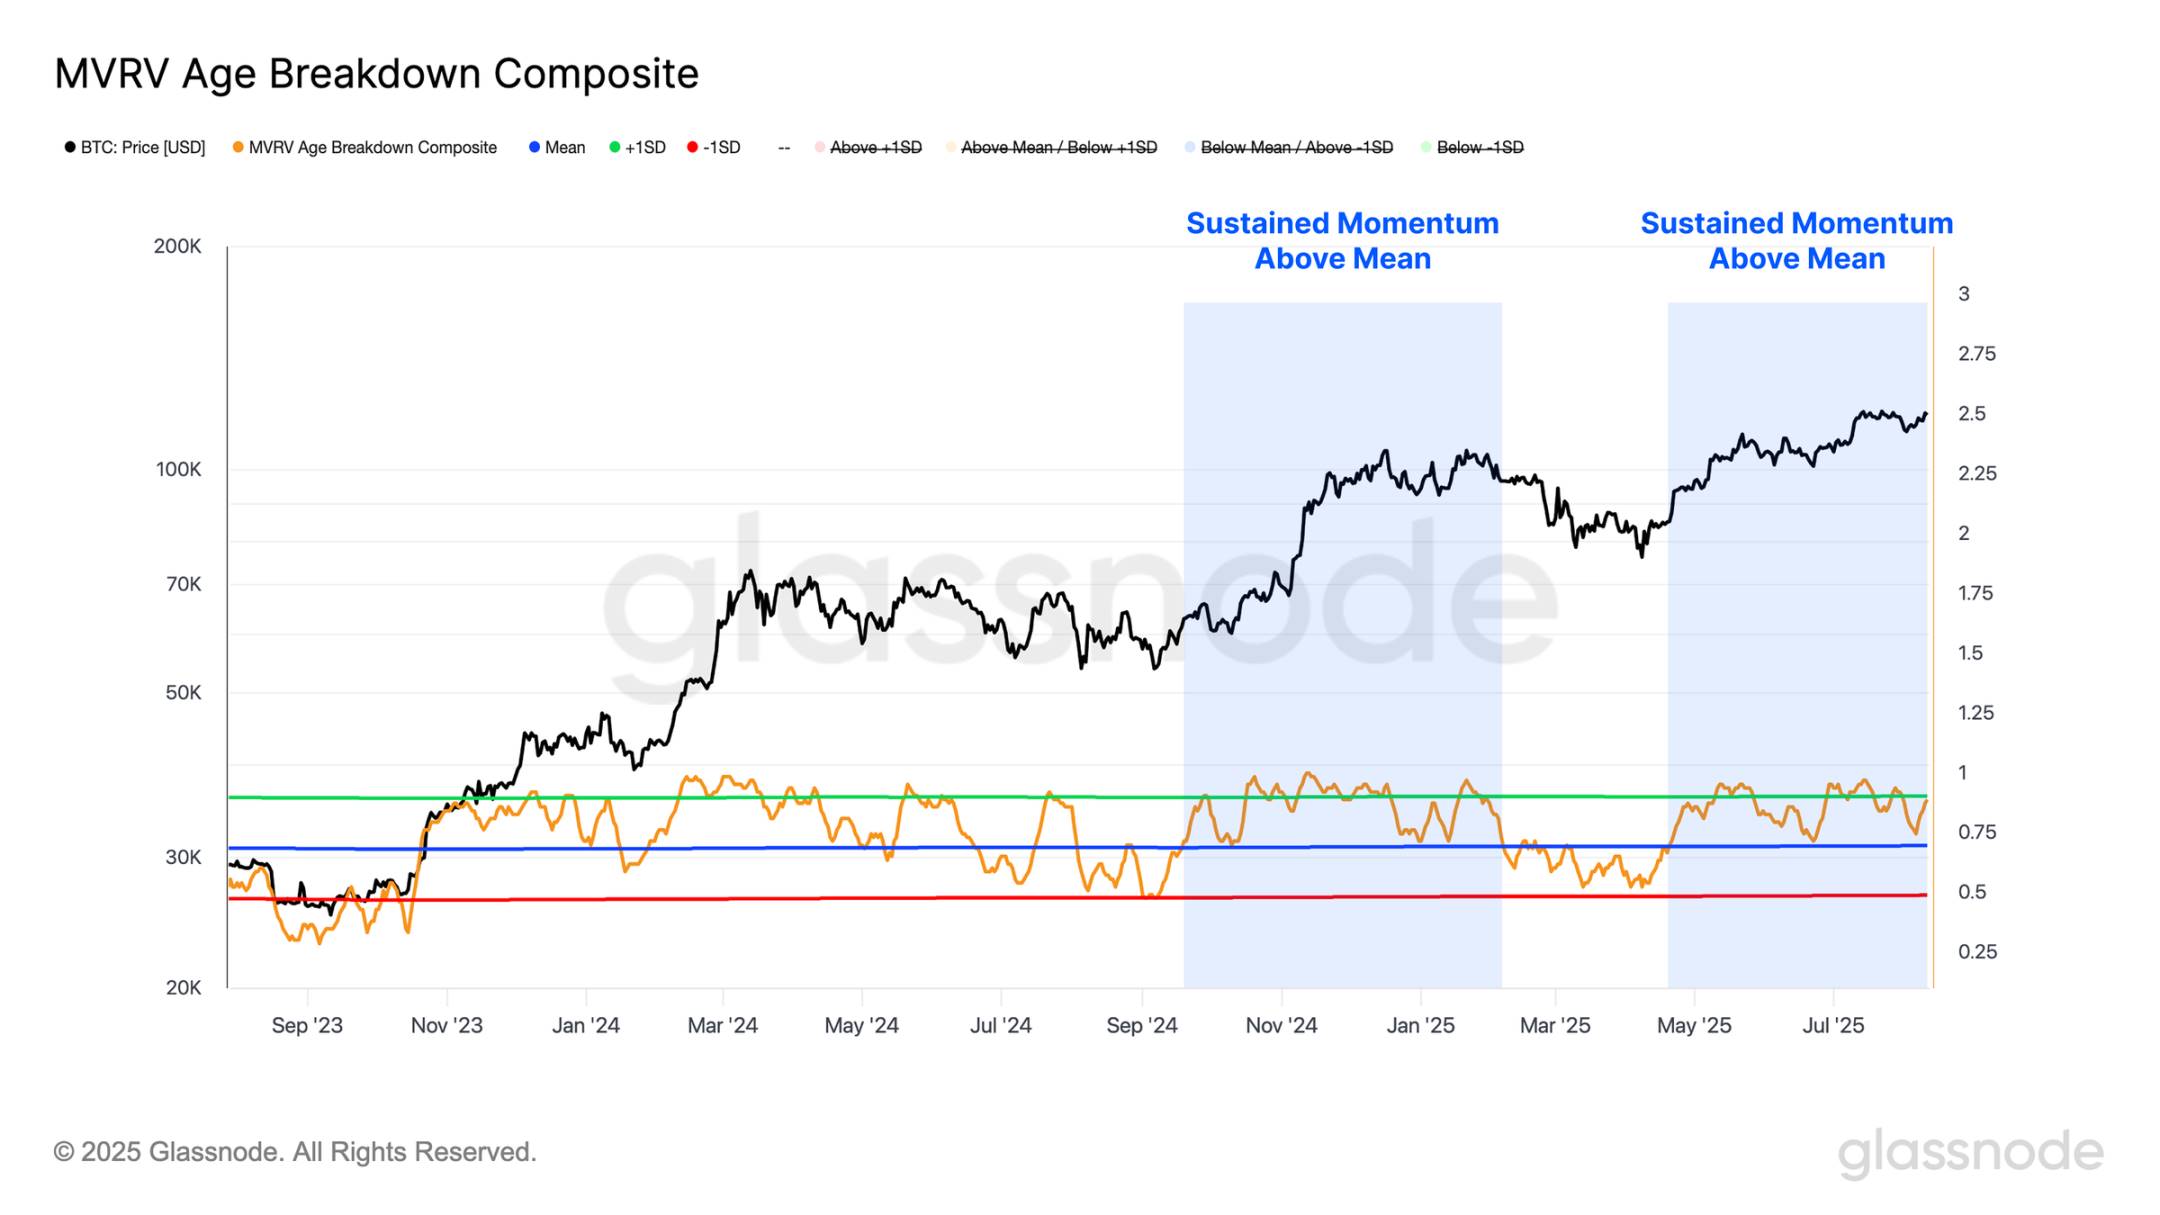
Additionally, we can use an equal-weighted composite to measure the average proportion of tokens held by investors of different ages that are in profit. This provides an intuitive market momentum indicator, tracking when an increasing number of investors shift from unrealized profit to unrealized loss.
During the recent correction, this oscillator remained above its mean, finding strong support at this level, indicating most investors stayed profitable during the downturn. Combined with marginal losses reflected in the short-term holder SOPR, this suggests minimal selling pressure from market participants. Maintaining this threshold signals improved market health and provides a constructive backdrop for sustained upward momentum.
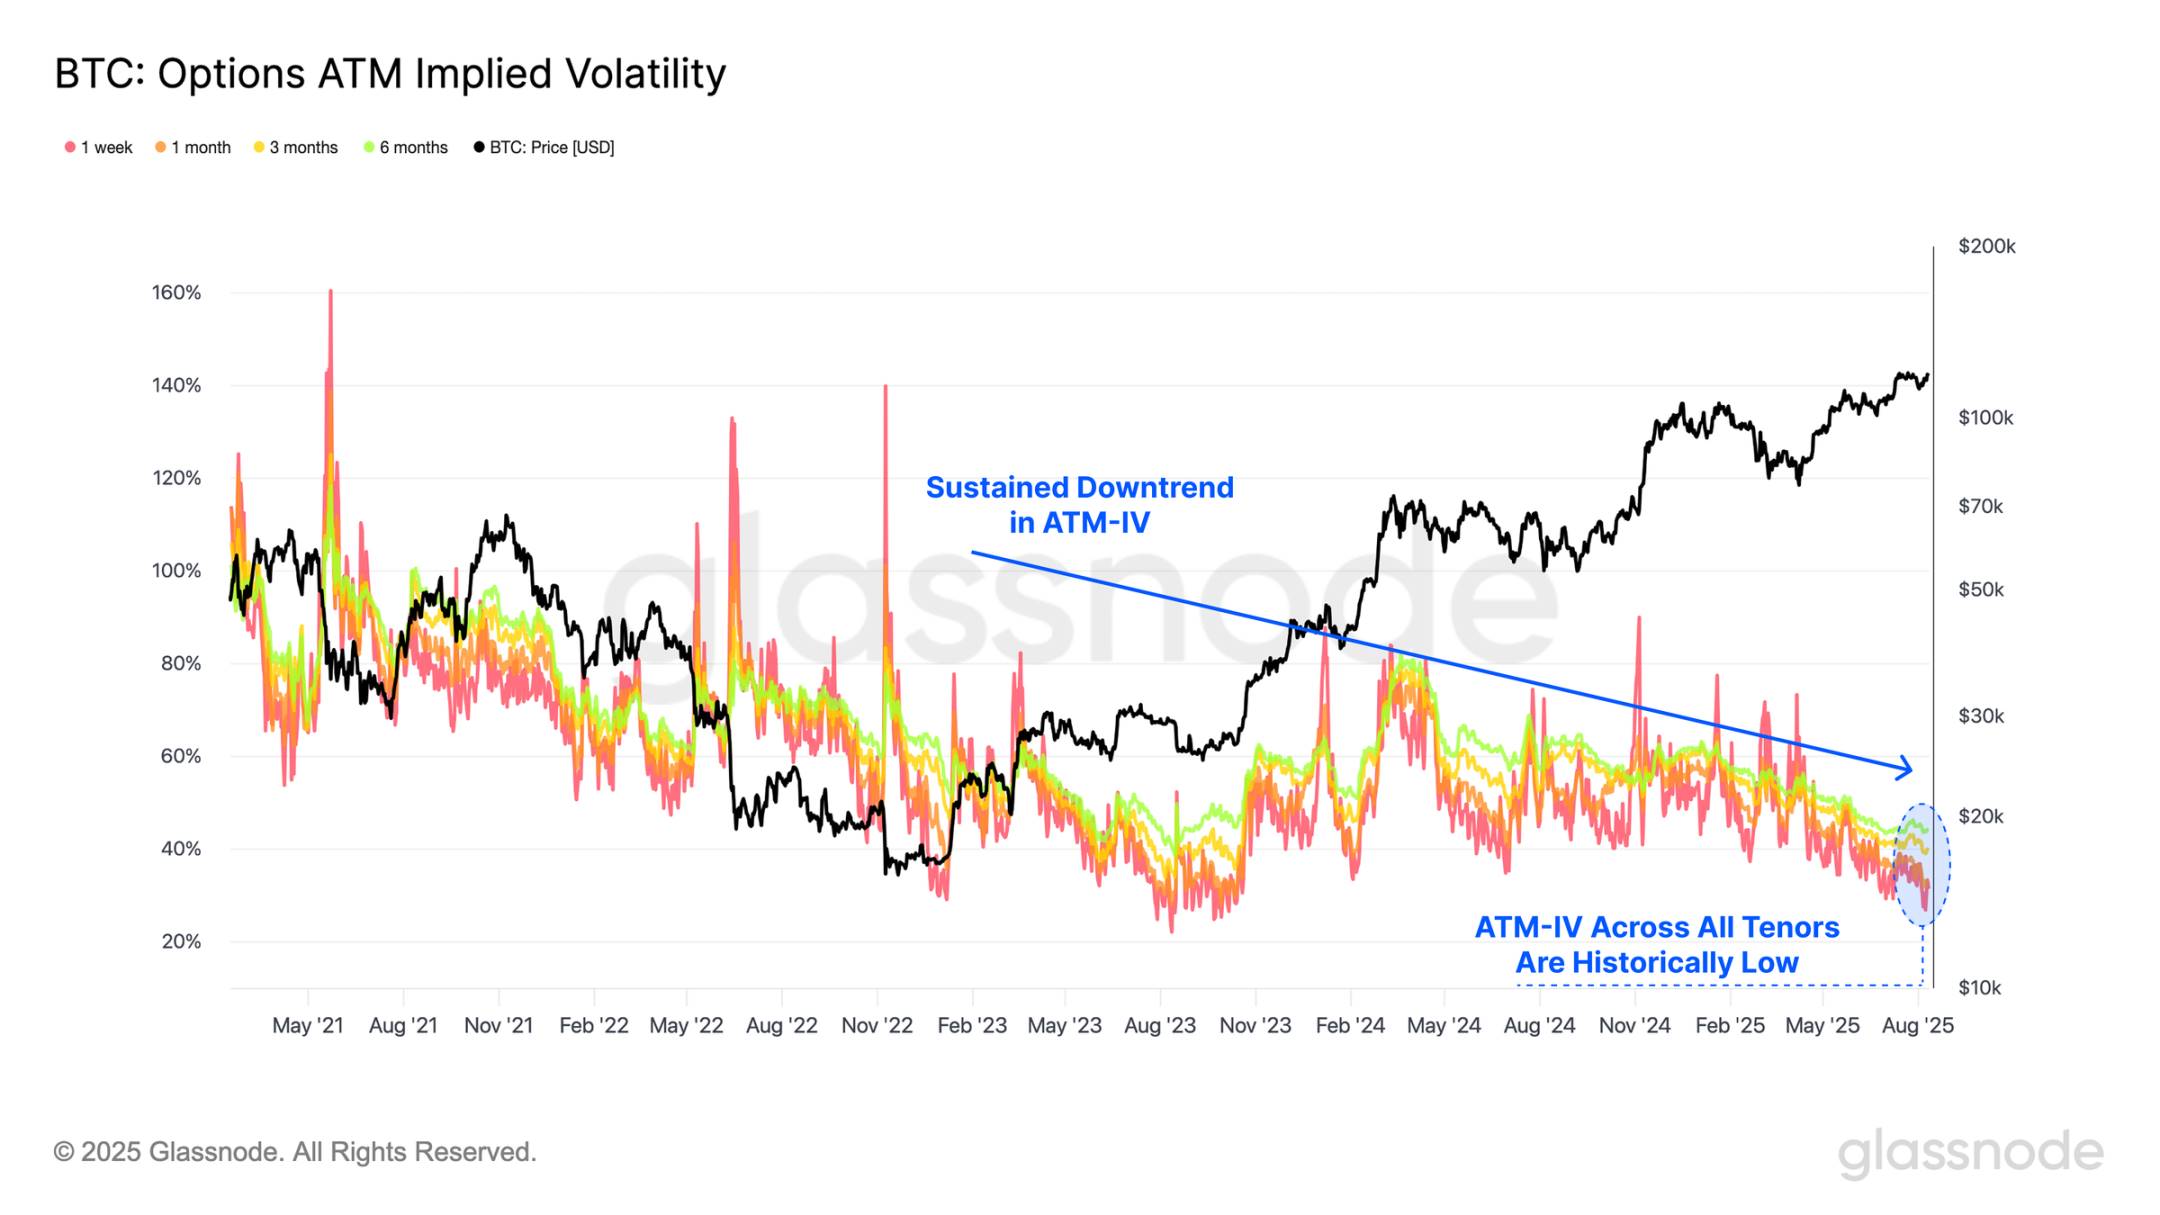
Implied Volatility Continues to Contract
Moving to options markets, at-the-money implied volatility (ATM IV) remains in a persistent downtrend, indicating traders do not yet expect a shift toward high volatility regimes. Historically, such subdued volatility expectations often precede sharp market moves, making this a potential contrarian indicator.
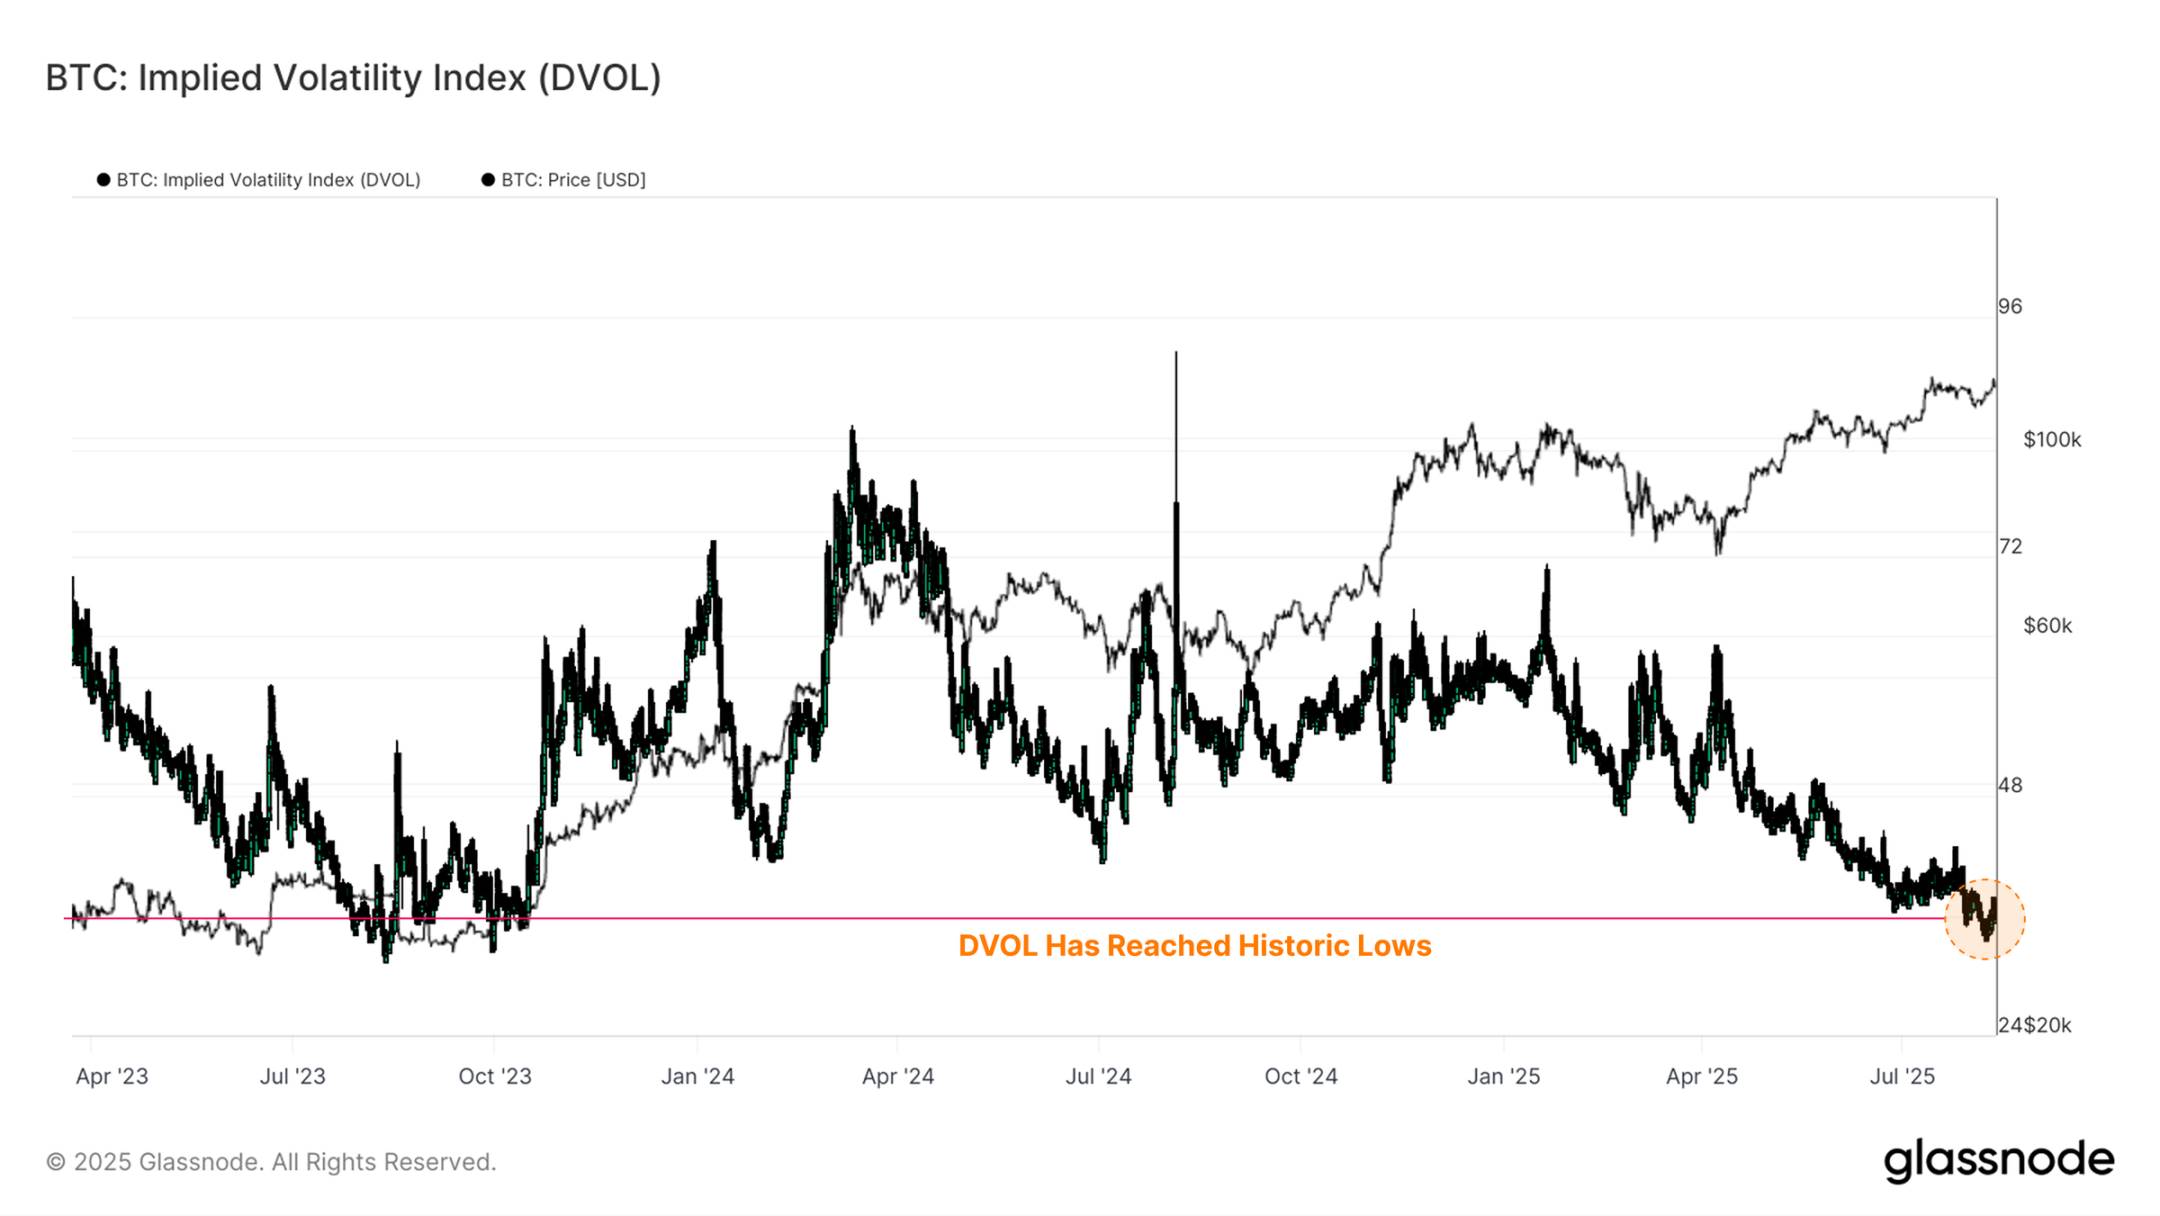
Moreover, we can further validate these observations using Deribit’s DVOL index. This 30-day implied volatility metric aggregates data across all strike prices, not just at-the-money options. Similar to the VIX in equity markets, it offers a broad view of market sentiment and expected price volatility, helping traders assess risk and identify periods of heightened speculation or uncertainty.
Current DVOL readings sit at historic lows, with only 2.6% of trading days recording lower values. Such levels typically reflect market complacency and insufficient hedging demand against large moves. While this condition may persist, the market becomes vulnerable to sudden volatility spikes if a catalyst emerges, as seen in past cycles during rapid repricing of risk and disorderly price action.
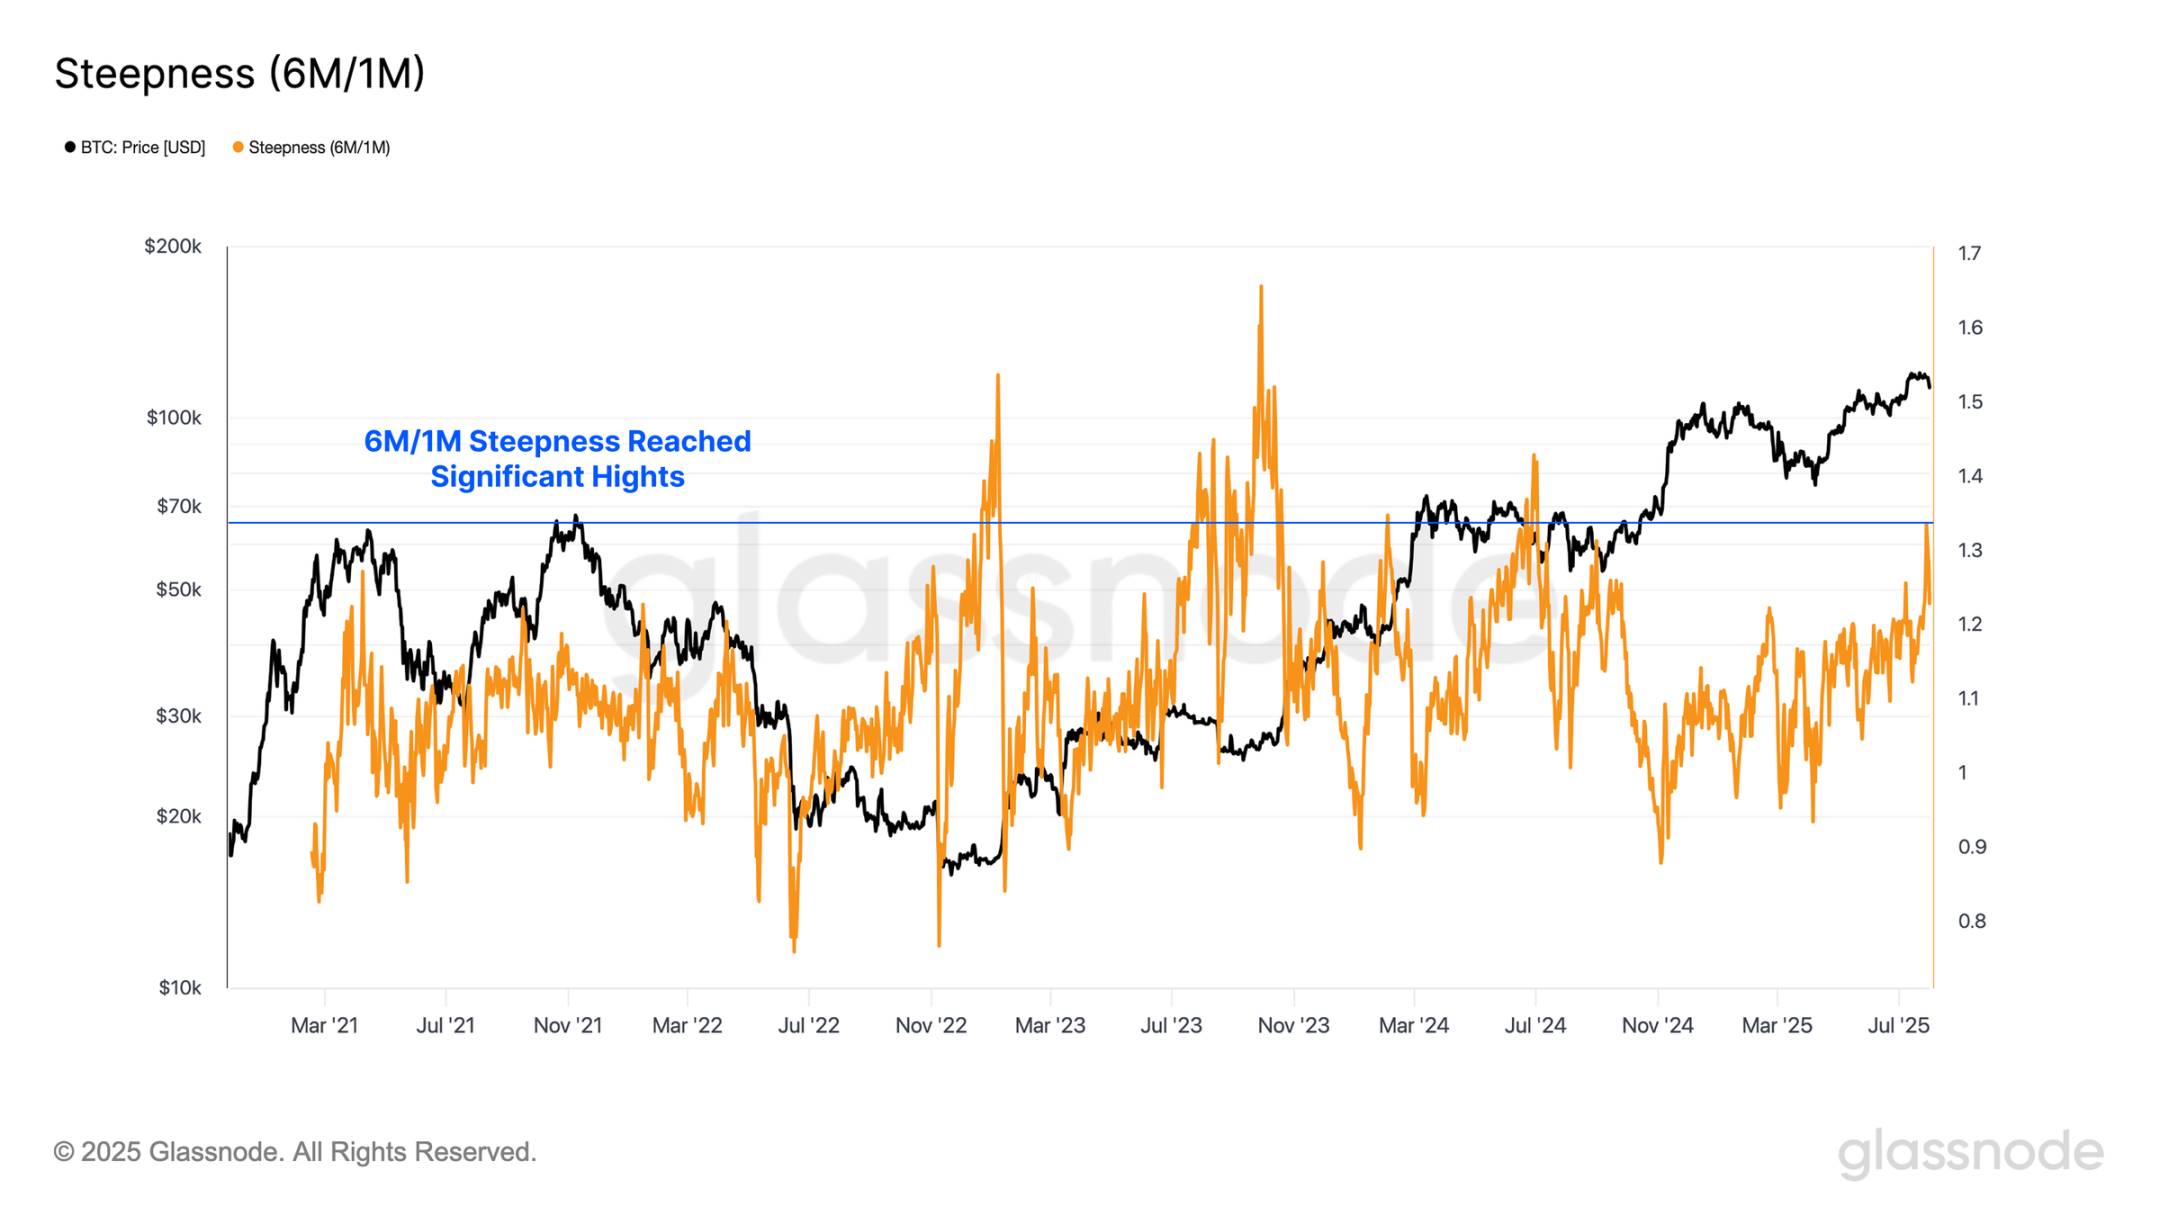
Additionally, we can track the 6-month / 1-month implied volatility ratio to assess how volatility expectations evolve over time. Shifts in this ratio reveal whether traders perceive risks as concentrated in the near term or further ahead, helping identify shifts in sentiment and expected timing of market stress or exuberance.
Currently, the 6-month / 1-month IV ratio is elevated, with only 3.2% of trading days recording higher readings. This suggests options traders see long-term uncertainty significantly outweighing short-term risk, signaling expectations for sharply higher volatility over the next two quarters.
Navigating the Market
To assess potential upside targets for Ethereum’s current rally, a useful reference is its +1 standard deviation level above the active realized price—a zone where selling pressure typically begins to build. Currently, this threshold stands at $4,700, potentially representing an overheated area under present market conditions.
This level holds historical significance, having acted as strong resistance during the March 2024 rally and repeatedly serving as a barrier during the 2020–2021 bull run. In the past, Ethereum breaking through this zone was often accompanied by euphoric investor sentiment and fragile market structure.
Given these dynamics, the $4,700 price point is a critical resistance level requiring close attention. A decisive breakout could mark entry into a more speculative phase, but if sentiment reverses, it may also heighten the risk of a sharp correction.
In contrast, for Bitcoin, we can evaluate the short-term holder (STH) cost basis, representing the average entry price of newer market participants. Historically, this key price level marks the boundary between local bull and bear phases. By applying standard deviation bands, we can assess whether the market is overheating or cooling down.
From this pricing perspective, $127,000 emerges as a critical level to watch. The market’s reaction should price moves beyond this level prove crucial. Moreover, if Bitcoin decisively breaks above $127,000, the next target could shift toward $144,000—the +2σ level where major resistance converges—potentially triggering a sharp increase in selling pressure.
Summary & Conclusion
The market overall sits in a sensitive phase marked by the contradiction of high speculation and low volatility, warranting caution against short-term reversal risks. Current digital asset markets show divergence: Ethereum is rallying strongly toward its all-time high, driving broad altcoin gains, but open interest has surged to $47 billion, signaling leveraged buildup and rising market fragility; Bitcoin consolidates at elevated levels with robust on-chain metrics, yet options markets price in multi-year low implied volatility, historically a precursor to sharp volatility spikes.
Digital asset markets continue to show strength, with Ethereum surging to $4,600—the highest since December 2021—now just 5% below its all-time high, while Bitcoin’s momentum remains firmly supported by strong on-chain fundamentals.
Strong altcoin price performance has driven a surge in open interest across major altcoins, reaching a record $47 billion and increasing the likelihood of sharp price swings. In contrast, Bitcoin options markets continue to price in a low-volatility environment, with implied volatility at multi-year lows—a setup that historically precedes sudden expansions in realized volatility.
Both major assets are now approaching historically significant resistance levels: Ethereum at the +1σ level of $4,700 on its active realized price, and Bitcoin at the +1σ level of $127,000 on its short-term holder cost basis. Price action near these thresholds will be critical in determining whether the market advances toward higher cyclical targets or faces a leveraged-driven sharp pullback.
Join TechFlow official community to stay tuned
Telegram:https://t.me/TechFlowDaily
X (Twitter):https://x.com/TechFlowPost
X (Twitter) EN:https://x.com/BlockFlow_News
 @glassnode






