
On-Chain Insights: A New Paradigm for Forecasting Coinbase Revenue, Ending the Era of Wall Street Analytical Monopoly
TechFlow Selected TechFlow Selected
On-Chain Insights: A New Paradigm for Forecasting Coinbase Revenue, Ending the Era of Wall Street Analytical Monopoly
As blockchain data becomes increasingly refined, even non-insiders can now make institutional-grade predictions—once an advantage exclusive to Wall Street analysts.
Author: Kevin Li
Compiled by: TechFlow
Our analyst Kevin Li used publicly available blockchain data to estimate Coinbase's second-quarter revenue at $1.495 billion, down 6.2% compared to Wall Street’s estimate of $1.594 billion.
July 31 Earnings Update:
Author Estimate: $1.495 billion (-$2 million)
Wall Street Expectation: $1.594 billion (+$97 million)
Actual Result: $1.497 billion
Key Takeaways:
Real-time Revenue Forecasting Using On-Chain Data: We estimate Coinbase’s Q2 revenue at $1.495 billion, below Wall Street’s $1.594 billion, based on analysis of public blockchain data.
Trading Revenue Remains Dominant Despite Market Downturn: Trading revenue is projected at $710 million, still Coinbase’s largest income source, though both institutional and retail trading volumes declined in Q2 as Memecoin momentum cooled.
Stablecoin Growth Surge Drives Revenue: USDC supply grew 36.7% to $60 billion; stablecoin-related revenue surged to an estimated $396 million, becoming the second-largest contributor.
Layer 2 and Interest Income Show Strong Growth: Base network generated an estimated $57.82 million, including on-chain fees and assumed non-fee income; blockchain rewards (mainly ETH staking) contributed $159 million; interest and subscription revenues reached $72 million and $117 million respectively.
A core advantage of crypto/blockchain lies in its transparency, enabling real-time estimation of blockchain-linked business revenues.
In traditional finance (TradFi), analysts cannot anticipate a company’s quarterly performance unless it relates to consumer spending, where credit card panel data may help. In crypto, everything is recorded on-chain and publicly verifiable. This allows anyone to analyze blockchain data and predict company fundamentals in real time. This article explains how we use on-chain activity to forecast Coinbase’s revenue.
Coinbase’s revenue breaks down into several key components:
-
Trading Revenue
-
Base Network Revenue
-
Blockchain Rewards Revenue
-
Stablecoin Revenue
-
Other & Subscription Revenue
-
Interest Revenue
Trading Revenue
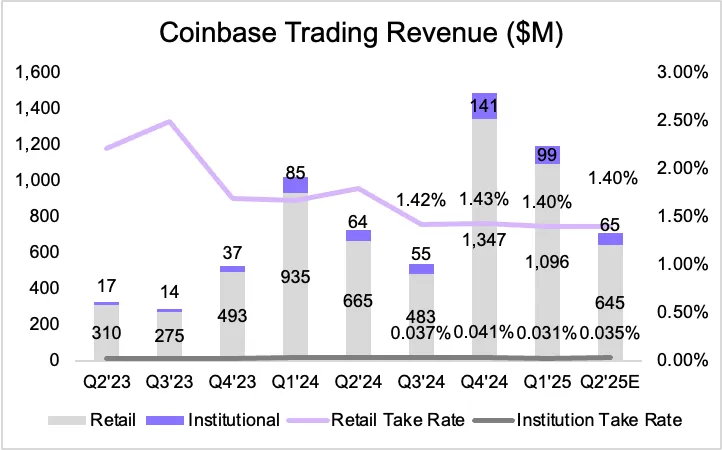
Coinbase’s trading activity can be observed via on-chain data, making trading-related revenue estimation relatively straightforward. In Q2, Coinbase’s total trading volume was $232 billion, down 41% from Q1. This decline reflects a broader cooling in the crypto market, particularly after Memecoins tied to Trump election narratives lost steam. Volume dropped notably in the second half of the quarter. Retail trading consistently accounted for 18–20% of total volume. For Q2, we use the upper bound of 20% for our estimate.
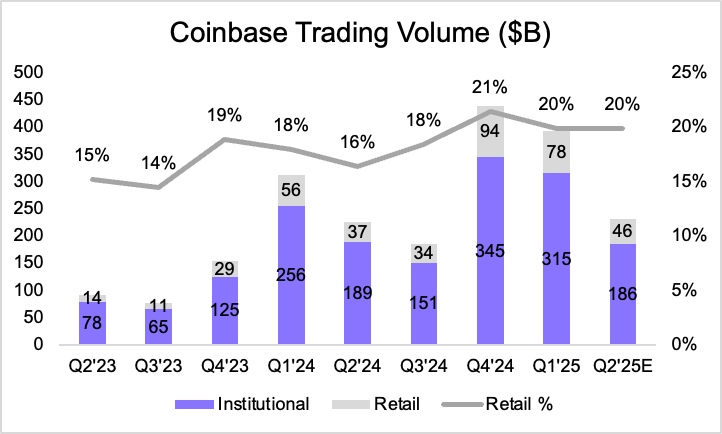
Applying a 1.4% fee rate to retail trades, we estimate retail revenue at $645 million. For institutional clients, assuming a slightly higher fee rate of 0.035% to reflect Coinbase’s derivatives offerings, we project about $65 million in revenue. Combined, total trading revenue is estimated at $710 million.
Base Network Revenue
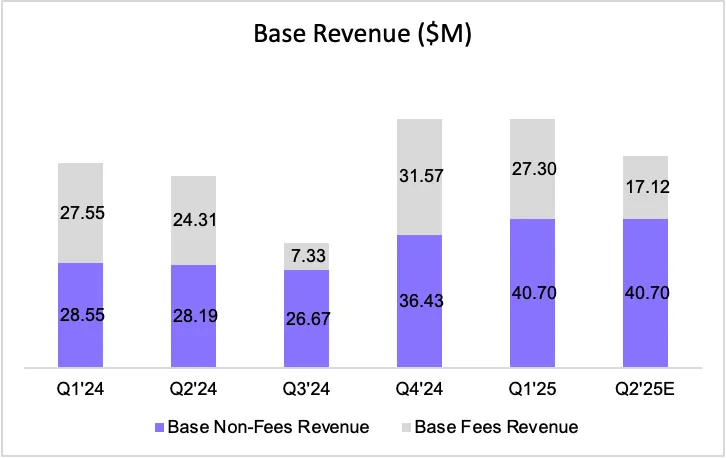
Coinbase’s Layer 2 network, Base, earns revenue from transaction fees and potentially other non-fee sources. On-chain data allows direct tracking of fee income—we estimate $17.12 million in fee revenue for Q2. However, Base’s reported revenue has historically exceeded on-chain fee totals, suggesting additional income from B2B partnerships or infrastructure services. Assuming non-fee revenue remains steady at $40.7 million (based on recent quarters), Base’s total Q2 revenue is estimated at $57.82 million.
Blockchain Rewards Revenue
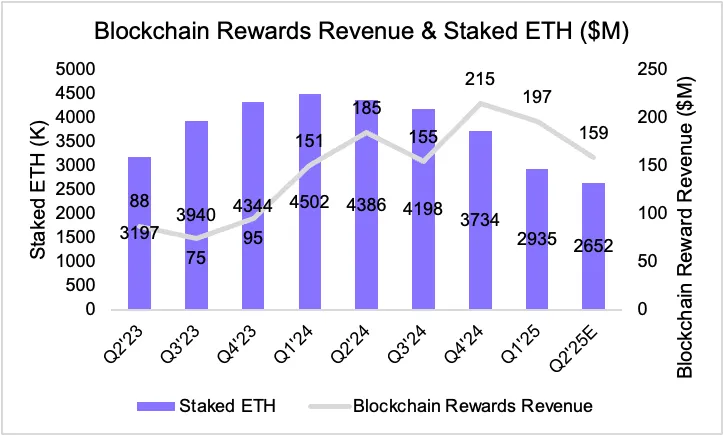
Coinbase offers staking services for multiple assets. To simplify, we use staked ETH as a proxy for estimating blockchain rewards. On-chain data shows Coinbase’s staked ETH decreased from 2.935 million to 2.652 million in Q2, likely due to redemptions and rebalancing.
Based on this ETH price range and average reward assumptions, we estimate blockchain rewards revenue at approximately $159 million. While approximate, this method captures the trend of this revenue stream.
Stablecoin Revenue
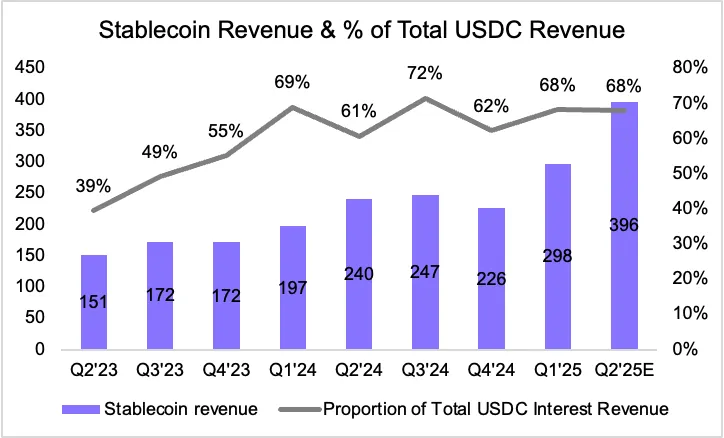
USDC-driven stablecoin operations were the main growth driver in Q2. USDC’s market cap surged to $60 billion, up 36.7% quarter-on-quarter. To estimate reserve yield, we use the 52-week U.S. Treasury yield, which declined slightly from 3.97% to 3.88%. Despite lower rates, the explosive growth in USDC supply more than offset this decline.
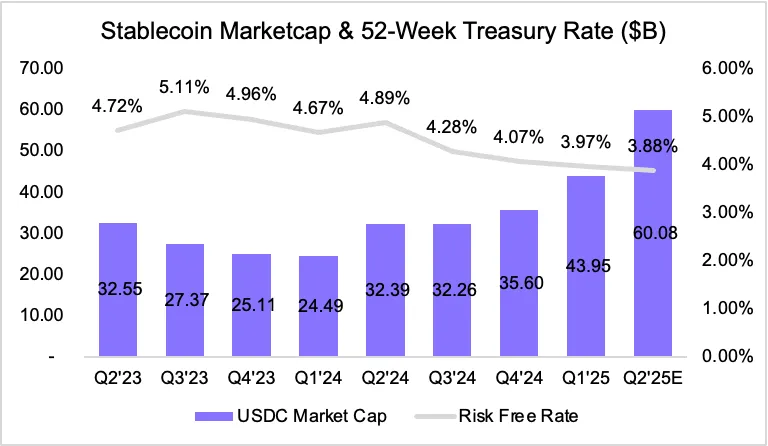
Coinbase’s share of USDC’s total revenue has fluctuated between 62% and 72% in recent quarters. Using a median of 68%, we estimate Q2 stablecoin-related revenue at $396 million.
Other Subscription and Services Revenue
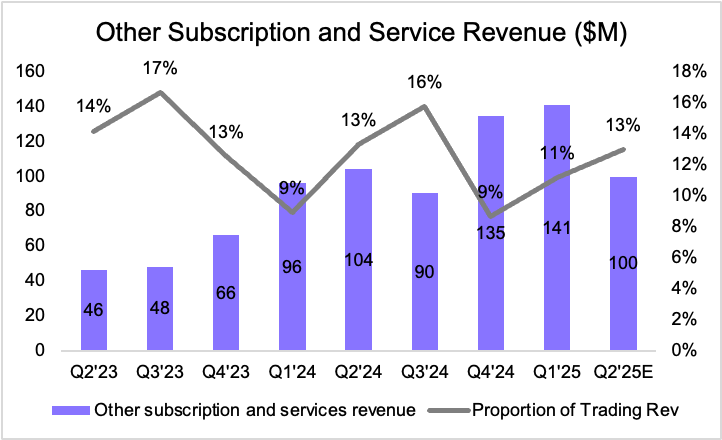
This category includes Coinbase One (its premium subscription) and custody fees—especially for ETF clients. We treat this as a function of total trading activity. Multiplying it by 13% of trading revenue, we estimate $100 million for Q2, consistent with overall volume declines and representing a 29% drop quarter-on-quarter.
Interest Revenue
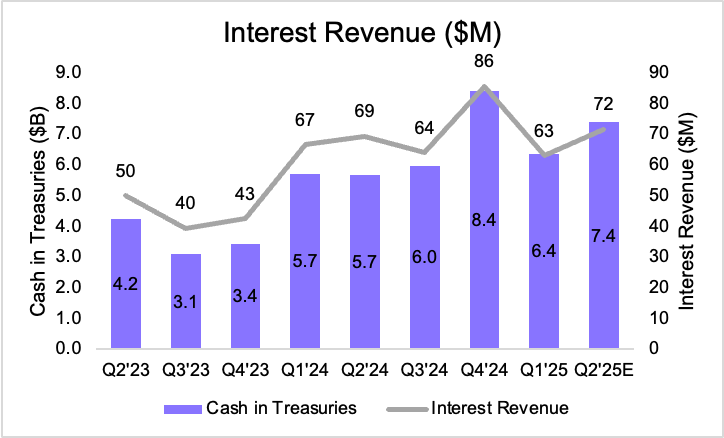
Finally, cash and Treasury holdings generate interest income. Using the same 52-week U.S. Treasury yield benchmark, we estimate Q2 interest income at $72 million. This represents a 12% increase from last quarter, driven primarily by growth in Coinbase’s Treasury holdings rather than yield changes (which slightly declined).
Conclusion: Comprehensive Analysis
By leveraging on-chain data, we built a detailed and timely estimate of Coinbase’s quarterly revenue ahead of the official earnings report. Aggregating all key business segments:
-
Trading Revenue: $710 million
-
Base Network Revenue: $57.82 million
-
Blockchain Rewards Revenue: $159 million
-
Stablecoin Revenue: $396 million
-
Other Subscription & Services Revenue: $117 million
-
Interest Revenue: $72 million
This brings our total Q2 revenue estimate for Coinbase to $1.495 billion, slightly below Wall Street’s expectation of $1.594 billion.
While some metrics rely on proxies and assumptions, the overall model demonstrates the power of on-chain transparency. As blockchain data becomes increasingly refined, even non-insiders can now make institutional-grade forecasts—a capability once exclusive to Wall Street analysts.
The author and affiliated companies of Artemis Analytics may have financial interests in the protocols or tokens mentioned. This article does not constitute investment advice or a recommendation to buy, sell, or hold any assets. Information provided is for general informational purposes only and should not be considered as financial, legal, or tax advice. Readers should evaluate their own circumstances before making any financial decisions. Views expressed are subject to change without notice. Artemis Analytics assumes no responsibility for any losses resulting from the use of this content.
Join TechFlow official community to stay tuned
Telegram:https://t.me/TechFlowDaily
X (Twitter):https://x.com/TechFlowPost
X (Twitter) EN:https://x.com/BlockFlow_News